| Param | Original file | Final file |
|---|---|---|
| Filename | modeM0/AS1A08_004T03_9000003438_23246cztM0_level2.evt | modeM0/AS1A08_004T03_9000003438_23246cztM0_level2_quad_clean.evt |
| Size (bytes) | 474,462,720 | 98,444,160 |
| Size | 452.5 MB | 93.9 MB |
| Events in quadrant A | 3,329,908 | 655,425 |
| Events in quadrant B | 3,399,301 | 665,432 |
| Events in quadrant C | 3,413,373 | 615,408 |
| Events in quadrant D | 3,798,149 | 604,877 |
| Mode M9 | |||
|---|---|---|---|
| Quadrant | BADHDUFLAG | Total packets | Discarded packets |
| A | 0 | 18 | 0 |
| B | 0 | 19 | 0 |
| C | 0 | 19 | 0 |
| D | 0 | 19 | 0 |
| Mode M0 | |||
|---|---|---|---|
| Quadrant | BADHDUFLAG | Total packets | Discarded packets |
| A | 0 | 13743 | 2 |
| B | 0 | 13920 | 2 |
| C | 0 | 13887 | 2 |
| D | 0 | 15194 | 3 |
| Mode SS | |||
|---|---|---|---|
| Quadrant | BADHDUFLAG | Total packets | Discarded packets |
| A | 0 | 126 | 0 |
| B | 0 | 126 | 0 |
| C | 0 | 126 | 0 |
| D | 0 | 126 | 0 |
| Quadrant | Total seconds | Saturated seconds | Saturation percentage |
|---|---|---|---|
| A | 6317 | 87 | 1.377236% |
| B | 6317 | 109 | 1.725503% |
| C | 6317 | 159 | 2.517018% |
| D | 6316 | 138 | 2.184927% |
Noise dominated data is calculated using 1-second bins in cleaned event files. If a bin has >2000 counts, and if more than 50% of those come from <1% of pixels, then it is considered to be noise-dominated and hence unusable.
| Quadrant | # 1 sec bins | Bins with >0 counts | Bins with >2000 counts | High rate bins dominated by noise | Noise dominated (total time) | Noise dominated (detector-on time) | Marked lightcurve |
|---|---|---|---|---|---|---|---|
| A | 7637 | 6317 | 0 | 0 | 0.00% | 0.00% | 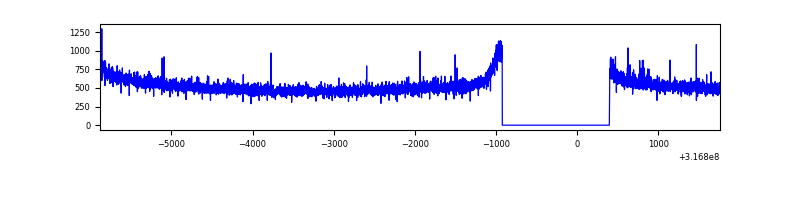 |
| B | 7637 | 6317 | 5 | 5 | 0.07% | 0.08% | 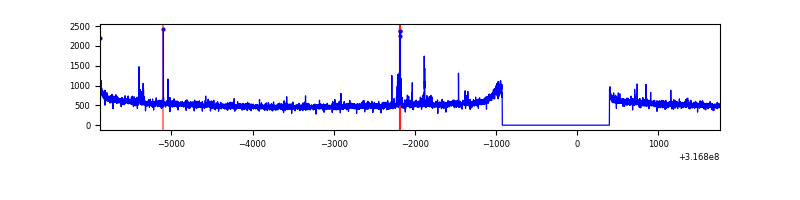 |
| C | 7637 | 6317 | 14 | 14 | 0.18% | 0.22% | 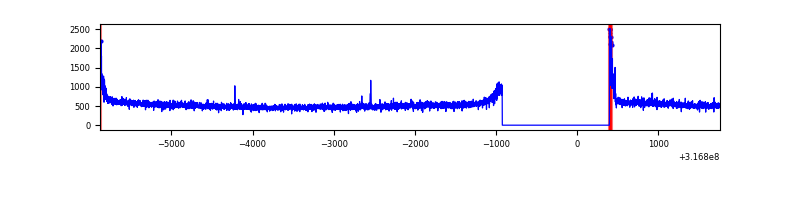 |
| D | 7636 | 6316 | 58 | 58 | 0.76% | 0.92% | 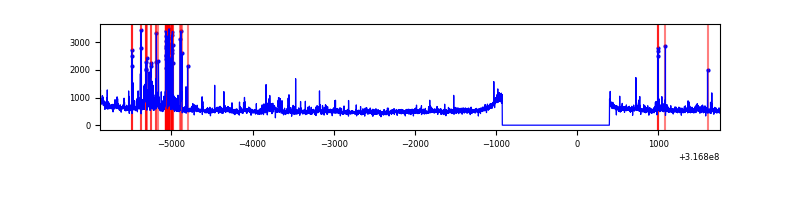 |
Top three noisy pixels from each quadrant. If the there are fewer than three noisy pixels in the level2.evt file, extra rows are filled as -1
| Pixel properties | Quadrant properties | ||||||
|---|---|---|---|---|---|---|---|
| Quadrant | DetID | PixID | Counts | Sigma | Mean | Median | Sigma |
| A | 6 | 16 | 31453 | 179.38 | 856 | 841 | 170.7 |
| A | 13 | 254 | 8677 | 45.92 | 856 | 841 | 170.7 |
| A | 0 | 226 | 7676 | 40.05 | 856 | 841 | 170.7 |
| B | 3 | 64 | 39954 | 246.07 | 849 | 832 | 159.0 |
| B | 0 | 190 | 19128 | 115.08 | 849 | 832 | 159.0 |
| B | 12 | 111 | 17917 | 107.46 | 849 | 832 | 159.0 |
| C | 14 | 238 | 128038 | 680.08 | 806 | 813 | 187.1 |
| C | 0 | 10 | 101685 | 539.21 | 806 | 813 | 187.1 |
| C | 0 | 239 | 19468 | 99.72 | 806 | 813 | 187.1 |
| D | 1 | 52 | 382734 | 1904.51 | 826 | 805 | 200.5 |
| D | 7 | 238 | 173170 | 859.51 | 826 | 805 | 200.5 |
| D | 12 | 233 | 33685 | 163.96 | 826 | 805 | 200.5 |
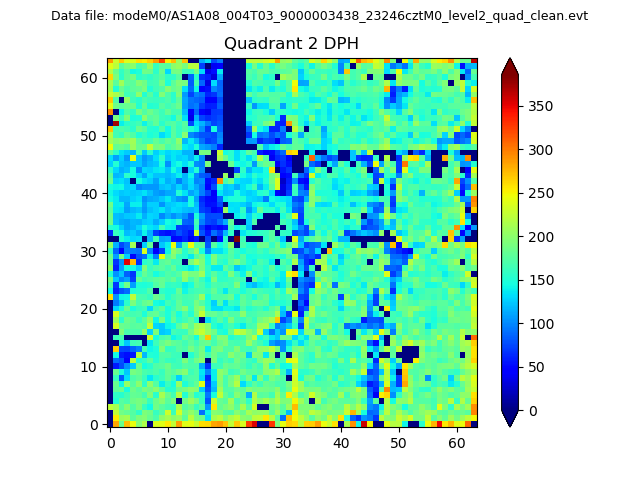
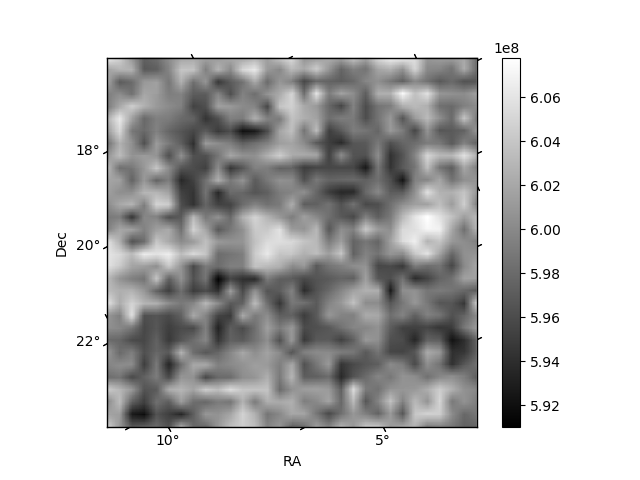
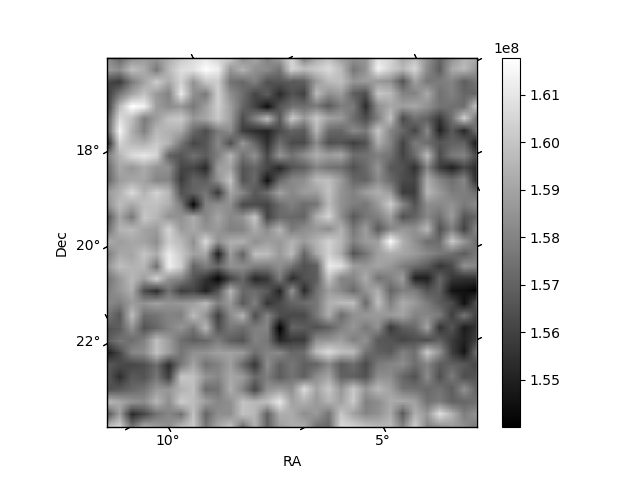
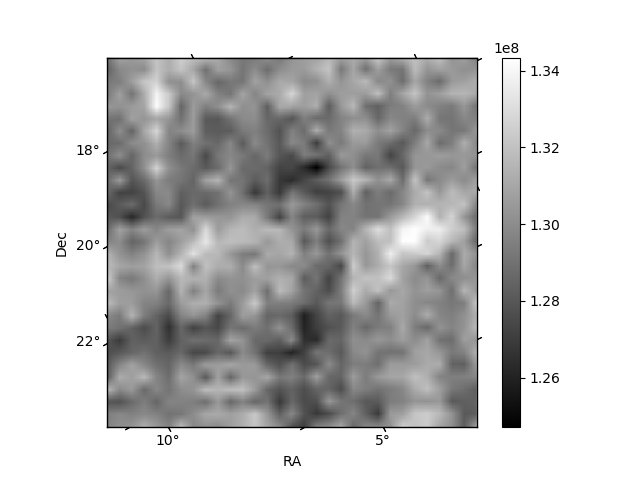
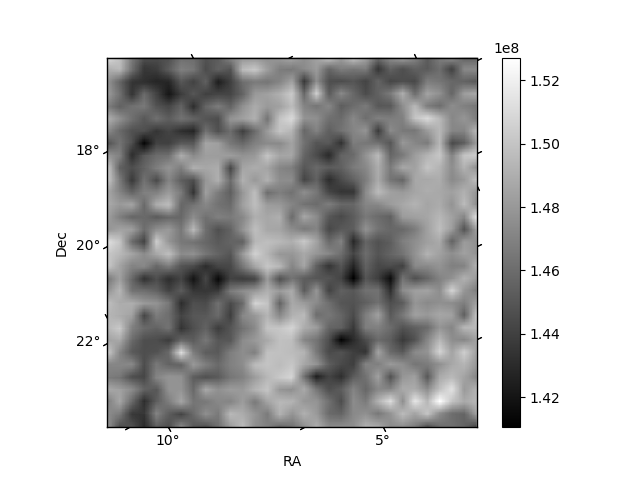
Histogram calculated using DETX and DETY for each event in the final _common_clean file
| Quadrant A | 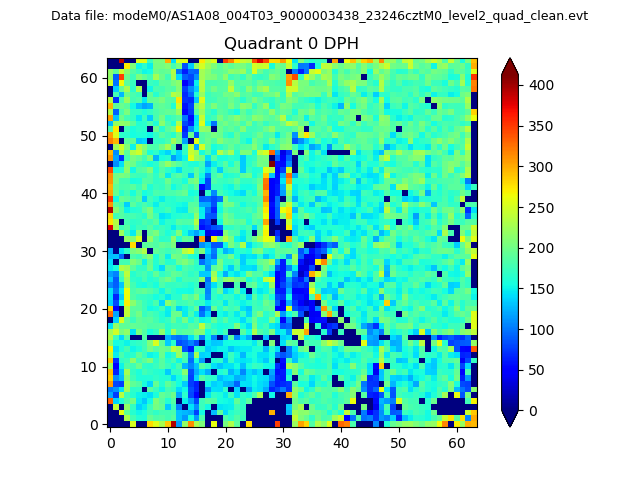 |
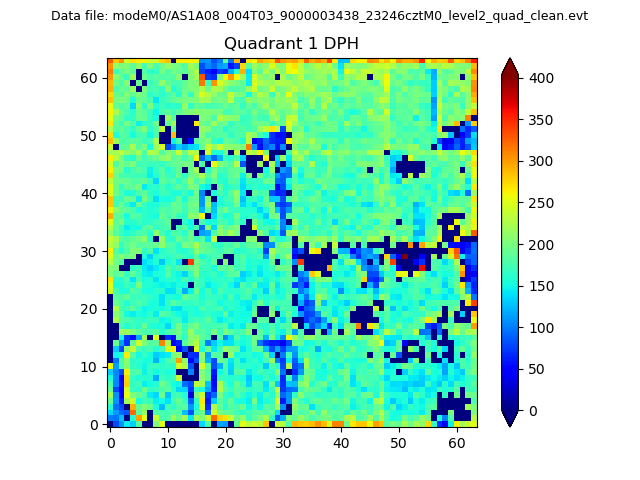 |
Quadrant B |
|---|---|---|---|
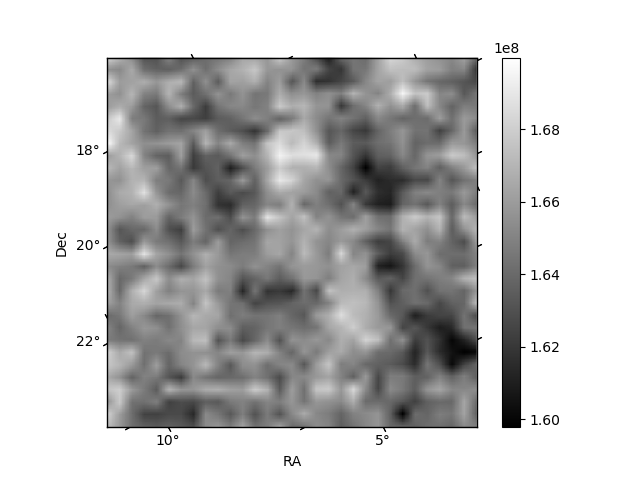
| Quadrant D | 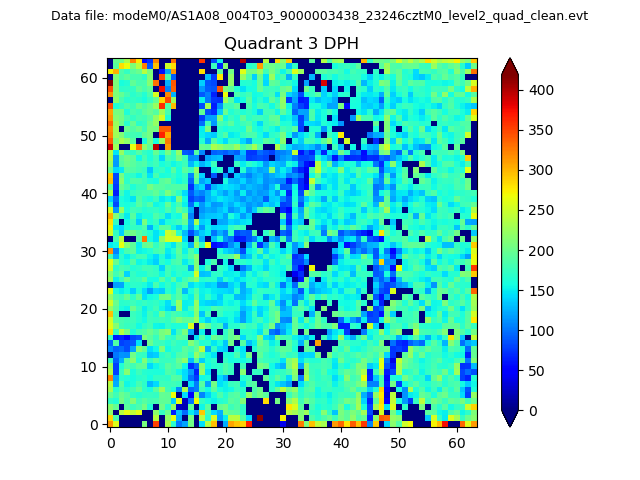 |
 |
Quadrant C |
| Plot type | Count rate plots | Images |
|---|---|---|
| Comparison with Poisson distribution Blue bars denote a histogram of data divided into 1 sec bins. Red curve is a Poisson curve with rate = median count rate of data. |
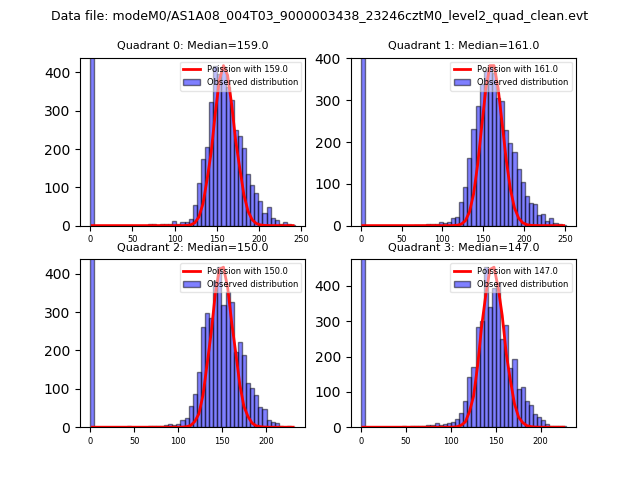 |
 |
| Quadrant-wise count rates Data is divided into 100 sec bins |
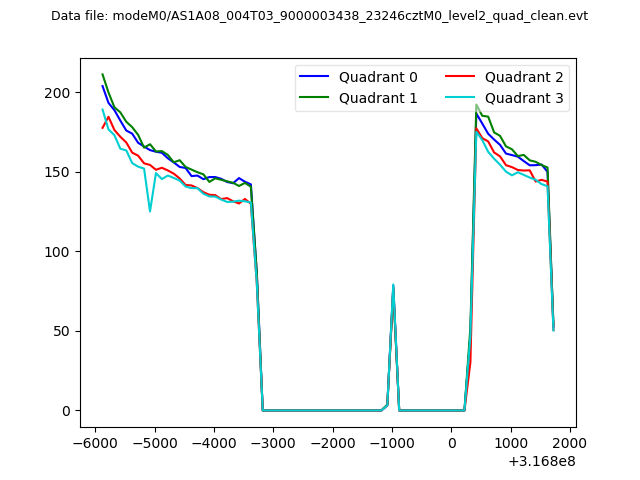 |
|
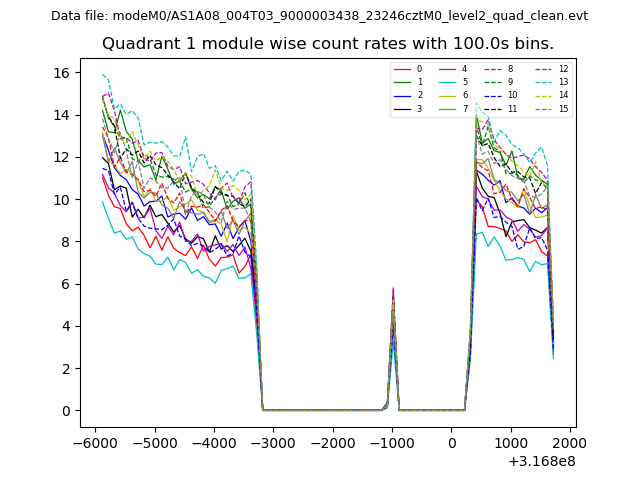
| Module-wise count rates for Quadrant A Data is divided into 100 sec bins |
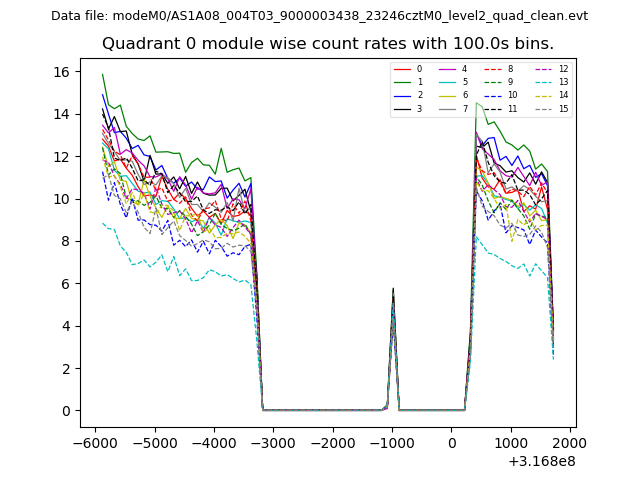 |
 |
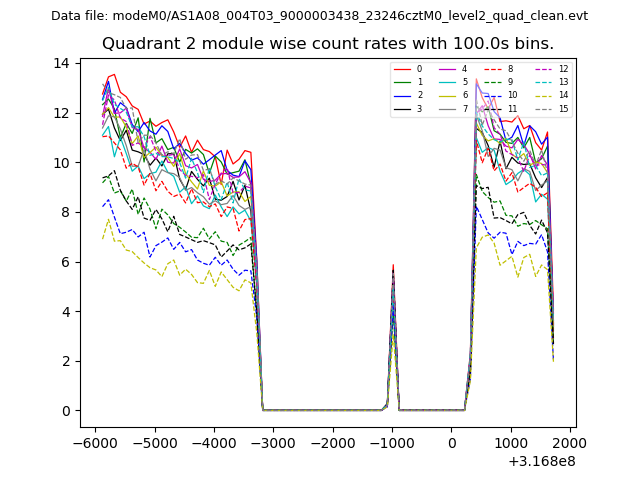
| Module-wise count rates for Quadrant B Data is divided into 100 sec bins |
 |
 |
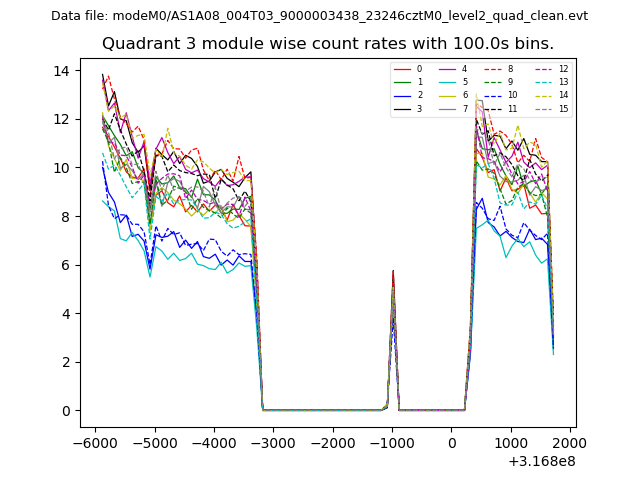
| Module-wise count rates for Quadrant C Data is divided into 100 sec bins |
 |
 |
| Module-wise count rates for Quadrant D Data is divided into 100 sec bins |
 |
 |
| Parameter | Plot |
|---|---|
| CZT HV Monitor | 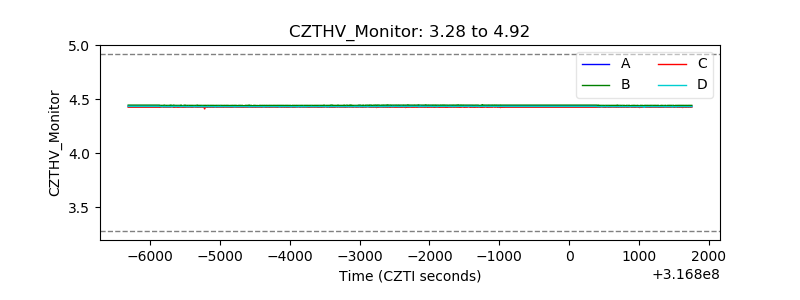 |
| D_VDD | 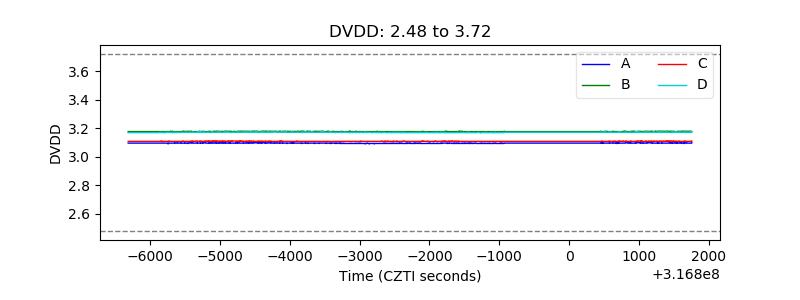 |
| Temperature 1 | 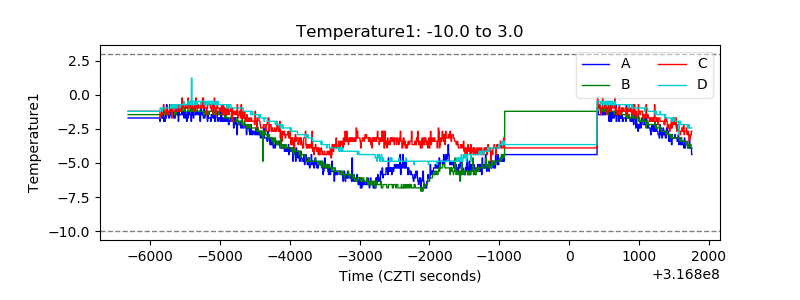 |
| Veto HV Monitor | 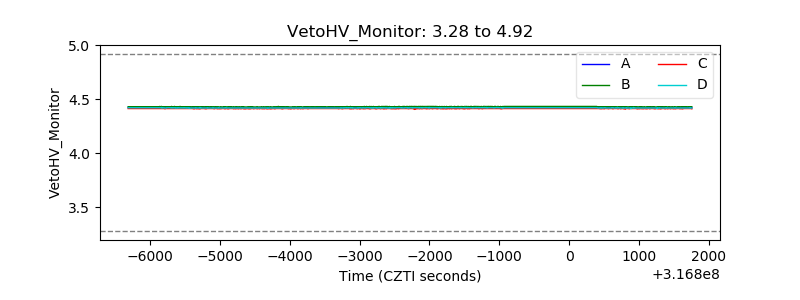 |
| Veto LLD | 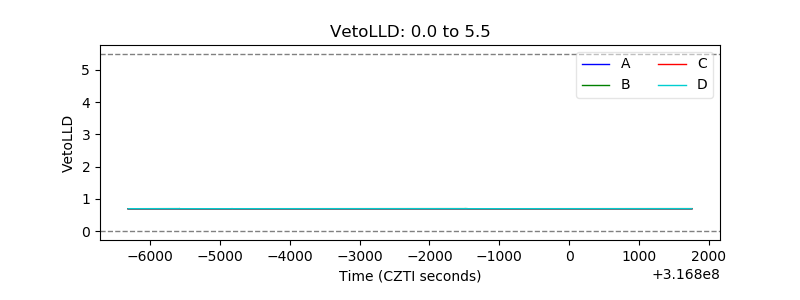 |
| Alpha Counter | 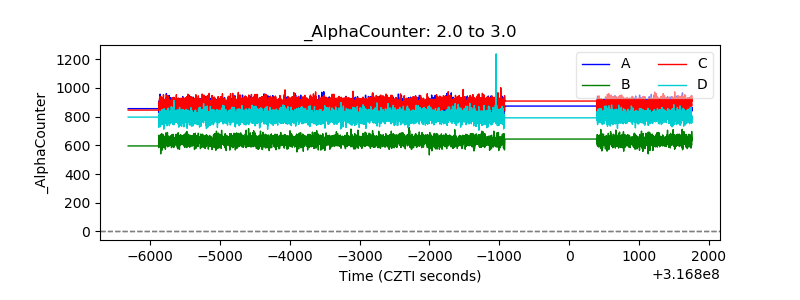 |
| _CPM_Rate | 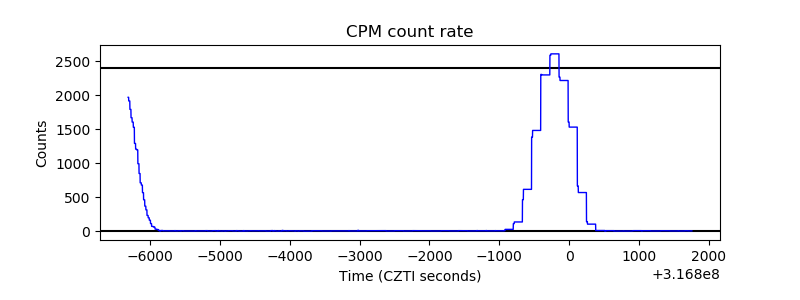 |
| CZT Counter | 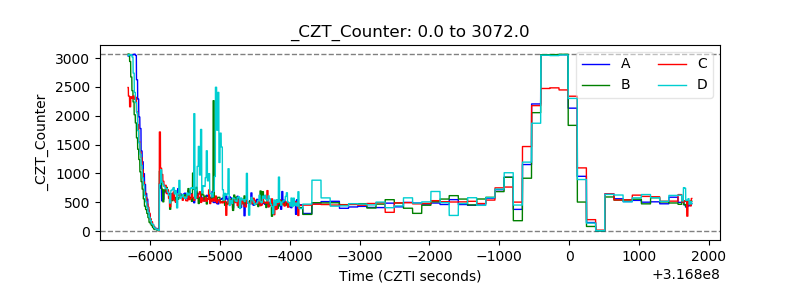 |
| +2.5 Volts monitor | 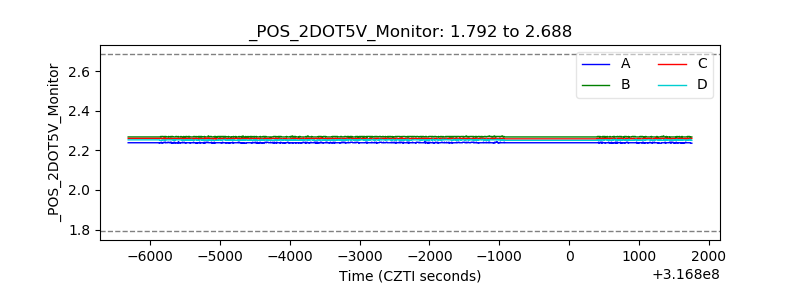 |
| +5 Volts monitor | 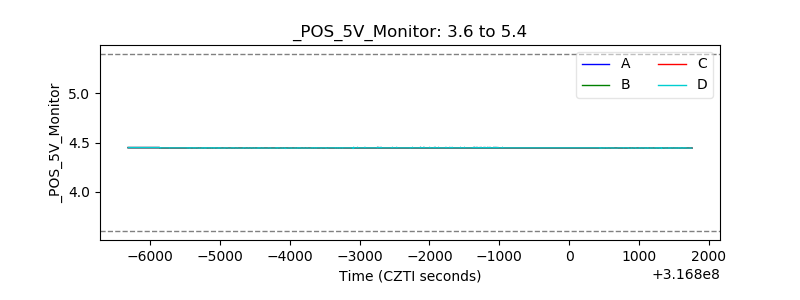 |
| _ROLL_ROT | 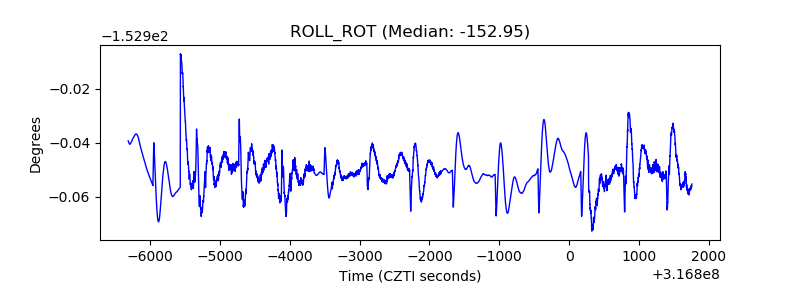 |
| _Roll_DEC | 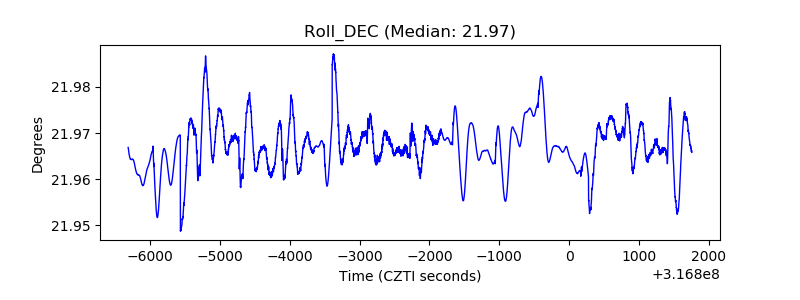 |
| _Roll_RA | 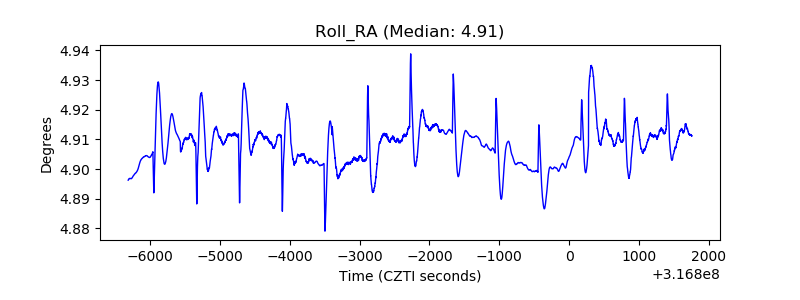 |
| Veto Counter | 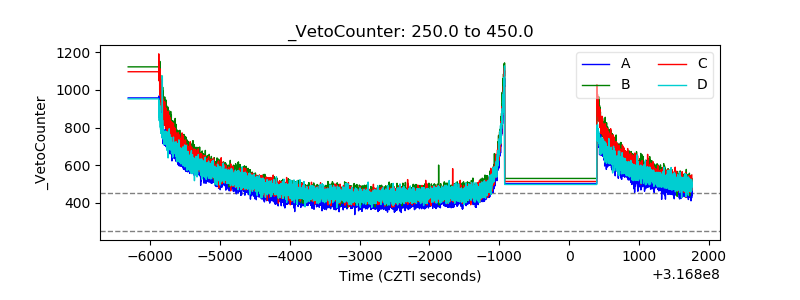 |