| Param | Original file | Final file |
|---|---|---|
| Filename | modeM0/AS1A08_004T03_9000003438_23247cztM0_level2.evt | modeM0/AS1A08_004T03_9000003438_23247cztM0_level2_quad_clean.evt |
| Size (bytes) | 476,576,640 | 91,313,280 |
| Size | 454.5 MB | 87.1 MB |
| Events in quadrant A | 3,102,786 | 598,855 |
| Events in quadrant B | 3,147,683 | 614,316 |
| Events in quadrant C | 3,845,775 | 567,690 |
| Events in quadrant D | 3,922,421 | 558,001 |
| Mode M9 | |||
|---|---|---|---|
| Quadrant | BADHDUFLAG | Total packets | Discarded packets |
| A | 0 | 20 | 0 |
| B | 0 | 21 | 0 |
| C | 0 | 21 | 0 |
| D | 0 | 21 | 0 |
| Mode M0 | |||
|---|---|---|---|
| Quadrant | BADHDUFLAG | Total packets | Discarded packets |
| A | 0 | 12942 | 2 |
| B | 0 | 12953 | 3 |
| C | 0 | 15229 | 2 |
| D | 0 | 15640 | 2 |
| Mode SS | |||
|---|---|---|---|
| Quadrant | BADHDUFLAG | Total packets | Discarded packets |
| A | 0 | 122 | 0 |
| B | 0 | 122 | 0 |
| C | 0 | 122 | 0 |
| D | 0 | 122 | 0 |
| Quadrant | Total seconds | Saturated seconds | Saturation percentage |
|---|---|---|---|
| A | 6117 | 30 | 0.490436% |
| B | 6116 | 42 | 0.686723% |
| C | 6116 | 148 | 2.419882% |
| D | 6116 | 104 | 1.700458% |
Noise dominated data is calculated using 1-second bins in cleaned event files. If a bin has >2000 counts, and if more than 50% of those come from <1% of pixels, then it is considered to be noise-dominated and hence unusable.
| Quadrant | # 1 sec bins | Bins with >0 counts | Bins with >2000 counts | High rate bins dominated by noise | Noise dominated (total time) | Noise dominated (detector-on time) | Marked lightcurve |
|---|---|---|---|---|---|---|---|
| A | 7467 | 6118 | 0 | 0 | 0.00% | 0.00% | 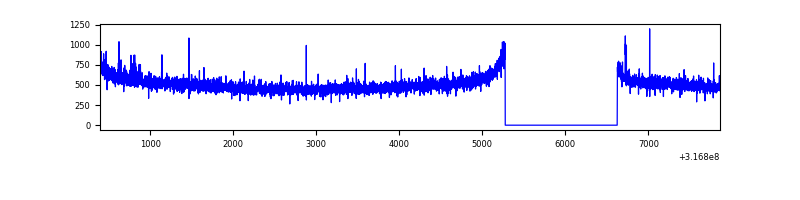 |
| B | 7466 | 6117 | 3 | 3 | 0.04% | 0.05% | 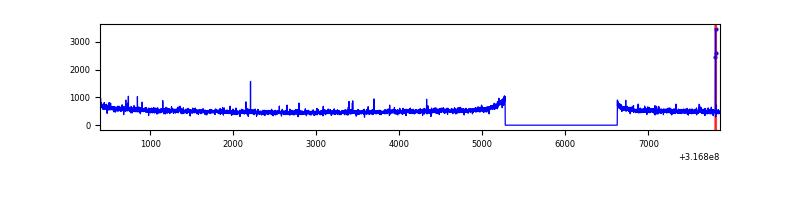 |
| C | 7466 | 6117 | 38 | 38 | 0.51% | 0.62% | 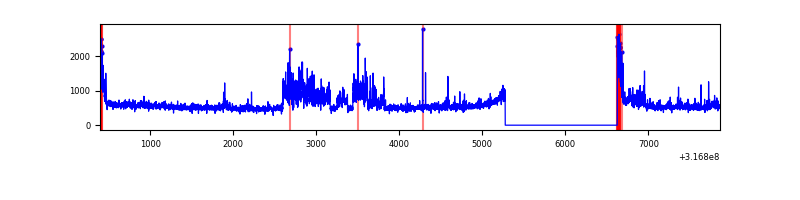 |
| D | 7466 | 6116 | 66 | 66 | 0.88% | 1.08% | 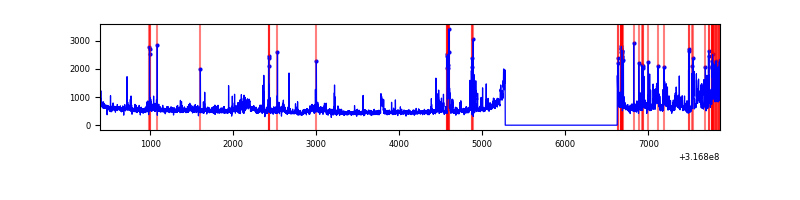 |
Top three noisy pixels from each quadrant. If the there are fewer than three noisy pixels in the level2.evt file, extra rows are filled as -1
| Pixel properties | Quadrant properties | ||||||
|---|---|---|---|---|---|---|---|
| Quadrant | DetID | PixID | Counts | Sigma | Mean | Median | Sigma |
| A | 6 | 16 | 24424 | 147.41 | 798 | 783 | 160.4 |
| A | 13 | 254 | 9172 | 52.31 | 798 | 783 | 160.4 |
| A | 0 | 226 | 7110 | 39.45 | 798 | 783 | 160.4 |
| B | 12 | 111 | 17114 | 107.48 | 800 | 782 | 151.9 |
| B | 11 | 111 | 14811 | 92.33 | 800 | 782 | 151.9 |
| B | 0 | 228 | 14617 | 91.05 | 800 | 782 | 151.9 |
| C | 0 | 239 | 493606 | 2790.52 | 761 | 767 | 176.6 |
| C | 0 | 10 | 150221 | 846.23 | 761 | 767 | 176.6 |
| C | 14 | 238 | 121518 | 683.71 | 761 | 767 | 176.6 |
| D | 1 | 52 | 609624 | 3207.56 | 775 | 752 | 189.8 |
| D | 2 | 152 | 240734 | 1264.23 | 775 | 752 | 189.8 |
| D | 13 | 172 | 62161 | 323.5 | 775 | 752 | 189.8 |
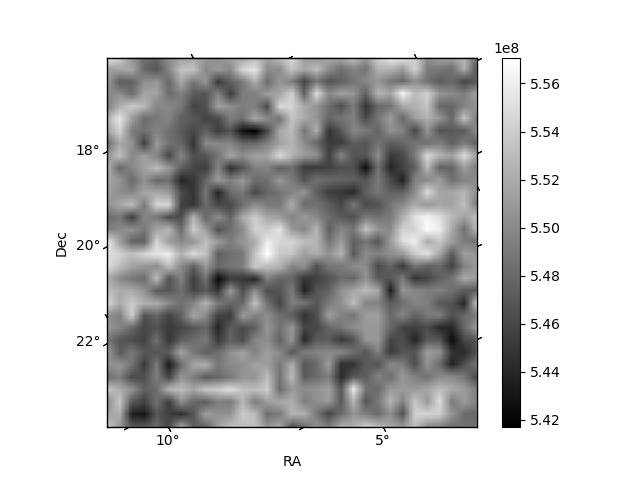
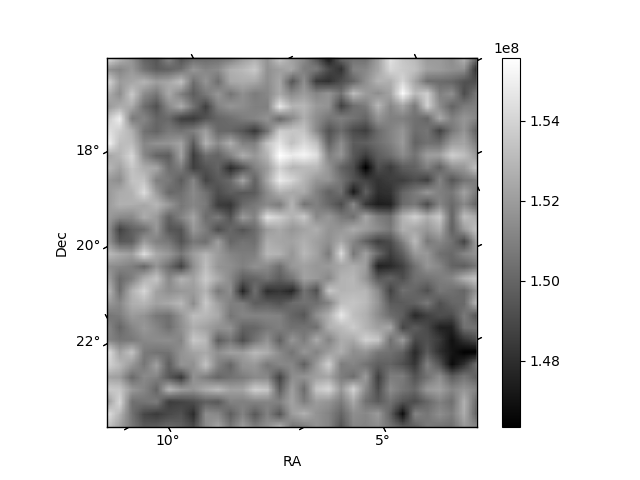
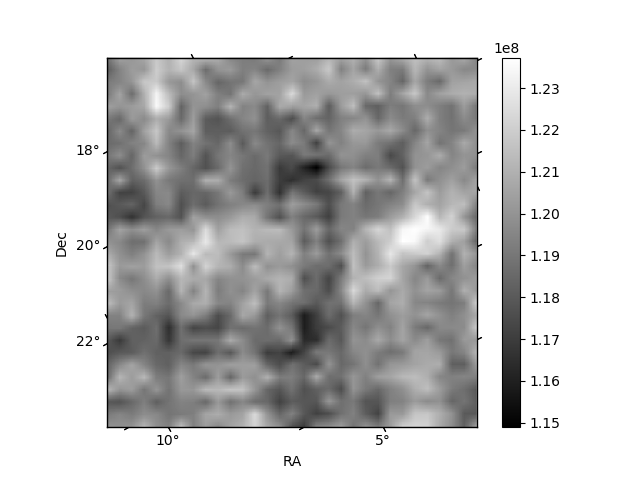
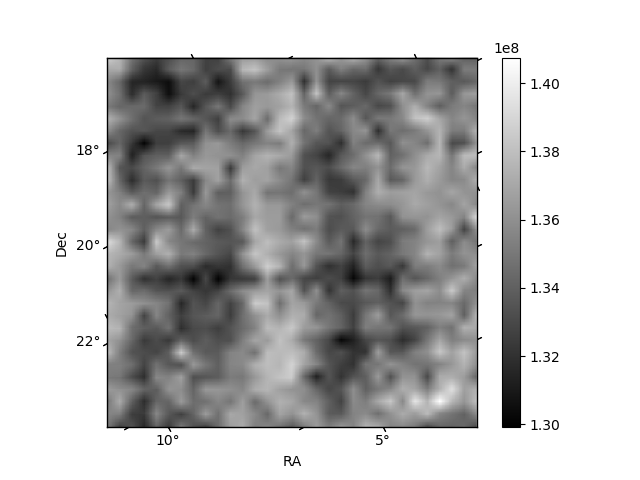
Histogram calculated using DETX and DETY for each event in the final _common_clean file
| Quadrant A | 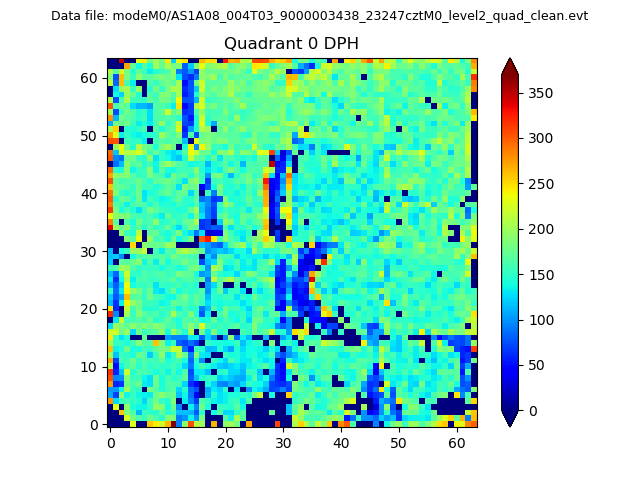 |
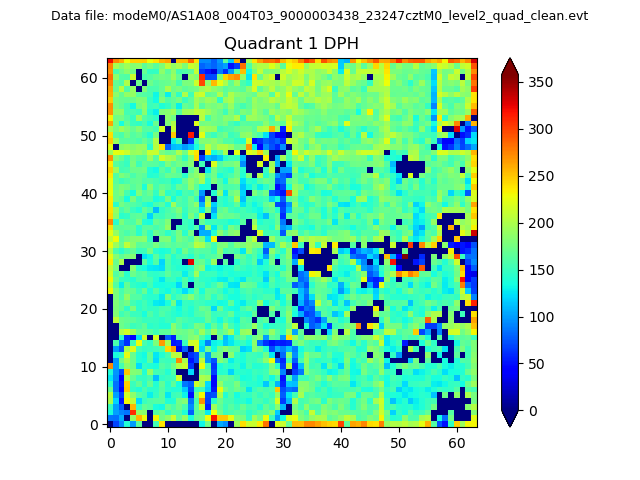 |
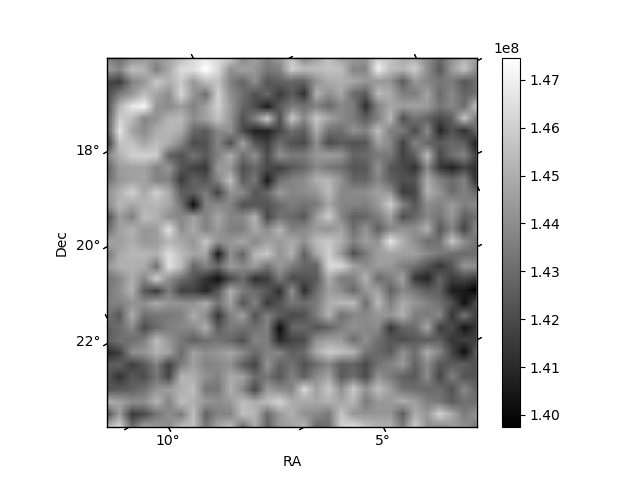
Quadrant B |
|---|---|---|---|
| Quadrant D | 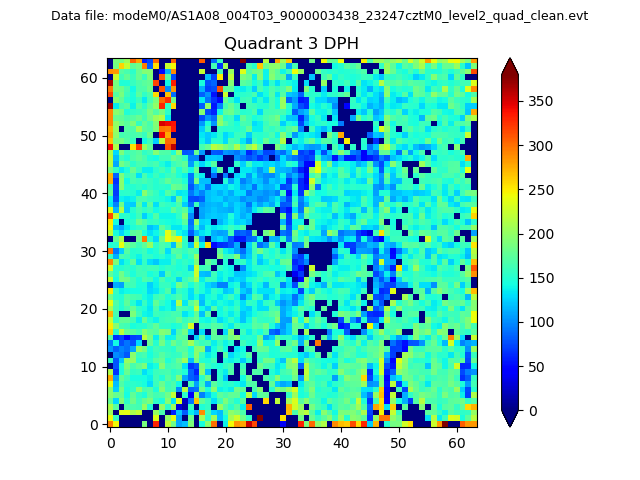 |
 |
Quadrant C |
| Plot type | Count rate plots | Images |
|---|---|---|
| Comparison with Poisson distribution Blue bars denote a histogram of data divided into 1 sec bins. Red curve is a Poisson curve with rate = median count rate of data. |
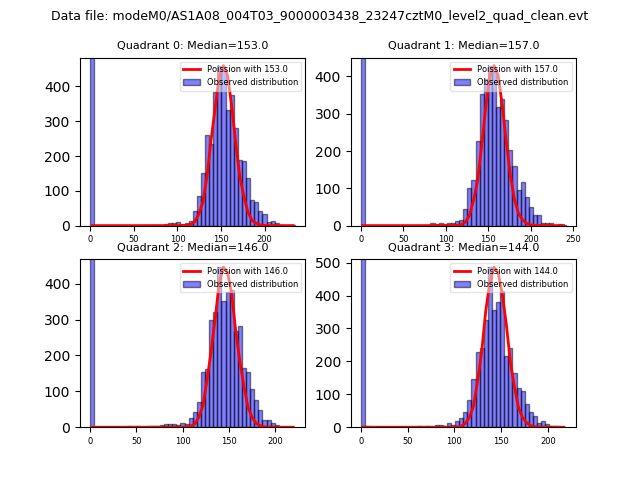 |
 |
| Quadrant-wise count rates Data is divided into 100 sec bins |
 |
|
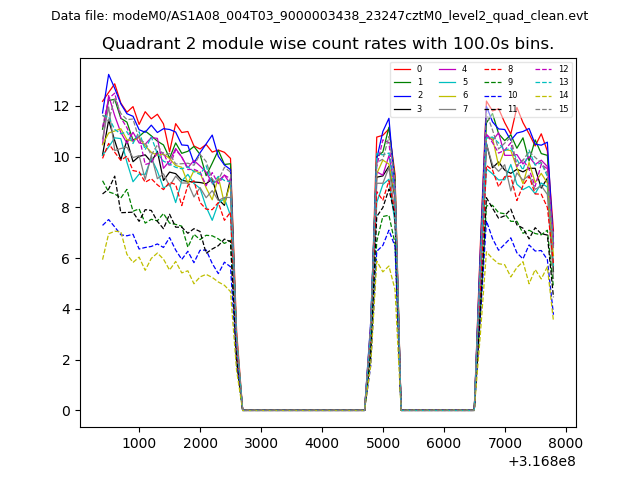
| Module-wise count rates for Quadrant A Data is divided into 100 sec bins |
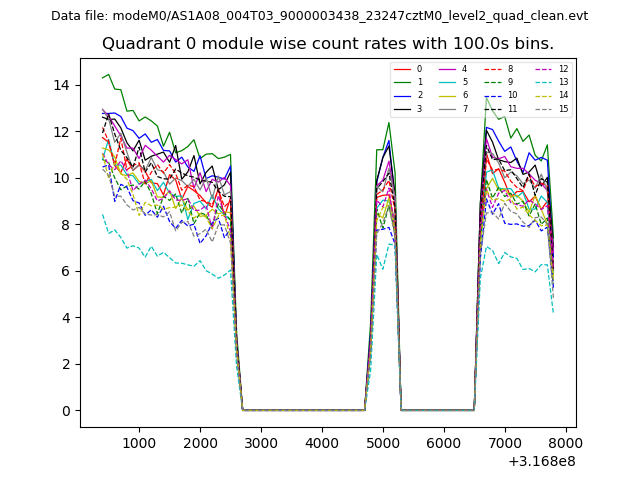 |
 |
| Module-wise count rates for Quadrant B Data is divided into 100 sec bins |
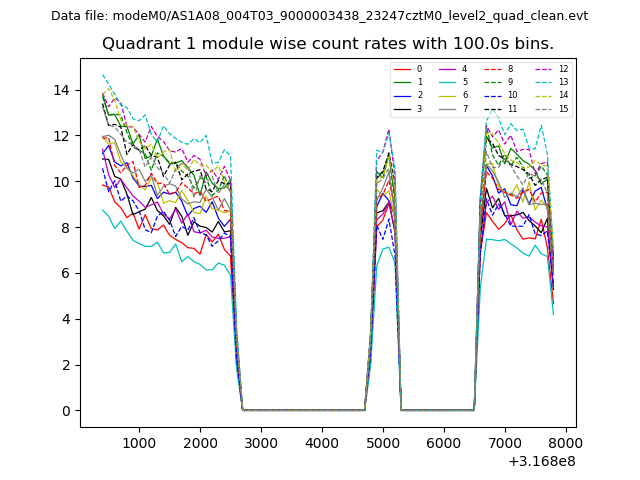 |
 |
| Module-wise count rates for Quadrant C Data is divided into 100 sec bins |
 |
 |
| Module-wise count rates for Quadrant D Data is divided into 100 sec bins |
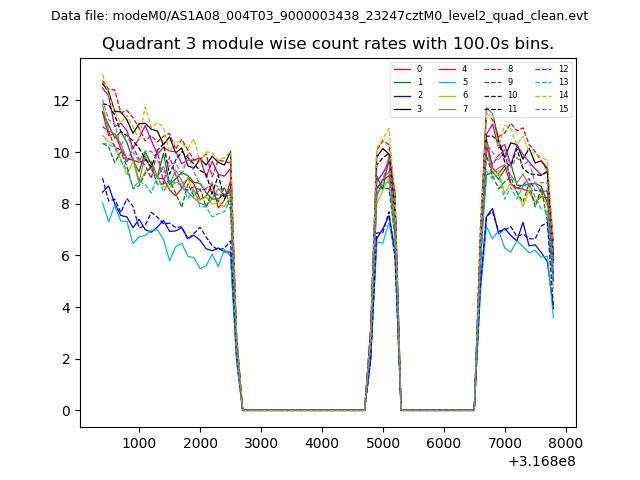 |
 |
| Parameter | Plot |
|---|---|
| CZT HV Monitor | 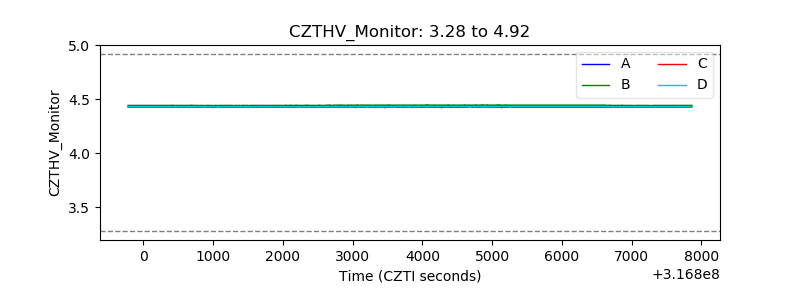 |
| D_VDD | 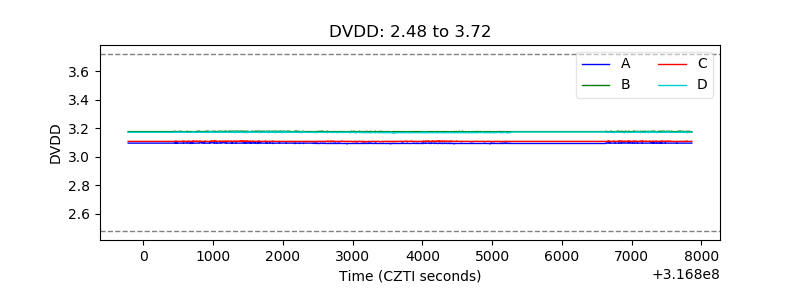 |
| Temperature 1 | 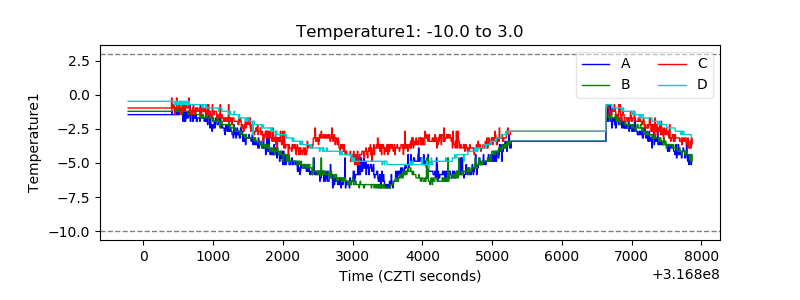 |
| Veto HV Monitor | 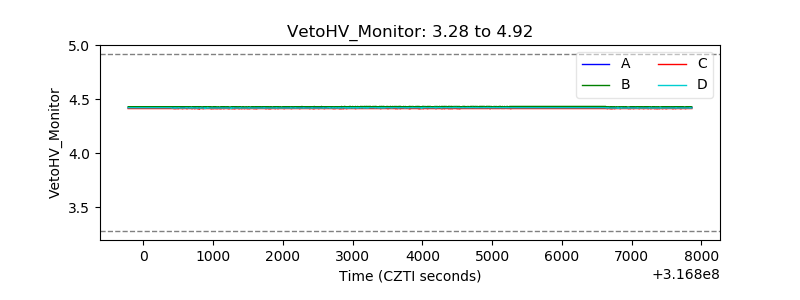 |
| Veto LLD | 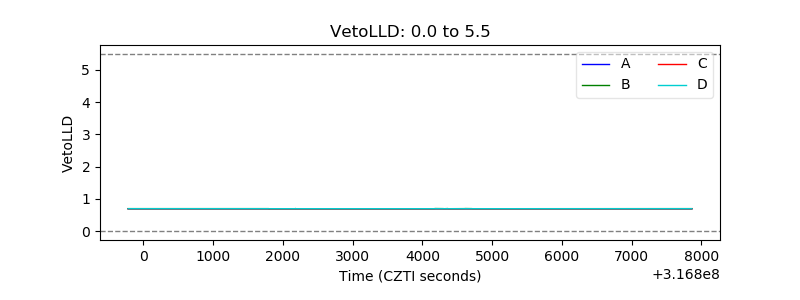 |
| Alpha Counter | 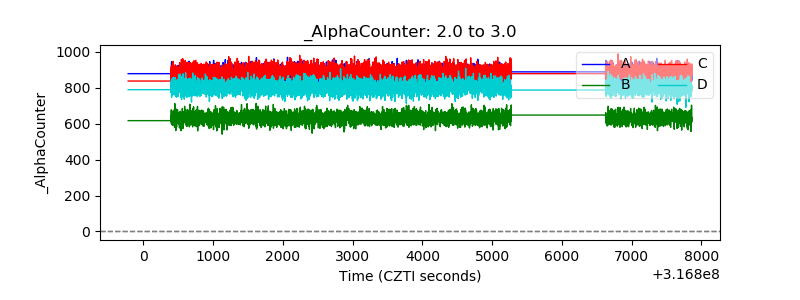 |
| _CPM_Rate | 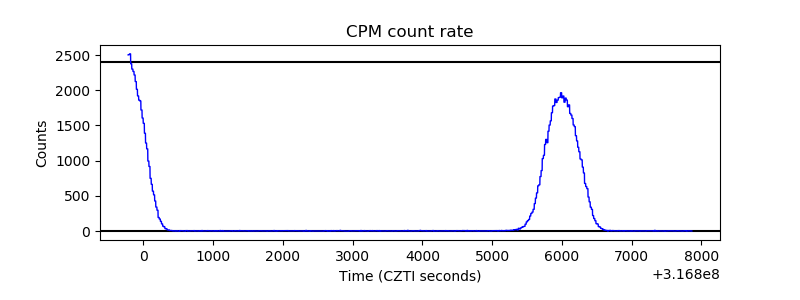 |
| CZT Counter |  |
| +2.5 Volts monitor |  |
| +5 Volts monitor |  |
| _ROLL_ROT | 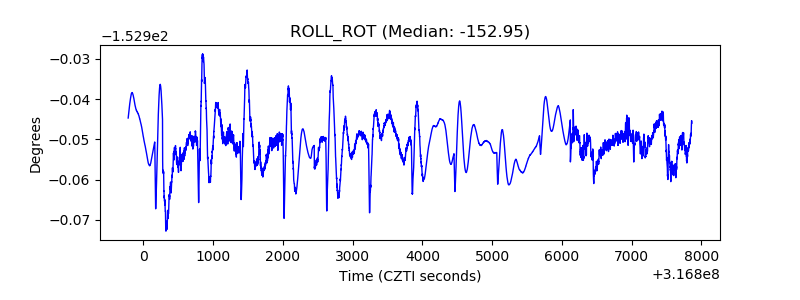 |
| _Roll_DEC | 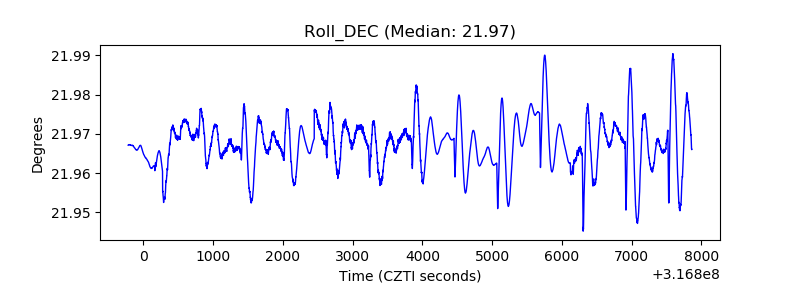 |
| _Roll_RA | 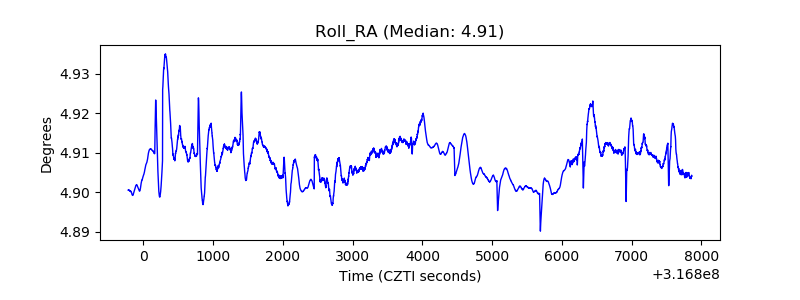 |
| Veto Counter | 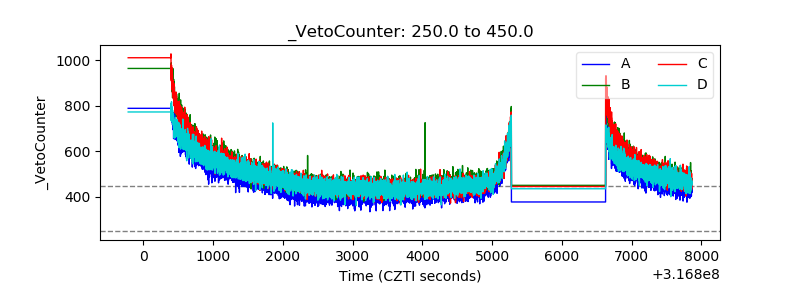 |