| Param | Original file | Final file |
|---|---|---|
| Filename | modeM0/AS1A08_004T03_9000003438_23248cztM0_level2.evt | modeM0/AS1A08_004T03_9000003438_23248cztM0_level2_quad_clean.evt |
| Size (bytes) | 485,196,480 | 87,514,560 |
| Size | 462.7 MB | 83.5 MB |
| Events in quadrant A | 3,053,260 | 568,180 |
| Events in quadrant B | 3,108,295 | 581,217 |
| Events in quadrant C | 3,352,345 | 544,426 |
| Events in quadrant D | 4,761,814 | 525,663 |
| Mode M9 | |||
|---|---|---|---|
| Quadrant | BADHDUFLAG | Total packets | Discarded packets |
| A | 0 | 18 | 1 |
| B | 0 | 19 | 2 |
| C | 0 | 19 | 1 |
| D | 0 | 19 | 1 |
| Mode M0 | |||
|---|---|---|---|
| Quadrant | BADHDUFLAG | Total packets | Discarded packets |
| A | 0 | 13277 | 425 |
| B | 0 | 13369 | 429 |
| C | 0 | 13961 | 408 |
| D | 0 | 19213 | 931 |
| Mode SS | |||
|---|---|---|---|
| Quadrant | BADHDUFLAG | Total packets | Discarded packets |
| A | 0 | 130 | 8 |
| B | 0 | 130 | 4 |
| C | 0 | 130 | 8 |
| D | 0 | 130 | 6 |
| Quadrant | Total seconds | Saturated seconds | Saturation percentage |
|---|---|---|---|
| A | 6171 | 32 | 0.518555% |
| B | 6168 | 55 | 0.891699% |
| C | 6177 | 133 | 2.153149% |
| D | 6158 | 181 | 2.939266% |
Noise dominated data is calculated using 1-second bins in cleaned event files. If a bin has >2000 counts, and if more than 50% of those come from <1% of pixels, then it is considered to be noise-dominated and hence unusable.
| Quadrant | # 1 sec bins | Bins with >0 counts | Bins with >2000 counts | High rate bins dominated by noise | Noise dominated (total time) | Noise dominated (detector-on time) | Marked lightcurve |
|---|---|---|---|---|---|---|---|
| A | 7521 | 6219 | 0 | 0 | 0.00% | 0.00% | 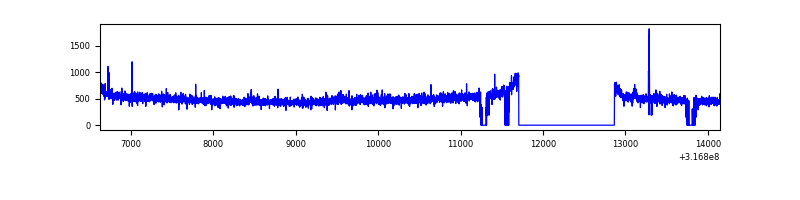 |
| B | 7521 | 6203 | 6 | 6 | 0.08% | 0.10% | 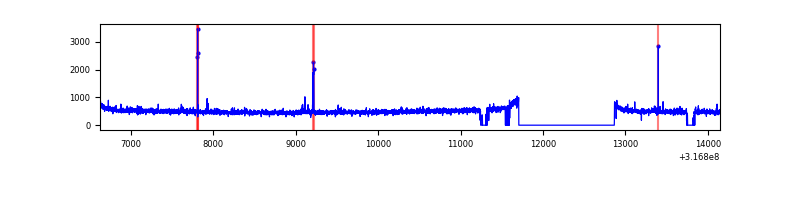 |
| C | 7521 | 6218 | 23 | 23 | 0.31% | 0.37% | 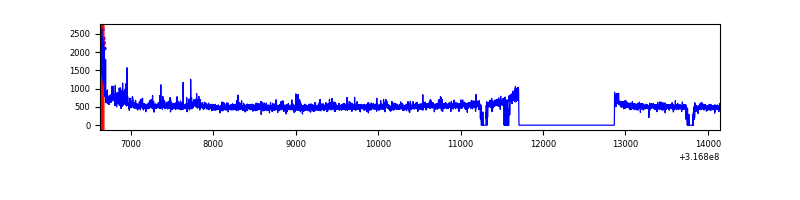 |
| D | 7520 | 6188 | 161 | 161 | 2.14% | 2.60% | 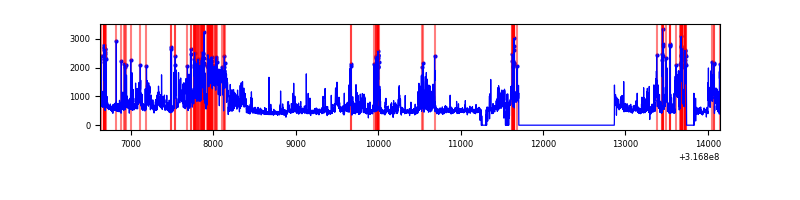 |
Top three noisy pixels from each quadrant. If the there are fewer than three noisy pixels in the level2.evt file, extra rows are filled as -1
| Pixel properties | Quadrant properties | ||||||
|---|---|---|---|---|---|---|---|
| Quadrant | DetID | PixID | Counts | Sigma | Mean | Median | Sigma |
| A | 6 | 16 | 50983 | 322.51 | 778 | 762 | 155.7 |
| A | 13 | 254 | 9949 | 59.0 | 778 | 762 | 155.7 |
| A | 0 | 226 | 6723 | 38.28 | 778 | 762 | 155.7 |
| B | 3 | 64 | 22927 | 150.06 | 781 | 764 | 147.7 |
| B | 12 | 111 | 17250 | 111.62 | 781 | 764 | 147.7 |
| B | 11 | 111 | 15379 | 98.95 | 781 | 764 | 147.7 |
| C | 0 | 239 | 126420 | 710.91 | 751 | 756 | 176.8 |
| C | 14 | 238 | 118652 | 666.96 | 751 | 756 | 176.8 |
| C | 0 | 10 | 80959 | 453.72 | 751 | 756 | 176.8 |
| D | 1 | 52 | 1294882 | 7074.07 | 753 | 732 | 182.9 |
| D | 2 | 152 | 500371 | 2731.12 | 753 | 732 | 182.9 |
| D | 13 | 104 | 30737 | 164.01 | 753 | 732 | 182.9 |
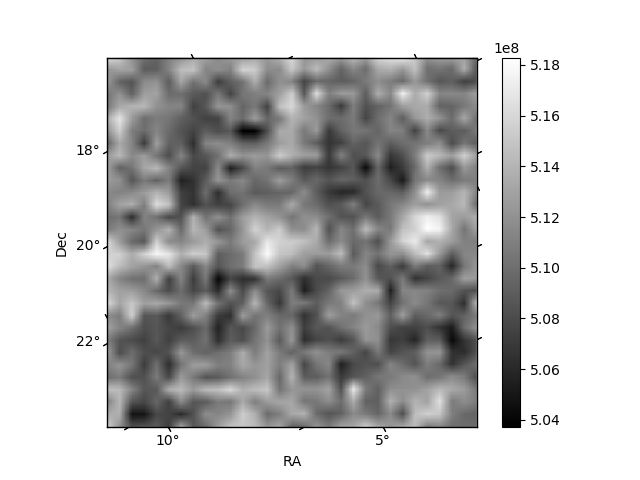
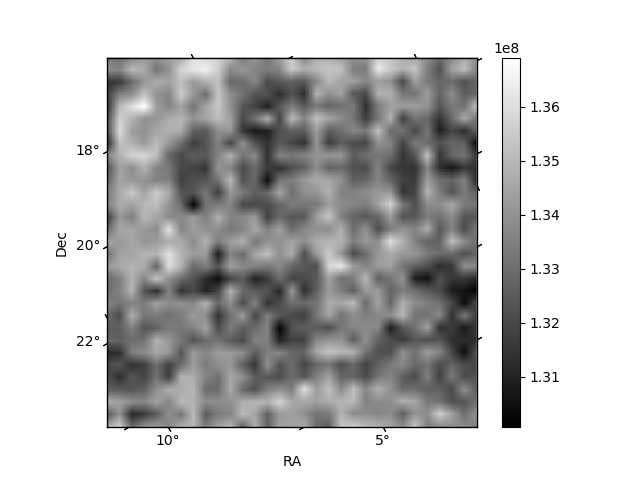
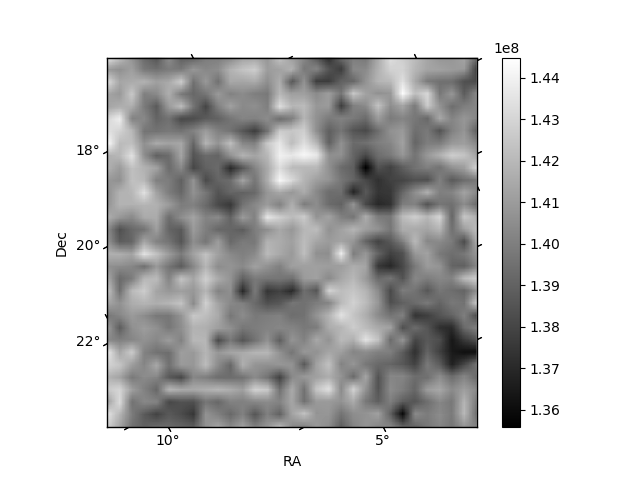
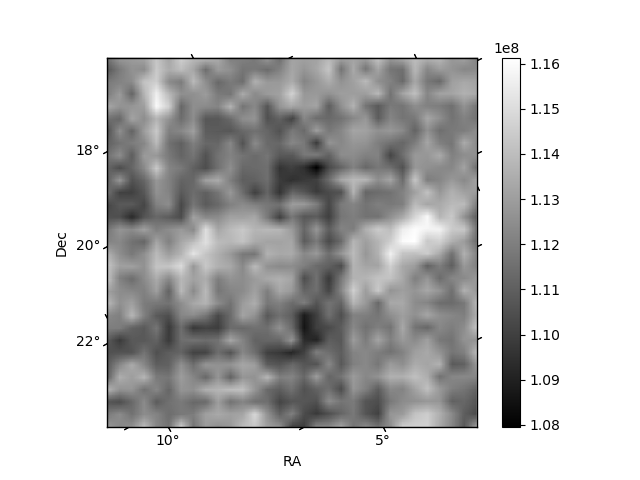
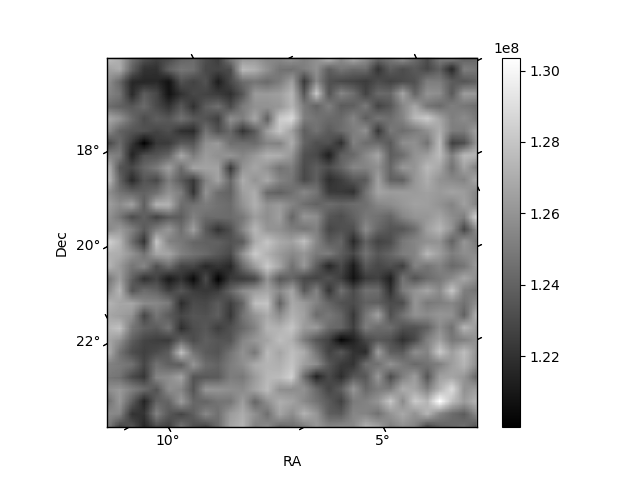
Histogram calculated using DETX and DETY for each event in the final _common_clean file
| Quadrant A | 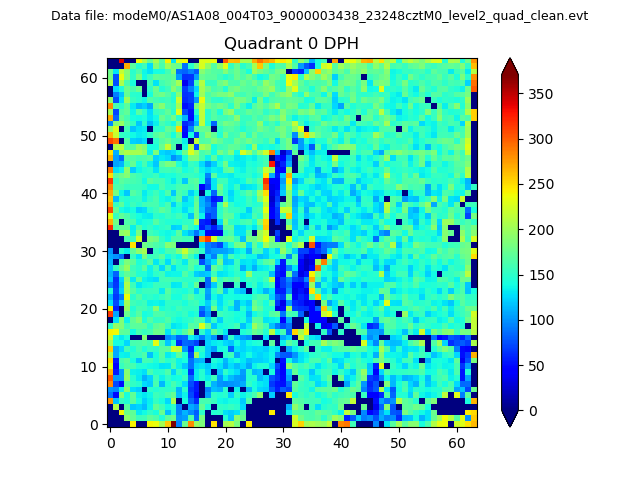 |
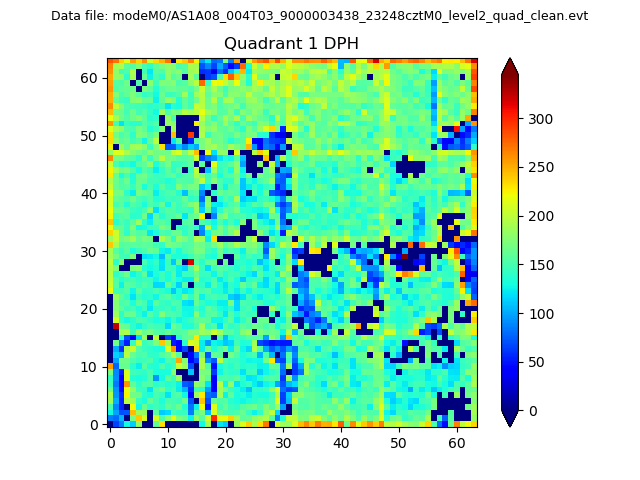 |
Quadrant B |
|---|---|---|---|
| Quadrant D | 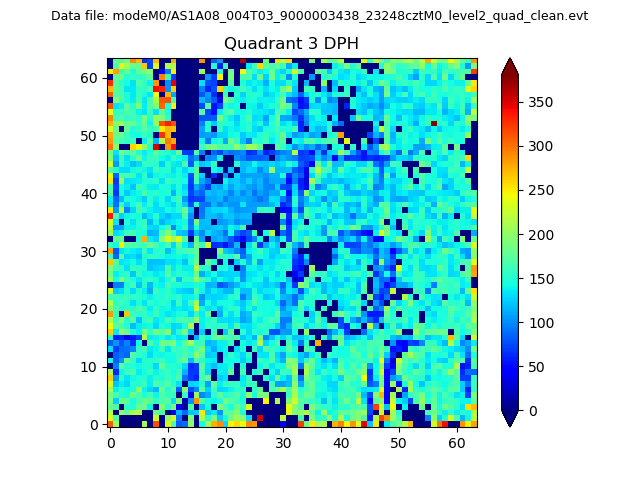 |
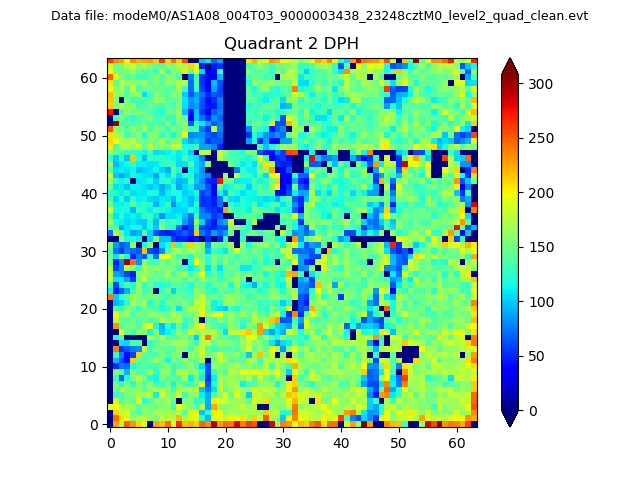 |
Quadrant C |
| Plot type | Count rate plots | Images |
|---|---|---|
| Comparison with Poisson distribution Blue bars denote a histogram of data divided into 1 sec bins. Red curve is a Poisson curve with rate = median count rate of data. |
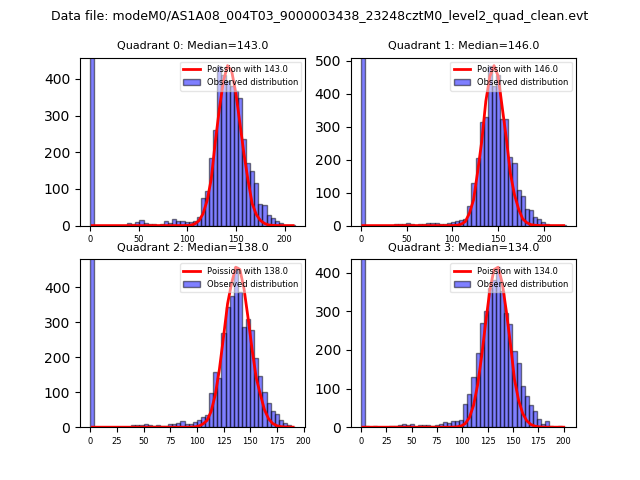 |
 |
| Quadrant-wise count rates Data is divided into 100 sec bins |
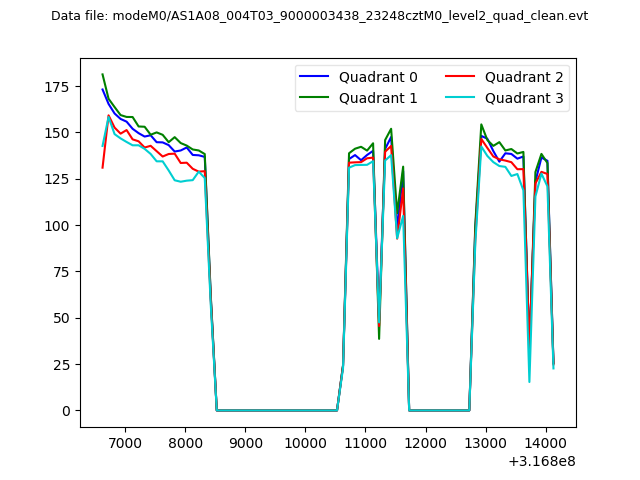 |
|
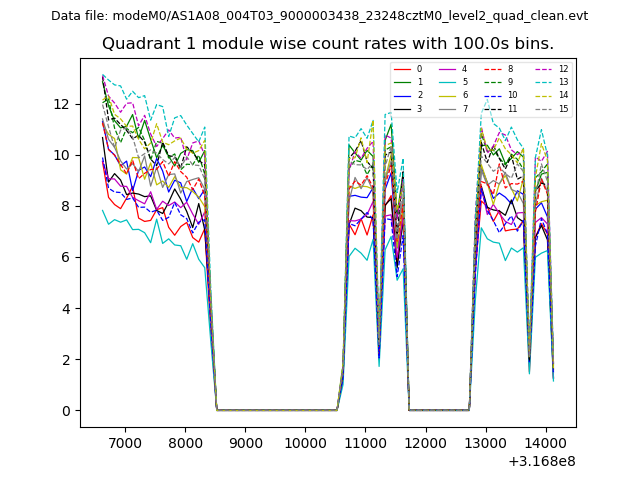
| Module-wise count rates for Quadrant A Data is divided into 100 sec bins |
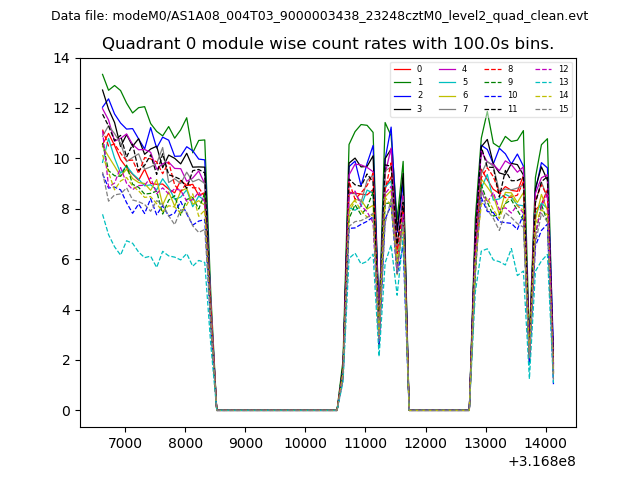 |
 |
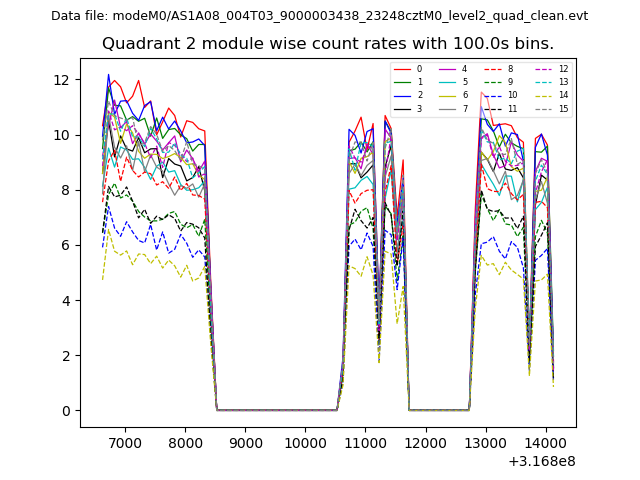
| Module-wise count rates for Quadrant B Data is divided into 100 sec bins |
 |
 |
| Module-wise count rates for Quadrant C Data is divided into 100 sec bins |
 |
 |
| Module-wise count rates for Quadrant D Data is divided into 100 sec bins |
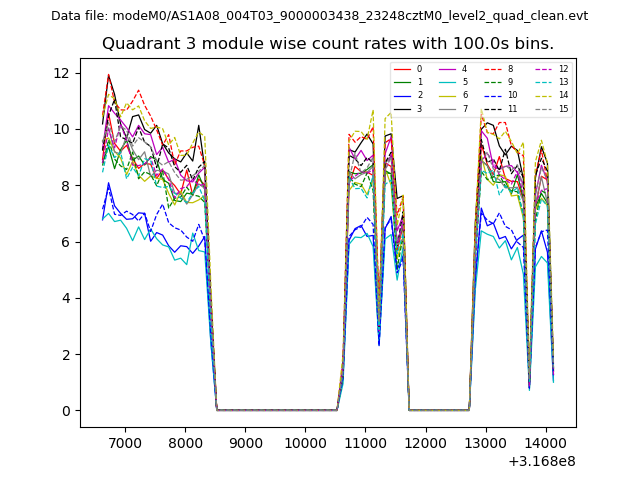 |
 |
| Parameter | Plot |
|---|---|
| CZT HV Monitor | 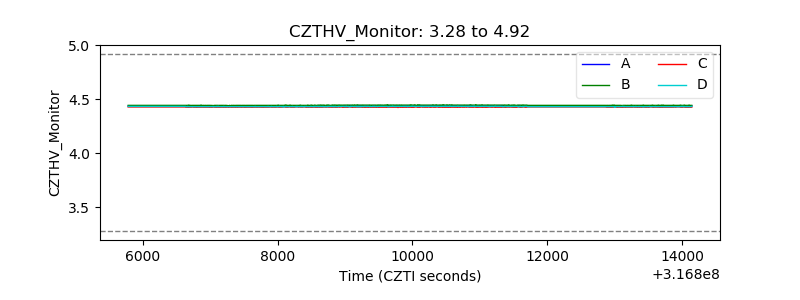 |
| D_VDD | 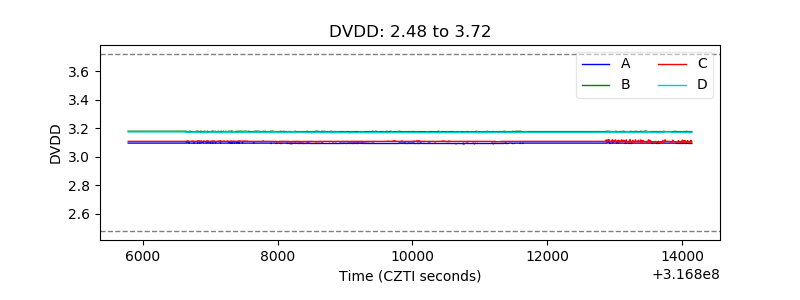 |
| Temperature 1 | 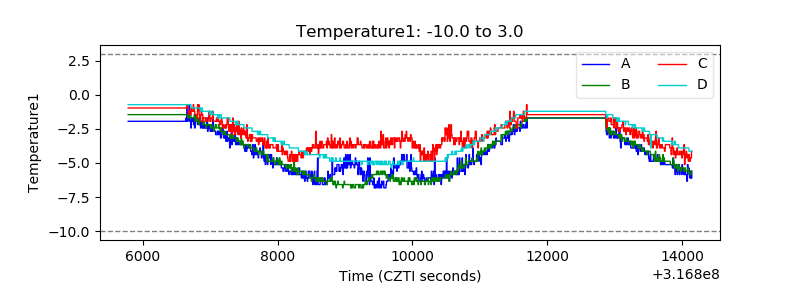 |
| Veto HV Monitor | 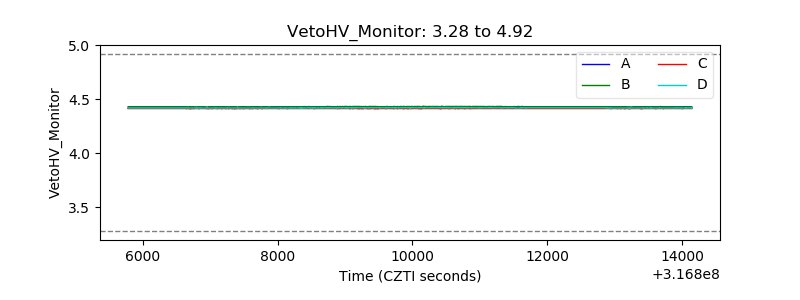 |
| Veto LLD | 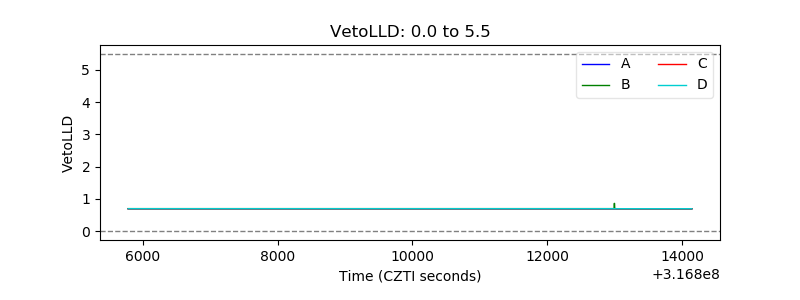 |
| Alpha Counter | 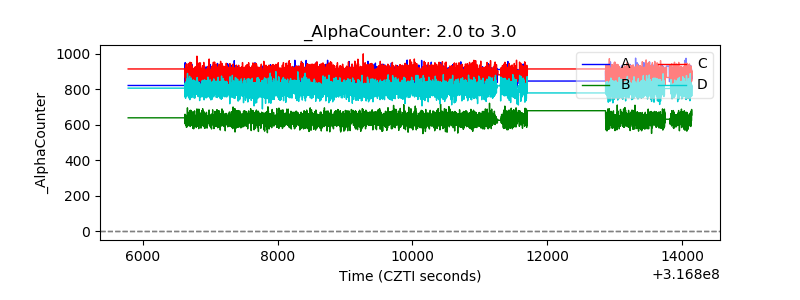 |
| _CPM_Rate | 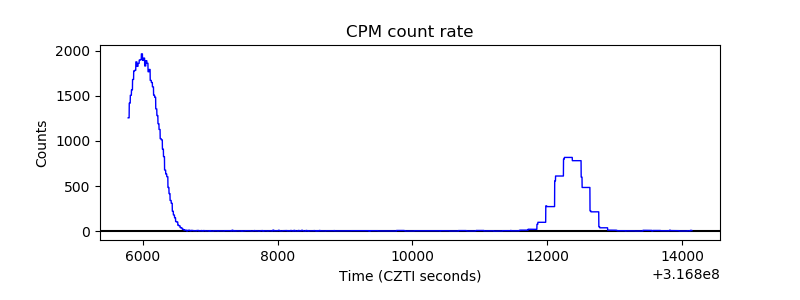 |
| CZT Counter | 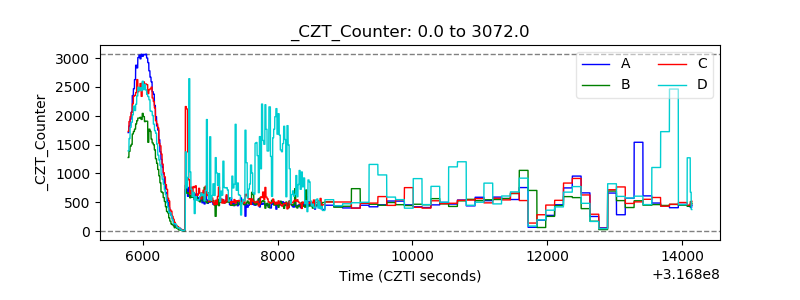 |
| +2.5 Volts monitor |  |
| +5 Volts monitor |  |
| _ROLL_ROT | 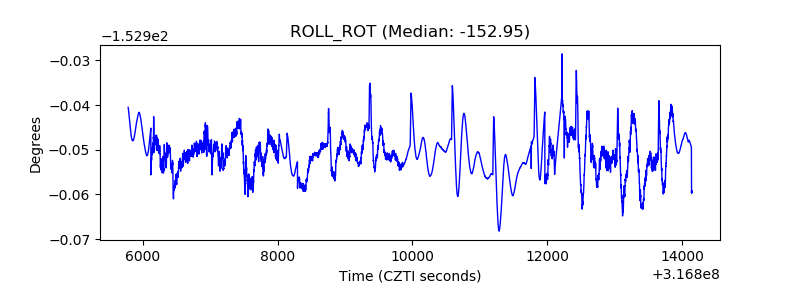 |
| _Roll_DEC | 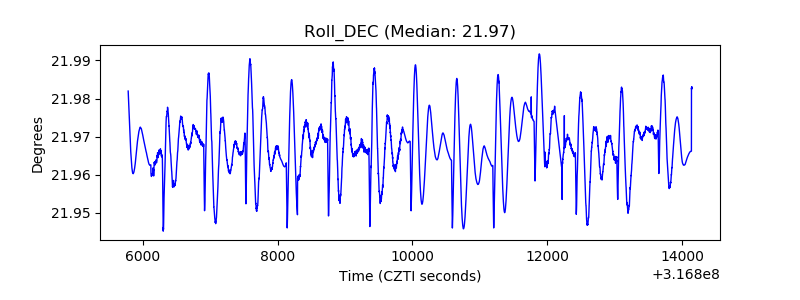 |
| _Roll_RA | 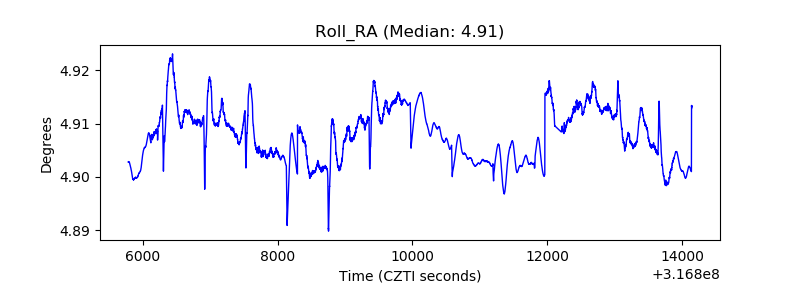 |
| Veto Counter | 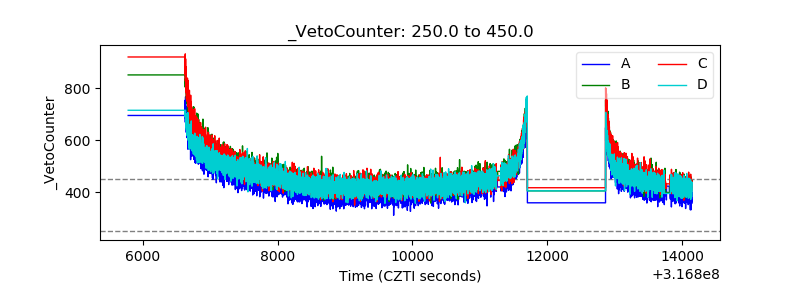 |