| Param | Original file | Final file |
|---|---|---|
| Filename | modeM0/AS1A08_004T03_9000003438_23249cztM0_level2.evt | modeM0/AS1A08_004T03_9000003438_23249cztM0_level2_quad_clean.evt |
| Size (bytes) | 521,602,560 | 89,478,720 |
| Size | 497.4 MB | 85.3 MB |
| Events in quadrant A | 3,199,044 | 575,084 |
| Events in quadrant B | 3,263,649 | 584,197 |
| Events in quadrant C | 3,362,080 | 554,755 |
| Events in quadrant D | 5,516,174 | 527,040 |
| Mode M9 | |||
|---|---|---|---|
| Quadrant | BADHDUFLAG | Total packets | Discarded packets |
| A | 0 | 20 | 0 |
| B | 0 | 20 | 0 |
| C | 0 | 20 | 0 |
| D | 0 | 20 | 0 |
| Mode M0 | |||
|---|---|---|---|
| Quadrant | BADHDUFLAG | Total packets | Discarded packets |
| A | 0 | 13824 | 2 |
| B | 0 | 13896 | 2 |
| C | 0 | 13973 | 2 |
| D | 0 | 21092 | 2 |
| Mode SS | |||
|---|---|---|---|
| Quadrant | BADHDUFLAG | Total packets | Discarded packets |
| A | 0 | 140 | 0 |
| B | 0 | 140 | 0 |
| C | 0 | 140 | 0 |
| D | 0 | 140 | 0 |
| Quadrant | Total seconds | Saturated seconds | Saturation percentage |
|---|---|---|---|
| A | 6716 | 35 | 0.521144% |
| B | 6715 | 55 | 0.819062% |
| C | 6715 | 99 | 1.474311% |
| D | 6716 | 400 | 5.955926% |
Noise dominated data is calculated using 1-second bins in cleaned event files. If a bin has >2000 counts, and if more than 50% of those come from <1% of pixels, then it is considered to be noise-dominated and hence unusable.
| Quadrant | # 1 sec bins | Bins with >0 counts | Bins with >2000 counts | High rate bins dominated by noise | Noise dominated (total time) | Noise dominated (detector-on time) | Marked lightcurve |
|---|---|---|---|---|---|---|---|
| A | 8766 | 6718 | 0 | 0 | 0.00% | 0.00% | 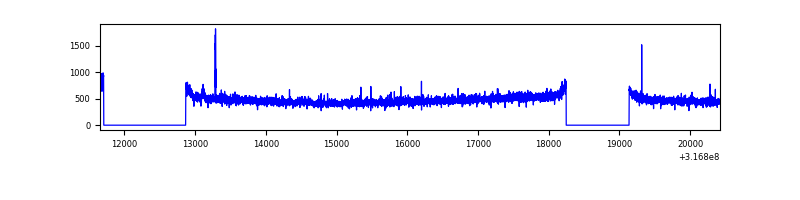 |
| B | 8765 | 6717 | 1 | 1 | 0.01% | 0.01% | 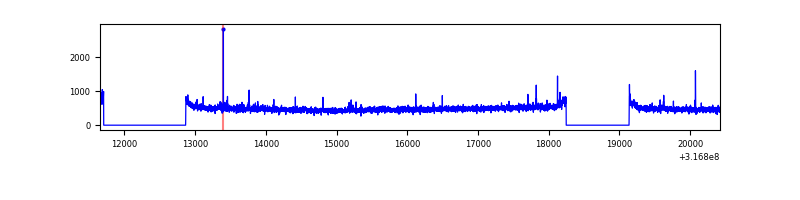 |
| C | 8765 | 6717 | 0 | 0 | 0.00% | 0.00% | 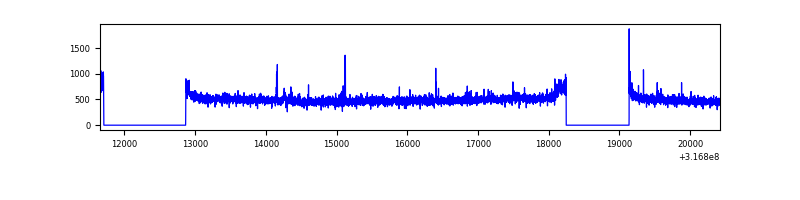 |
| D | 8766 | 6718 | 335 | 335 | 3.82% | 4.99% | 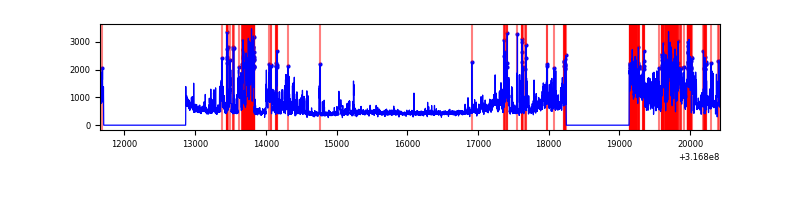 |
Top three noisy pixels from each quadrant. If the there are fewer than three noisy pixels in the level2.evt file, extra rows are filled as -1
| Pixel properties | Quadrant properties | ||||||
|---|---|---|---|---|---|---|---|
| Quadrant | DetID | PixID | Counts | Sigma | Mean | Median | Sigma |
| A | 6 | 16 | 20430 | 117.64 | 823 | 806 | 166.8 |
| A | 13 | 254 | 10278 | 56.78 | 823 | 806 | 166.8 |
| A | 3 | 137 | 7121 | 37.86 | 823 | 806 | 166.8 |
| B | 12 | 111 | 18899 | 115.31 | 824 | 803 | 156.9 |
| B | 11 | 111 | 17009 | 103.27 | 824 | 803 | 156.9 |
| B | 14 | 111 | 14187 | 85.28 | 824 | 803 | 156.9 |
| C | 14 | 238 | 125322 | 663.07 | 796 | 802 | 187.8 |
| C | 0 | 239 | 56711 | 297.72 | 796 | 802 | 187.8 |
| C | 7 | 247 | 21959 | 112.66 | 796 | 802 | 187.8 |
| D | 1 | 52 | 2093370 | 10747.17 | 795 | 772 | 194.7 |
| D | 12 | 233 | 173252 | 885.82 | 795 | 772 | 194.7 |
| D | 2 | 152 | 121290 | 618.96 | 795 | 772 | 194.7 |
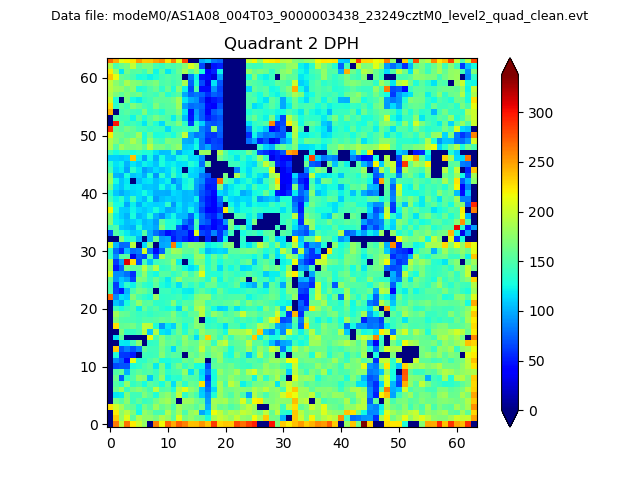
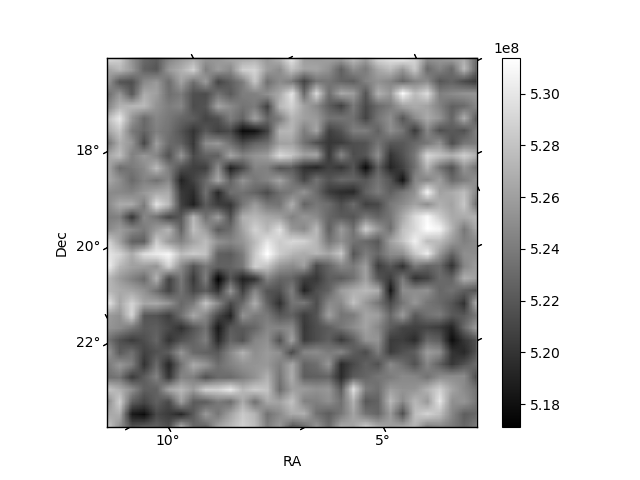
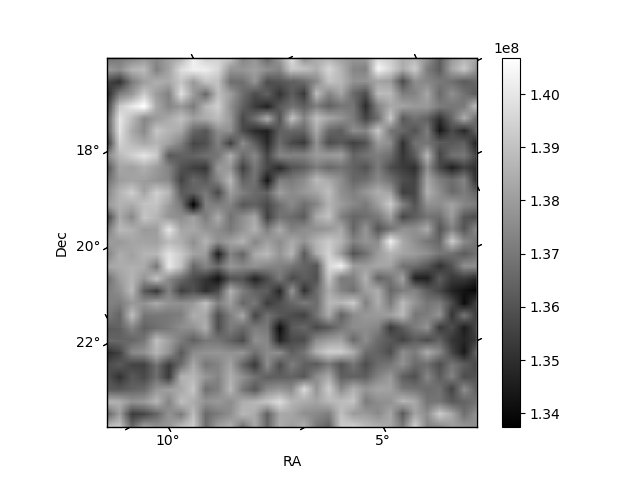
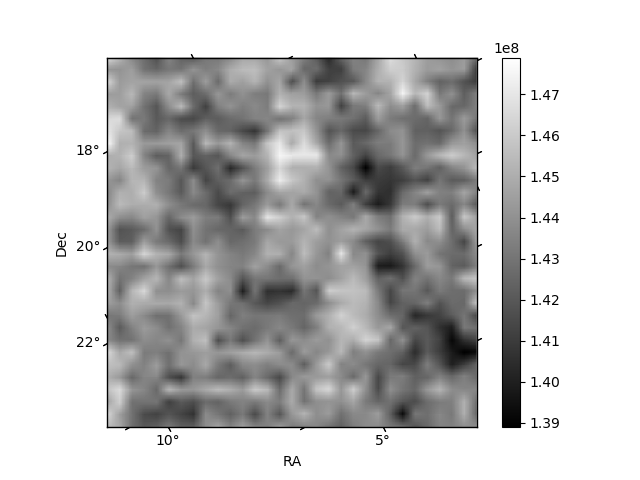
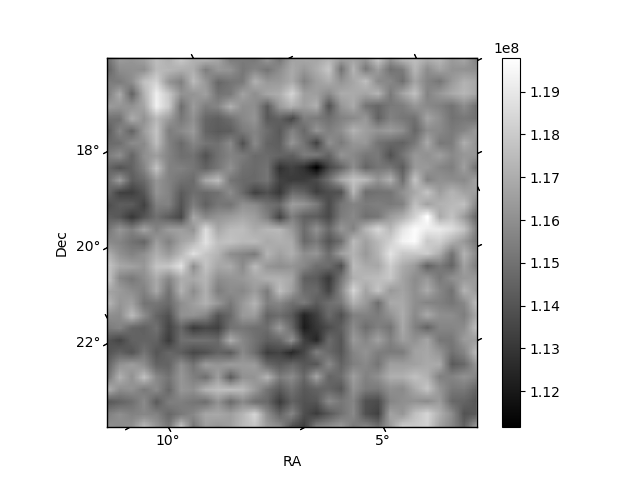
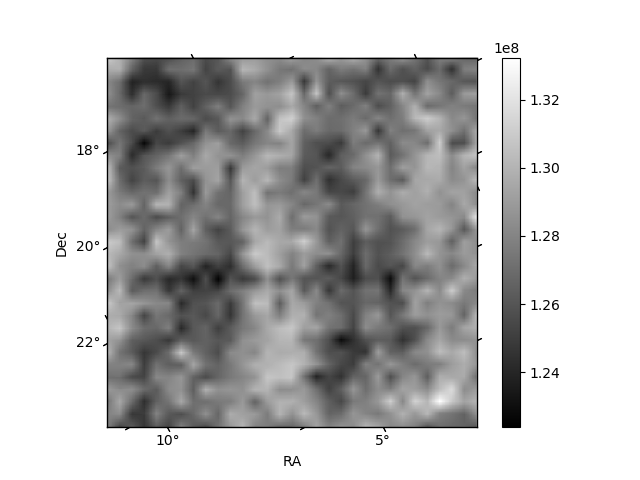
Histogram calculated using DETX and DETY for each event in the final _common_clean file
| Quadrant A | 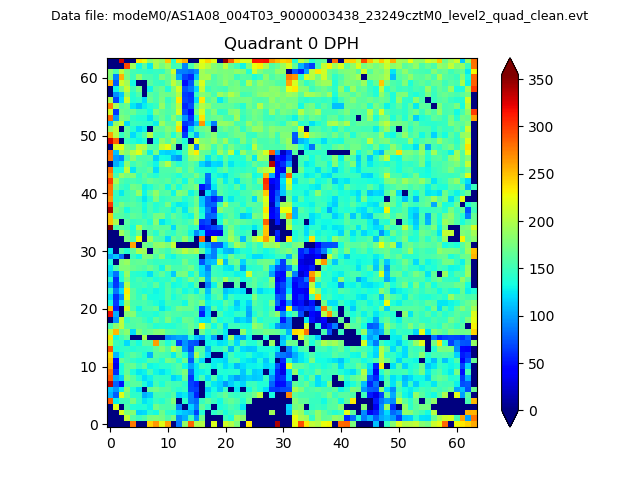 |
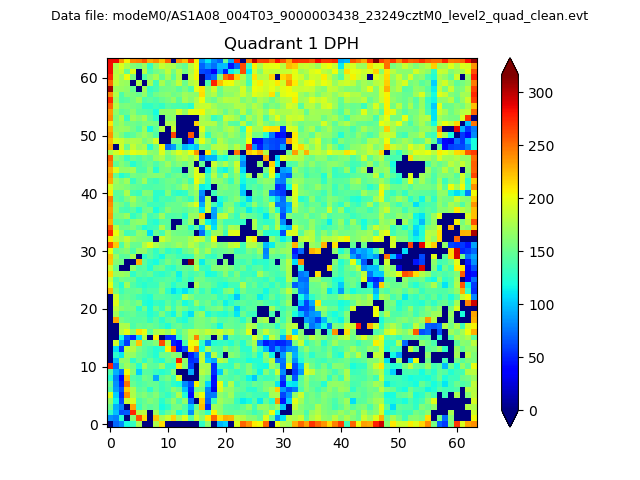 |
Quadrant B |
|---|---|---|---|
| Quadrant D | 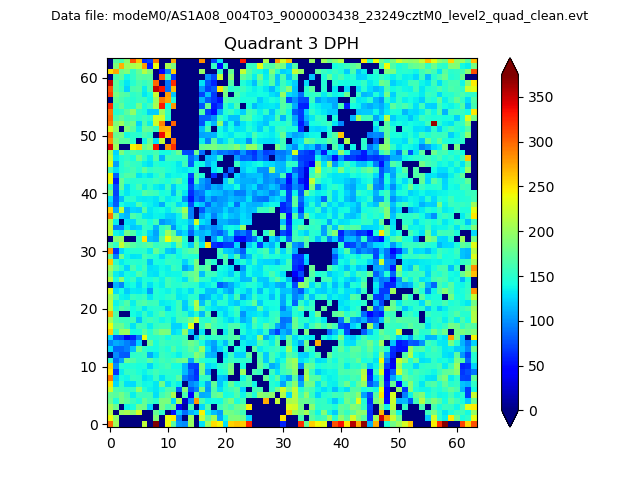 |
 |
Quadrant C |
| Plot type | Count rate plots | Images |
|---|---|---|
| Comparison with Poisson distribution Blue bars denote a histogram of data divided into 1 sec bins. Red curve is a Poisson curve with rate = median count rate of data. |
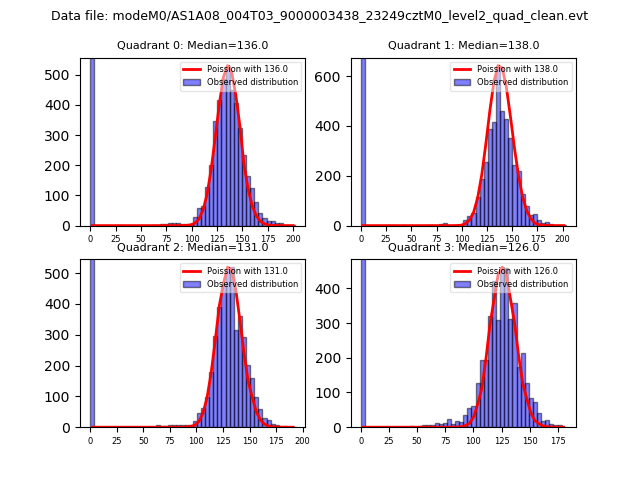 |
 |
| Quadrant-wise count rates Data is divided into 100 sec bins |
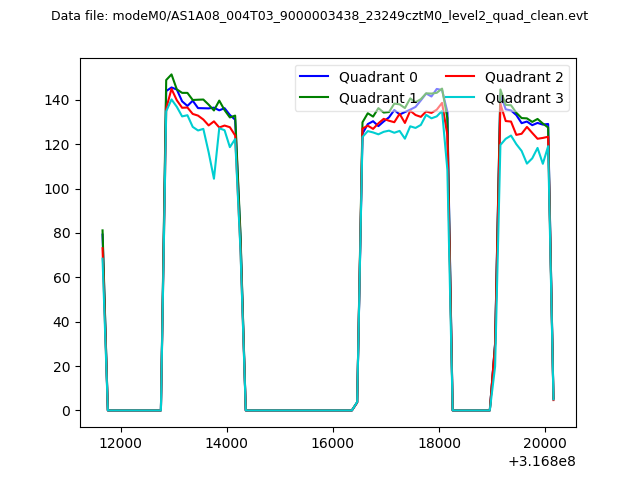 |
|
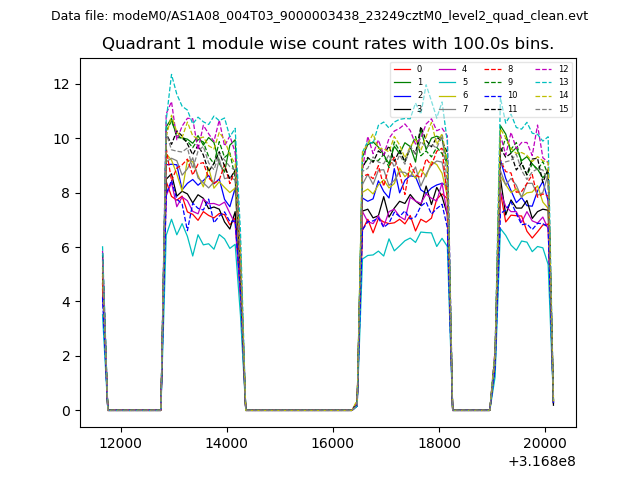
| Module-wise count rates for Quadrant A Data is divided into 100 sec bins |
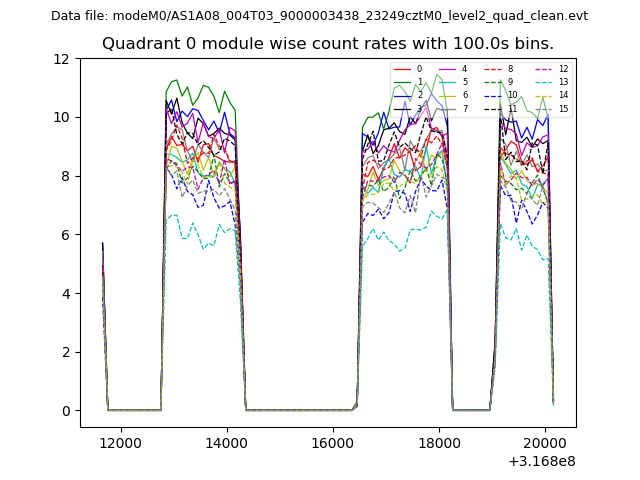 |
 |
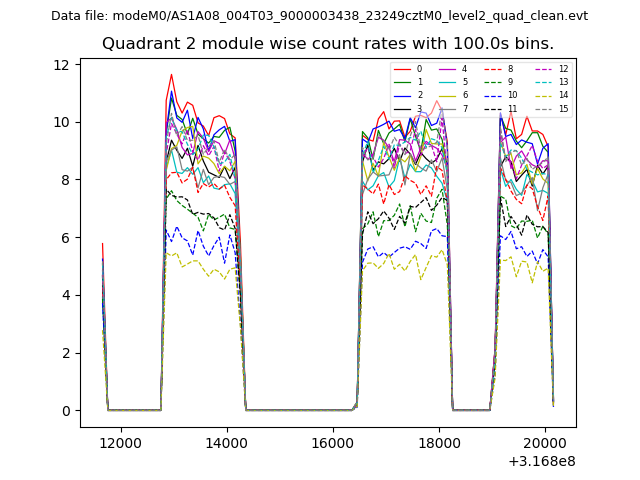
| Module-wise count rates for Quadrant B Data is divided into 100 sec bins |
 |
 |
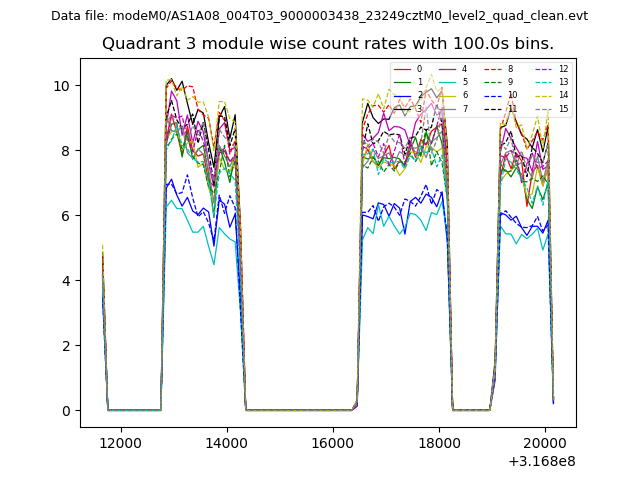
| Module-wise count rates for Quadrant C Data is divided into 100 sec bins |
 |
 |
| Module-wise count rates for Quadrant D Data is divided into 100 sec bins |
 |
 |
| Parameter | Plot |
|---|---|
| CZT HV Monitor | 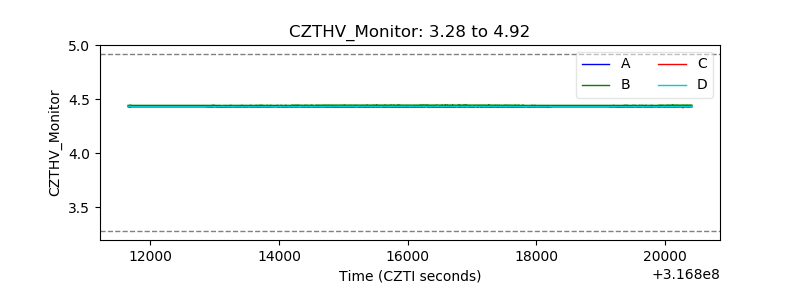 |
| D_VDD | 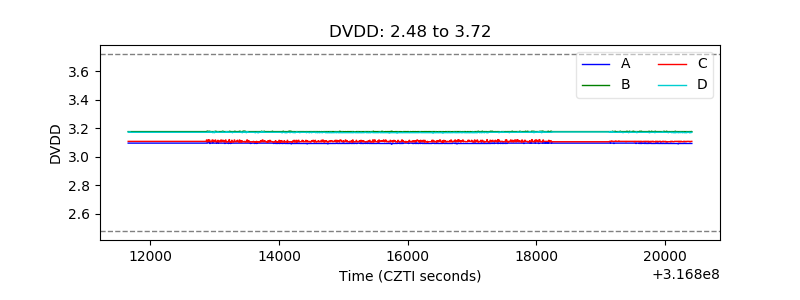 |
| Temperature 1 | 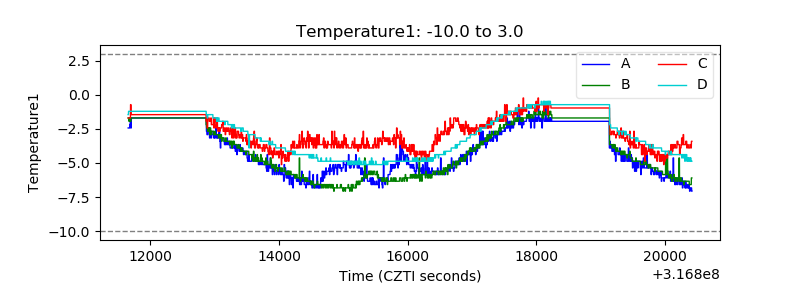 |
| Veto HV Monitor | 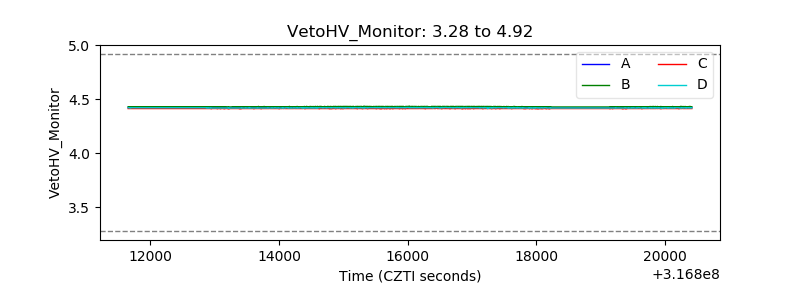 |
| Veto LLD | 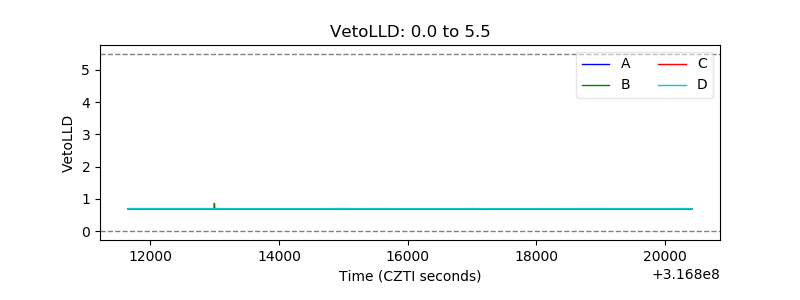 |
| Alpha Counter | 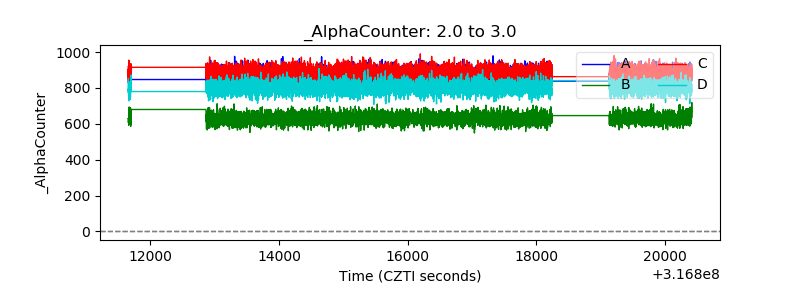 |
| _CPM_Rate | 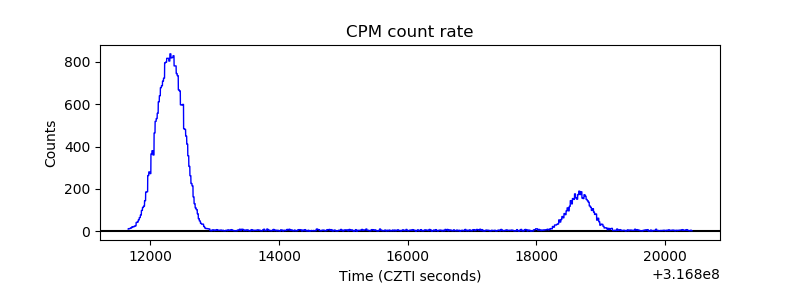 |
| CZT Counter | 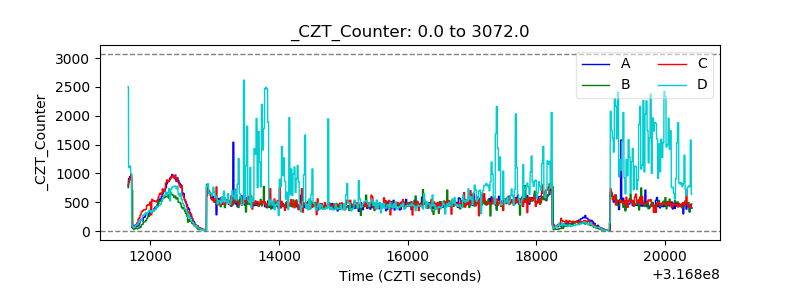 |
| +2.5 Volts monitor |  |
| +5 Volts monitor |  |
| _ROLL_ROT | 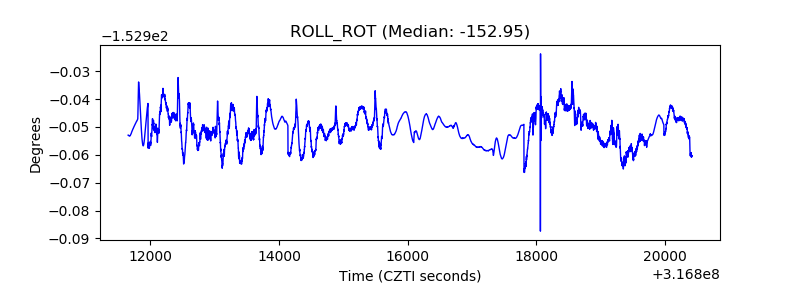 |
| _Roll_DEC | 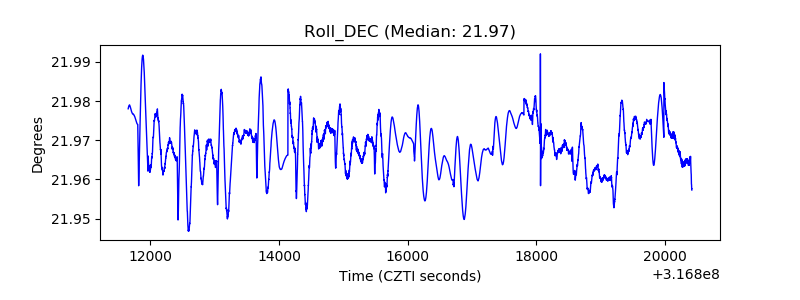 |
| _Roll_RA | 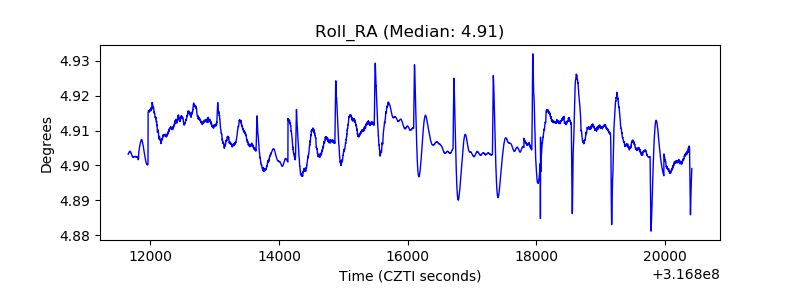 |
| Veto Counter | 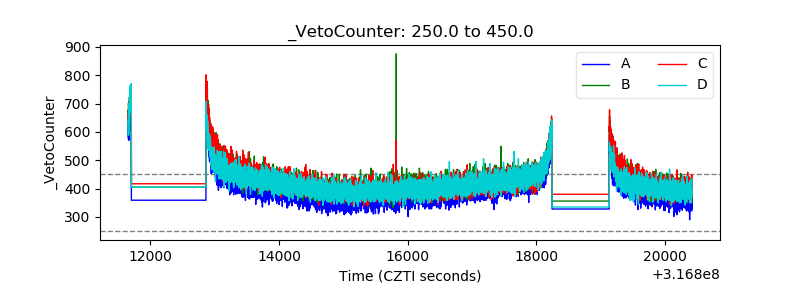 |