| Param | Original file | Final file |
|---|---|---|
| Filename | modeM0/AS1A08_004T03_9000003438_23250cztM0_level2.evt | modeM0/AS1A08_004T03_9000003438_23250cztM0_level2_quad_clean.evt |
| Size (bytes) | 545,941,440 | 87,298,560 |
| Size | 520.7 MB | 83.3 MB |
| Events in quadrant A | 3,406,821 | 544,700 |
| Events in quadrant B | 3,506,671 | 553,370 |
| Events in quadrant C | 3,518,942 | 527,957 |
| Events in quadrant D | 5,606,148 | 509,134 |
| Mode M9 | |||
|---|---|---|---|
| Quadrant | BADHDUFLAG | Total packets | Discarded packets |
| A | 0 | 7 | 0 |
| B | 0 | 8 | 0 |
| C | 0 | 8 | 0 |
| D | 0 | 8 | 0 |
| Mode M0 | |||
|---|---|---|---|
| Quadrant | BADHDUFLAG | Total packets | Discarded packets |
| A | 0 | 14911 | 2 |
| B | 0 | 15063 | 2 |
| C | 0 | 15051 | 2 |
| D | 0 | 21650 | 2 |
| Mode SS | |||
|---|---|---|---|
| Quadrant | BADHDUFLAG | Total packets | Discarded packets |
| A | 0 | 148 | 0 |
| B | 0 | 148 | 0 |
| C | 0 | 148 | 0 |
| D | 0 | 148 | 0 |
| Quadrant | Total seconds | Saturated seconds | Saturation percentage |
|---|---|---|---|
| A | 7303 | 13 | 0.178009% |
| B | 7303 | 29 | 0.397097% |
| C | 7303 | 55 | 0.753115% |
| D | 7302 | 225 | 3.081348% |
Noise dominated data is calculated using 1-second bins in cleaned event files. If a bin has >2000 counts, and if more than 50% of those come from <1% of pixels, then it is considered to be noise-dominated and hence unusable.
| Quadrant | # 1 sec bins | Bins with >0 counts | Bins with >2000 counts | High rate bins dominated by noise | Noise dominated (total time) | Noise dominated (detector-on time) | Marked lightcurve |
|---|---|---|---|---|---|---|---|
| A | 7813 | 7304 | 0 | 0 | 0.00% | 0.00% | 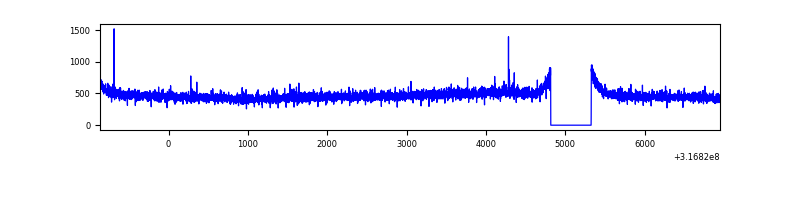 |
| B | 7813 | 7304 | 2 | 2 | 0.03% | 0.03% | 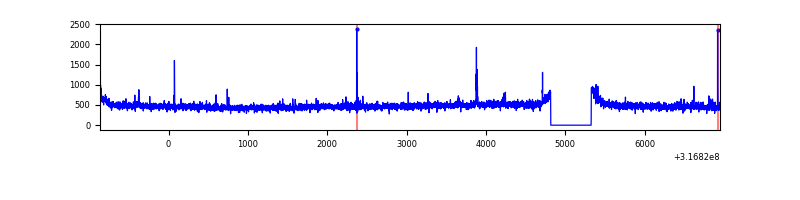 |
| C | 7813 | 7304 | 2 | 2 | 0.03% | 0.03% | 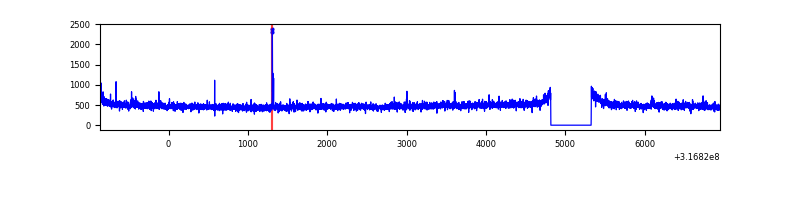 |
| D | 7812 | 7303 | 248 | 248 | 3.17% | 3.40% |  |
Top three noisy pixels from each quadrant. If the there are fewer than three noisy pixels in the level2.evt file, extra rows are filled as -1
| Pixel properties | Quadrant properties | ||||||
|---|---|---|---|---|---|---|---|
| Quadrant | DetID | PixID | Counts | Sigma | Mean | Median | Sigma |
| A | 13 | 254 | 11314 | 58.7 | 880 | 861 | 178.1 |
| A | 8 | 255 | 8652 | 43.75 | 880 | 861 | 178.1 |
| A | 3 | 137 | 7814 | 39.05 | 880 | 861 | 178.1 |
| B | 12 | 111 | 20628 | 115.24 | 881 | 859 | 171.6 |
| B | 4 | 173 | 19920 | 111.11 | 881 | 859 | 171.6 |
| B | 0 | 190 | 19897 | 110.98 | 881 | 859 | 171.6 |
| C | 14 | 238 | 132739 | 655.99 | 849 | 855 | 201.0 |
| C | 0 | 239 | 24289 | 116.56 | 849 | 855 | 201.0 |
| C | 8 | 208 | 19450 | 92.49 | 849 | 855 | 201.0 |
| D | 1 | 52 | 2191556 | 10505.21 | 854 | 831 | 208.5 |
| D | 2 | 152 | 79372 | 376.63 | 854 | 831 | 208.5 |
| D | 1 | 239 | 44167 | 207.81 | 854 | 831 | 208.5 |
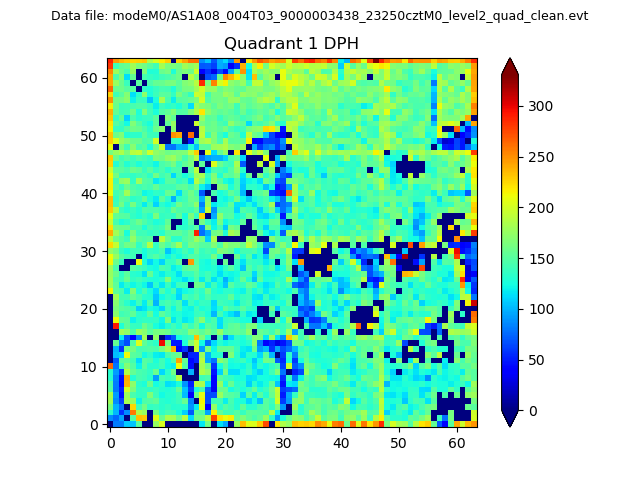
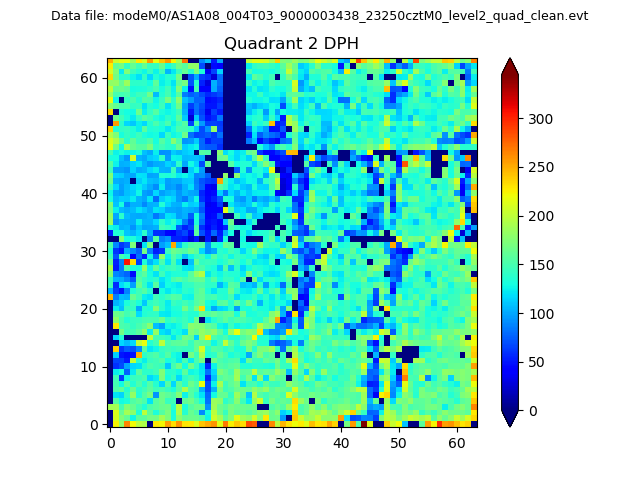
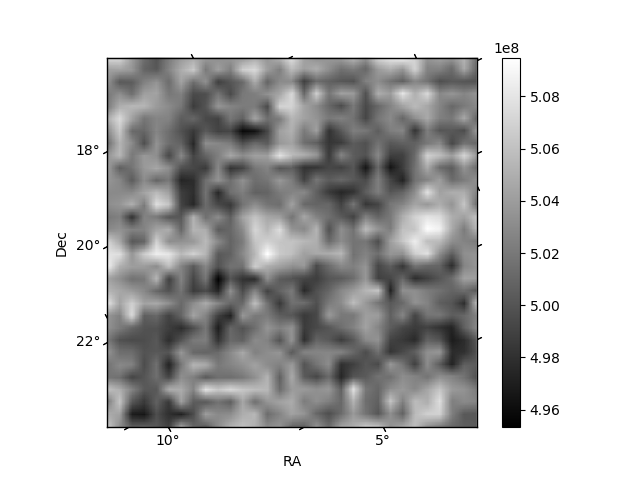
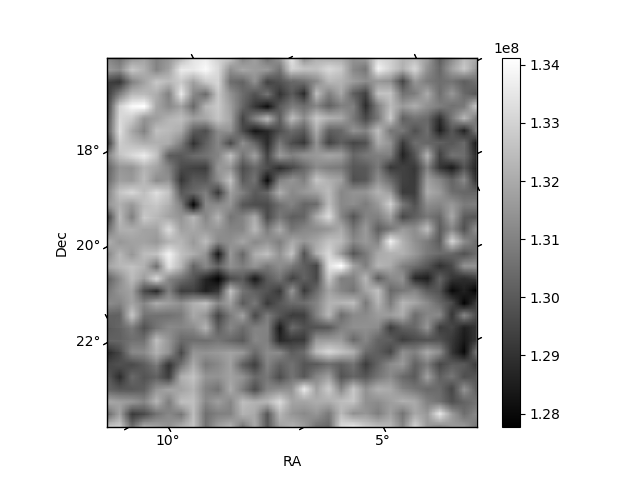
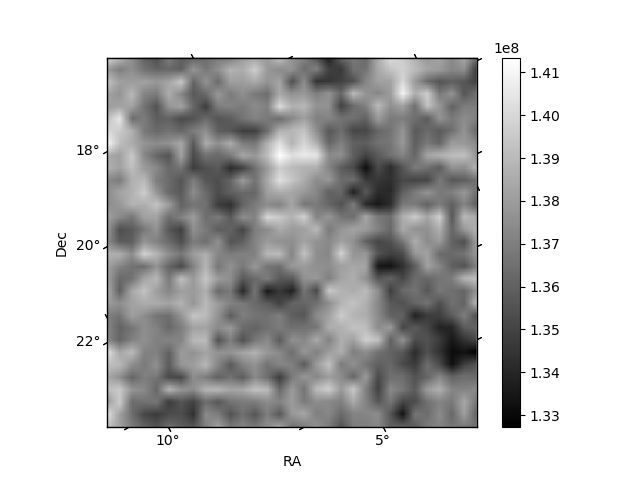
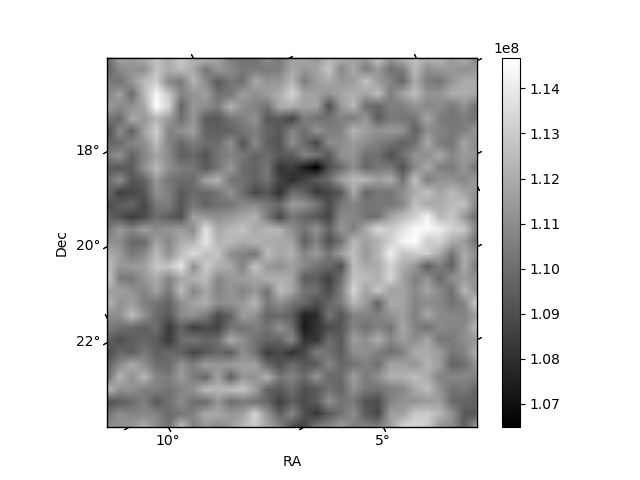
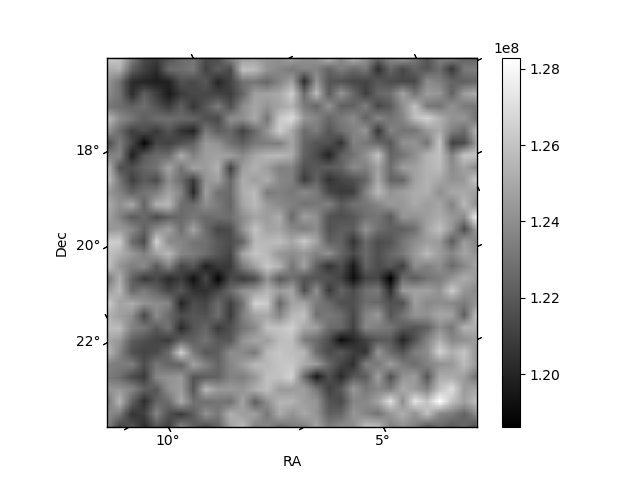
Histogram calculated using DETX and DETY for each event in the final _common_clean file
| Quadrant A | 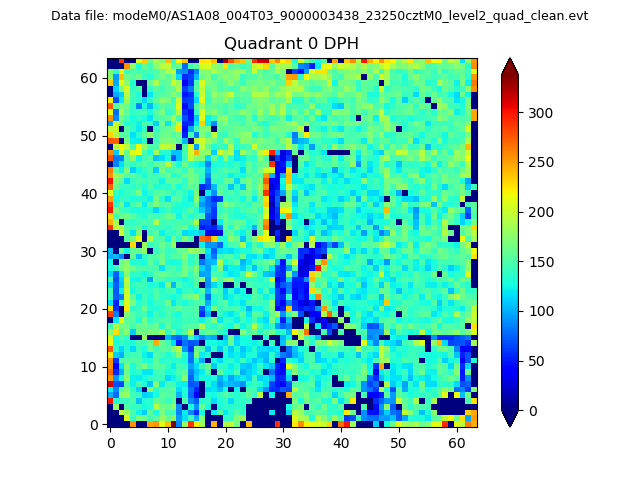 |
 |
Quadrant B |
|---|---|---|---|
| Quadrant D | 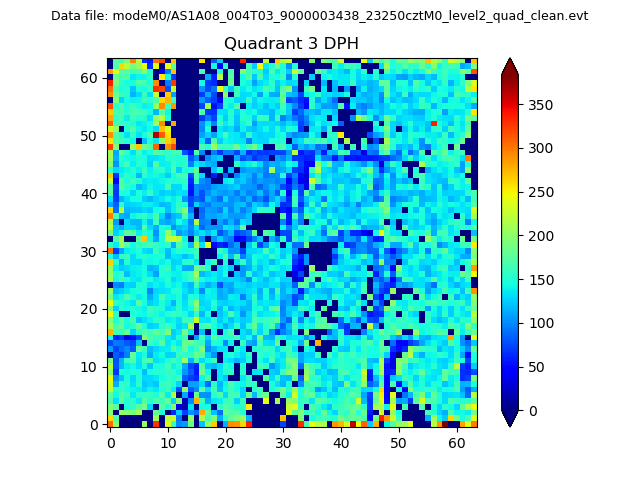 |
 |
Quadrant C |
| Plot type | Count rate plots | Images |
|---|---|---|
| Comparison with Poisson distribution Blue bars denote a histogram of data divided into 1 sec bins. Red curve is a Poisson curve with rate = median count rate of data. |
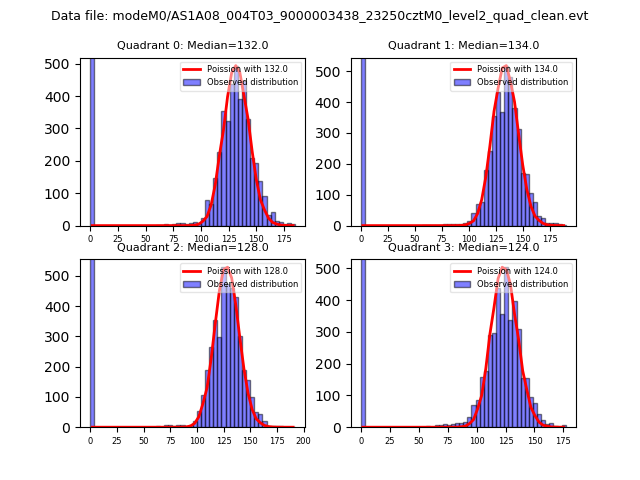 |
 |
| Quadrant-wise count rates Data is divided into 100 sec bins |
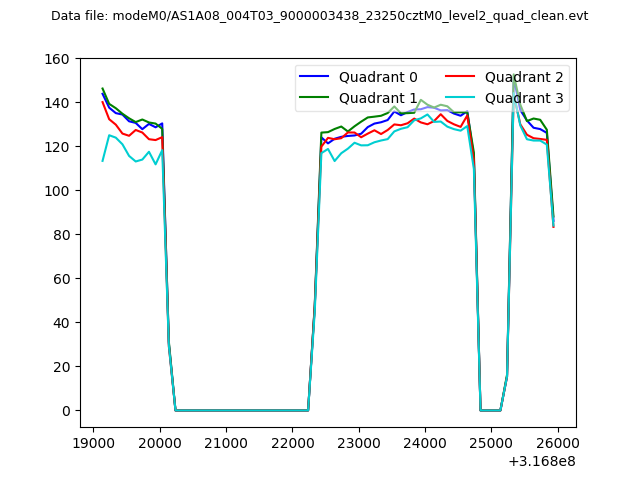 |
|
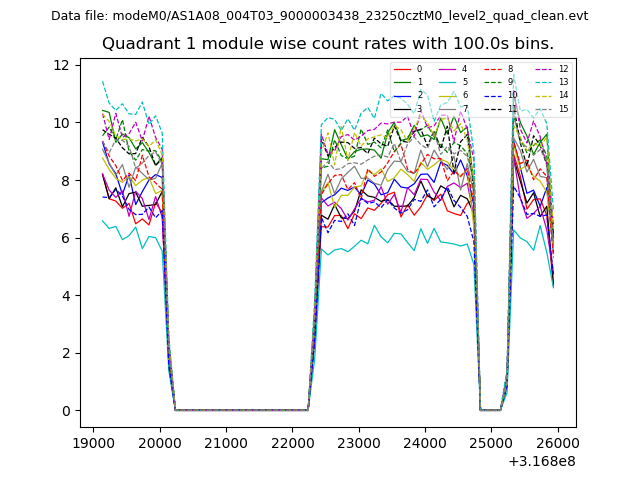
| Module-wise count rates for Quadrant A Data is divided into 100 sec bins |
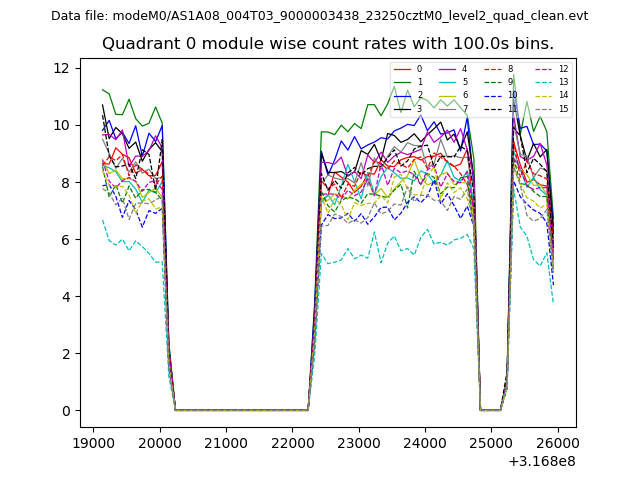 |
 |
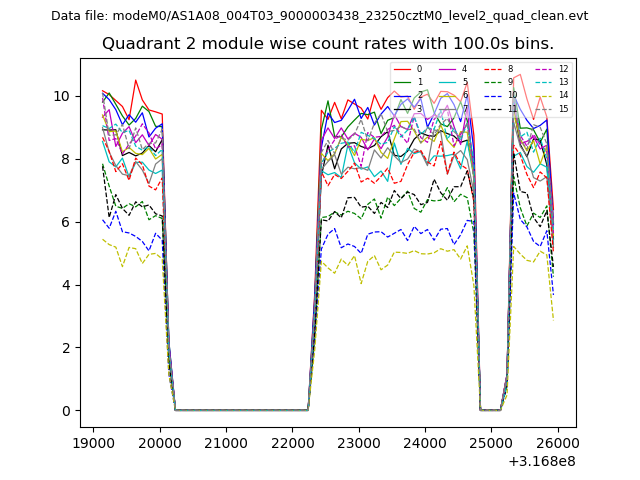
| Module-wise count rates for Quadrant B Data is divided into 100 sec bins |
 |
 |
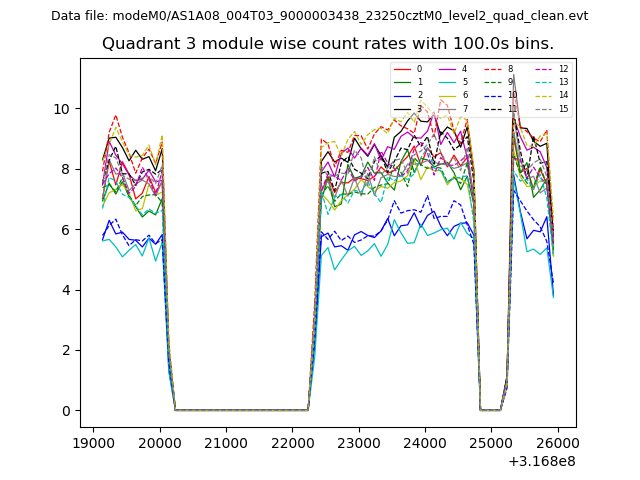
| Module-wise count rates for Quadrant C Data is divided into 100 sec bins |
 |
 |
| Module-wise count rates for Quadrant D Data is divided into 100 sec bins |
 |
 |
| Parameter | Plot |
|---|---|
| CZT HV Monitor | 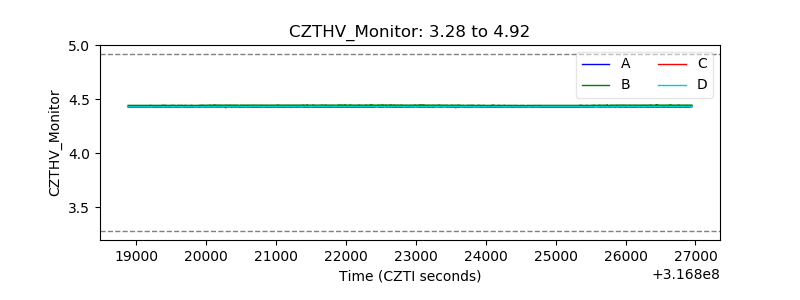 |
| D_VDD | 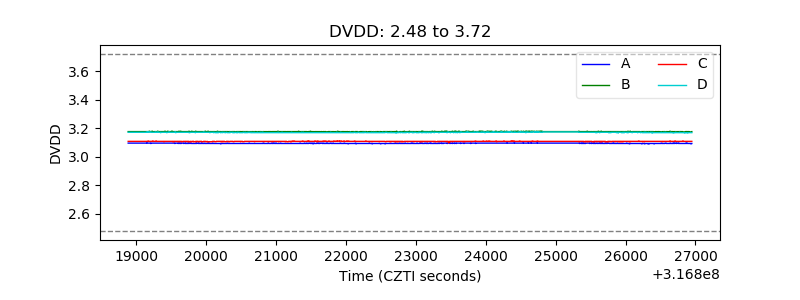 |
| Temperature 1 | 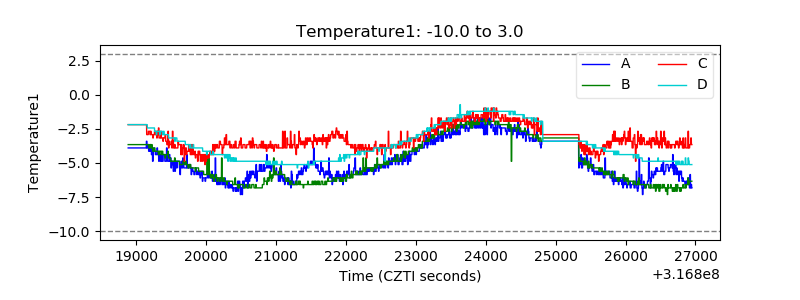 |
| Veto HV Monitor | 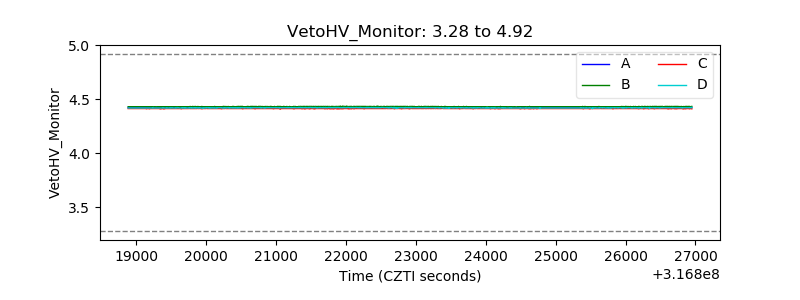 |
| Veto LLD | 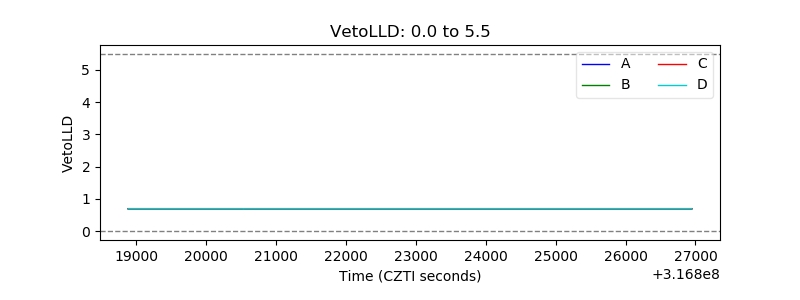 |
| Alpha Counter | 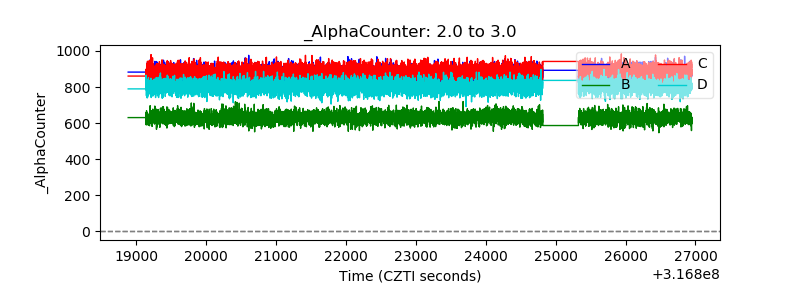 |
| _CPM_Rate | 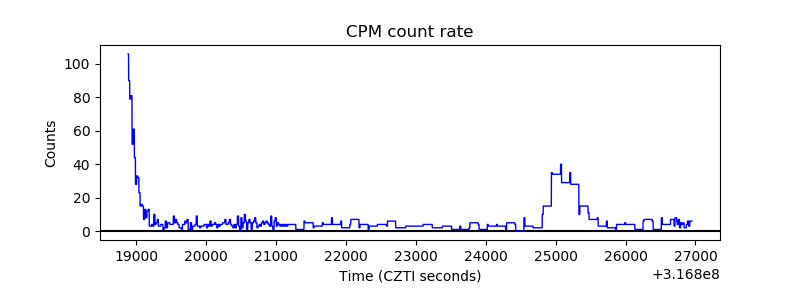 |
| CZT Counter | 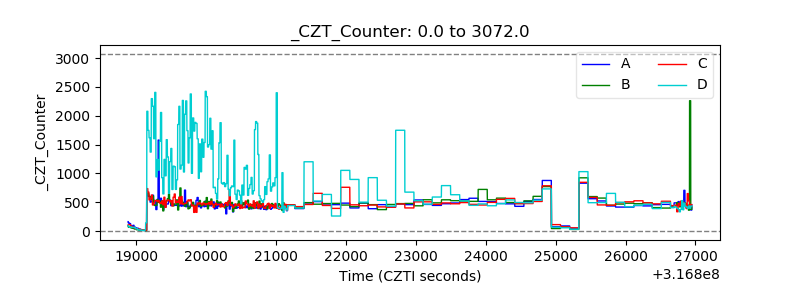 |
| +2.5 Volts monitor | 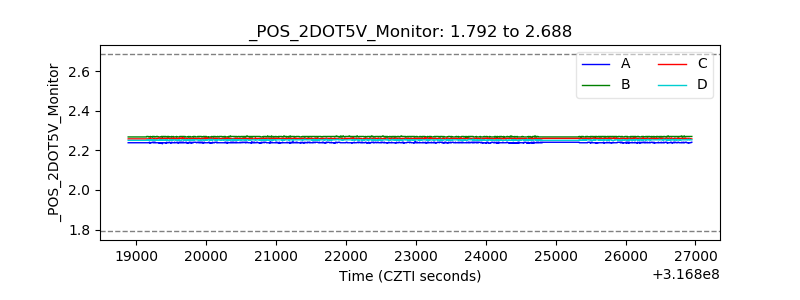 |
| +5 Volts monitor | 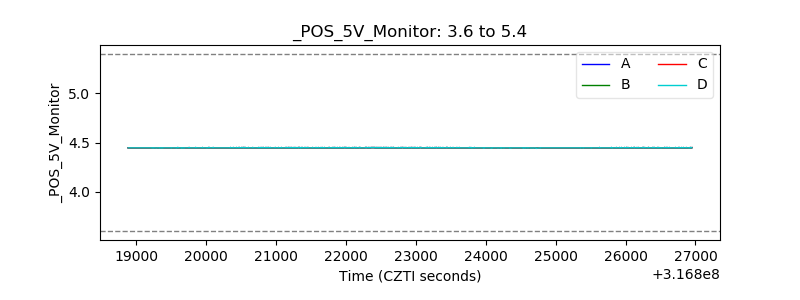 |
| _ROLL_ROT |  |
| _Roll_DEC | 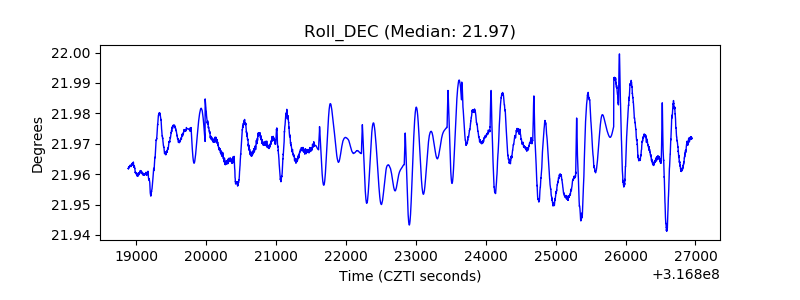 |
| _Roll_RA | 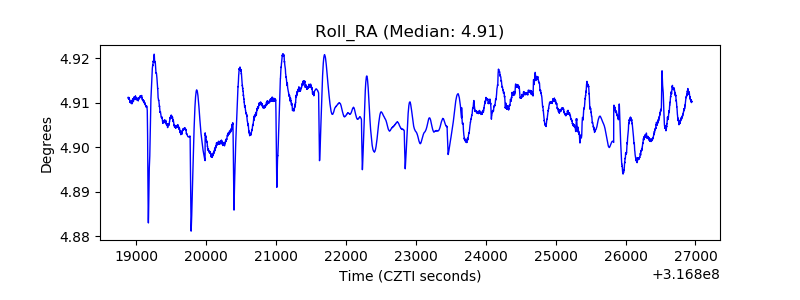 |
| Veto Counter | 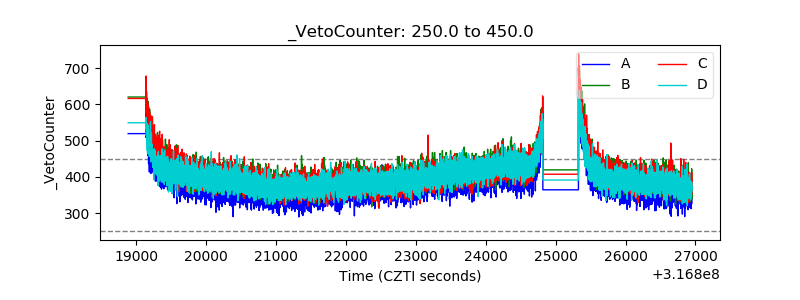 |