| Param | Original file | Final file |
|---|---|---|
| Filename | modeM0/AS1A08_004T03_9000003438_23251cztM0_level2.evt | modeM0/AS1A08_004T03_9000003438_23251cztM0_level2_quad_clean.evt |
| Size (bytes) | 545,385,600 | 87,566,400 |
| Size | 520.1 MB | 83.5 MB |
| Events in quadrant A | 3,618,041 | 540,180 |
| Events in quadrant B | 3,732,896 | 549,471 |
| Events in quadrant C | 3,758,025 | 524,021 |
| Events in quadrant D | 4,887,850 | 504,570 |
| Mode M9 | |||
|---|---|---|---|
| Quadrant | BADHDUFLAG | Total packets | Discarded packets |
| A | 0 | 9 | 0 |
| B | 0 | 9 | 0 |
| C | 0 | 9 | 0 |
| D | 0 | 9 | 0 |
| Mode M0 | |||
|---|---|---|---|
| Quadrant | BADHDUFLAG | Total packets | Discarded packets |
| A | 0 | 15784 | 2 |
| B | 0 | 15946 | 2 |
| C | 0 | 16008 | 2 |
| D | 0 | 19809 | 2 |
| Mode SS | |||
|---|---|---|---|
| Quadrant | BADHDUFLAG | Total packets | Discarded packets |
| A | 0 | 156 | 0 |
| B | 0 | 156 | 0 |
| C | 0 | 156 | 0 |
| D | 0 | 156 | 0 |
| Quadrant | Total seconds | Saturated seconds | Saturation percentage |
|---|---|---|---|
| A | 7672 | 36 | 0.469239% |
| B | 7672 | 65 | 0.847237% |
| C | 7672 | 88 | 1.147028% |
| D | 7672 | 340 | 4.431700% |
Noise dominated data is calculated using 1-second bins in cleaned event files. If a bin has >2000 counts, and if more than 50% of those come from <1% of pixels, then it is considered to be noise-dominated and hence unusable.
| Quadrant | # 1 sec bins | Bins with >0 counts | Bins with >2000 counts | High rate bins dominated by noise | Noise dominated (total time) | Noise dominated (detector-on time) | Marked lightcurve |
|---|---|---|---|---|---|---|---|
| A | 8562 | 7674 | 0 | 0 | 0.00% | 0.00% | 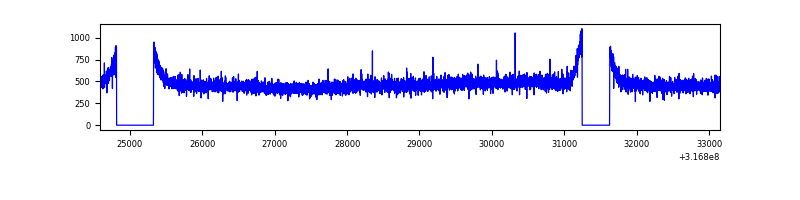 |
| B | 8562 | 7674 | 2 | 2 | 0.02% | 0.03% | 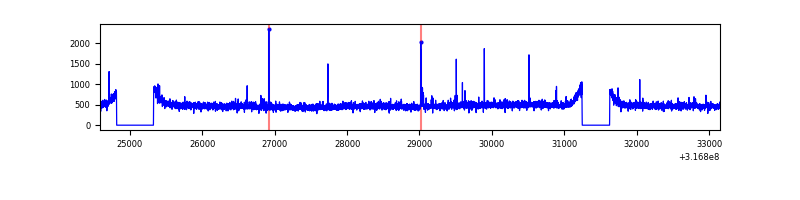 |
| C | 8562 | 7674 | 3 | 3 | 0.04% | 0.04% | 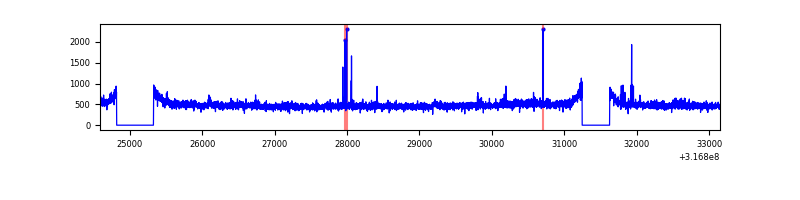 |
| D | 8562 | 7673 | 267 | 267 | 3.12% | 3.48% | 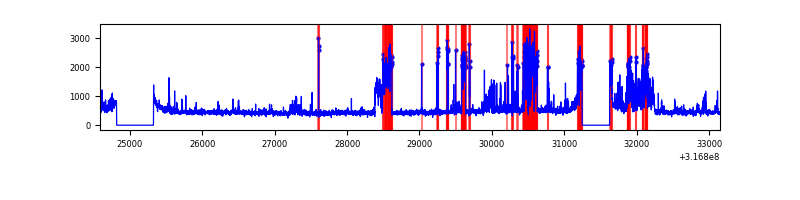 |
Top three noisy pixels from each quadrant. If the there are fewer than three noisy pixels in the level2.evt file, extra rows are filled as -1
| Pixel properties | Quadrant properties | ||||||
|---|---|---|---|---|---|---|---|
| Quadrant | DetID | PixID | Counts | Sigma | Mean | Median | Sigma |
| A | 13 | 254 | 11776 | 57.2 | 937 | 916 | 189.9 |
| A | 3 | 137 | 8377 | 39.3 | 937 | 916 | 189.9 |
| A | 0 | 226 | 8018 | 37.41 | 937 | 916 | 189.9 |
| B | 12 | 111 | 22443 | 117.89 | 936 | 910 | 182.6 |
| B | 11 | 111 | 19767 | 103.24 | 936 | 910 | 182.6 |
| B | 14 | 111 | 16970 | 87.93 | 936 | 910 | 182.6 |
| C | 14 | 238 | 141096 | 655.62 | 903 | 909 | 213.8 |
| C | 0 | 207 | 47585 | 218.29 | 903 | 909 | 213.8 |
| C | 0 | 239 | 16137 | 71.22 | 903 | 909 | 213.8 |
| D | 1 | 52 | 1319732 | 5958.13 | 903 | 877 | 221.4 |
| D | 2 | 152 | 98698 | 441.92 | 903 | 877 | 221.4 |
| D | 2 | 234 | 29851 | 130.89 | 903 | 877 | 221.4 |
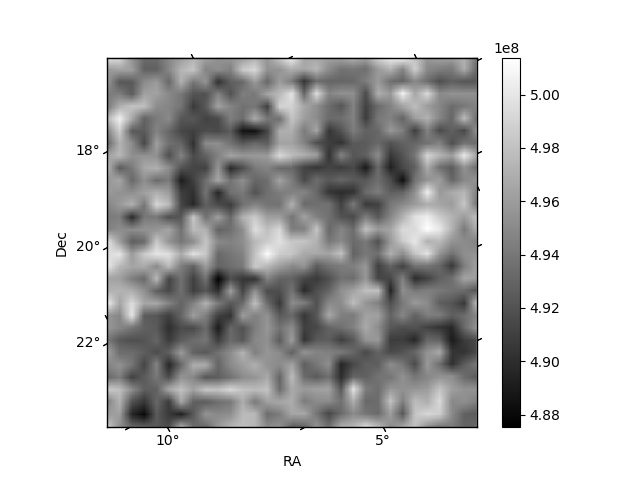
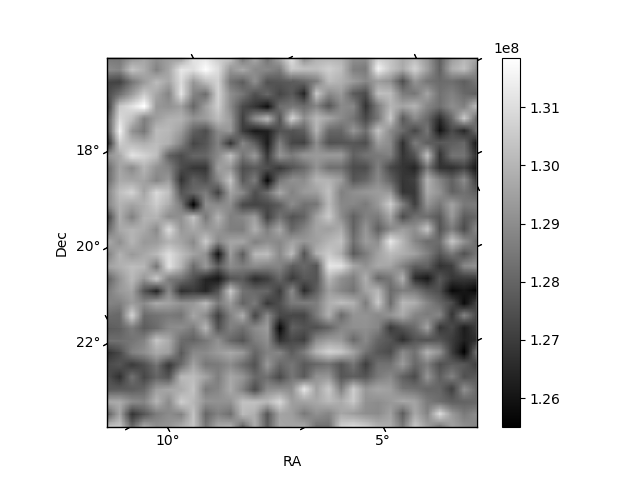
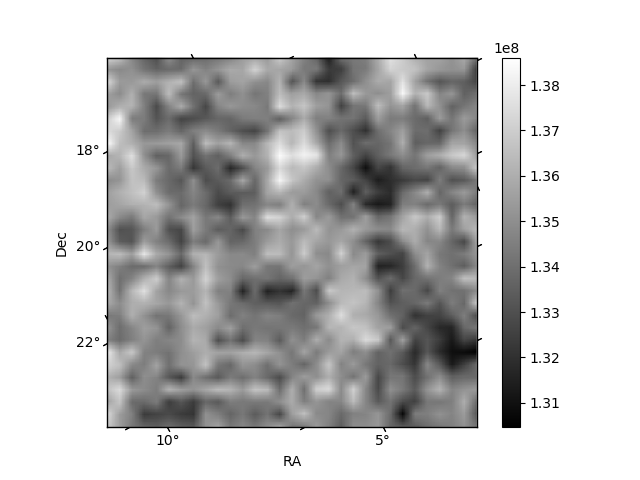
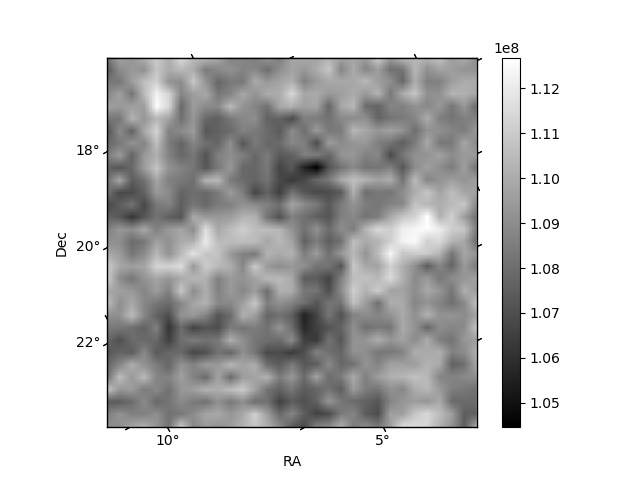
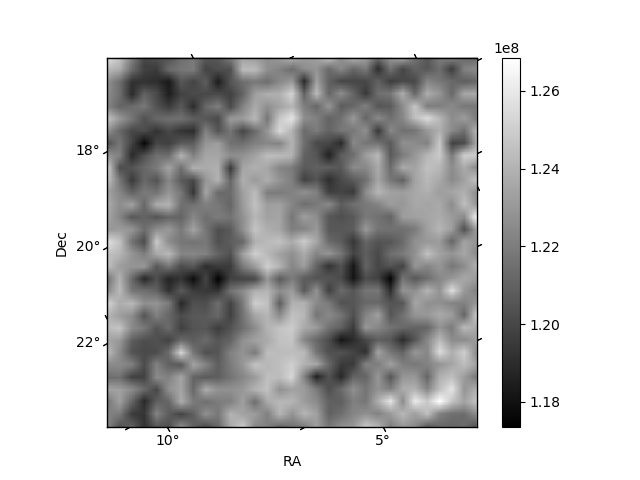
Histogram calculated using DETX and DETY for each event in the final _common_clean file
| Quadrant A |  |
 |
Quadrant B |
|---|---|---|---|
| Quadrant D |  |
 |
Quadrant C |
| Plot type | Count rate plots | Images |
|---|---|---|
| Comparison with Poisson distribution Blue bars denote a histogram of data divided into 1 sec bins. Red curve is a Poisson curve with rate = median count rate of data. |
 |
 |
| Quadrant-wise count rates Data is divided into 100 sec bins |
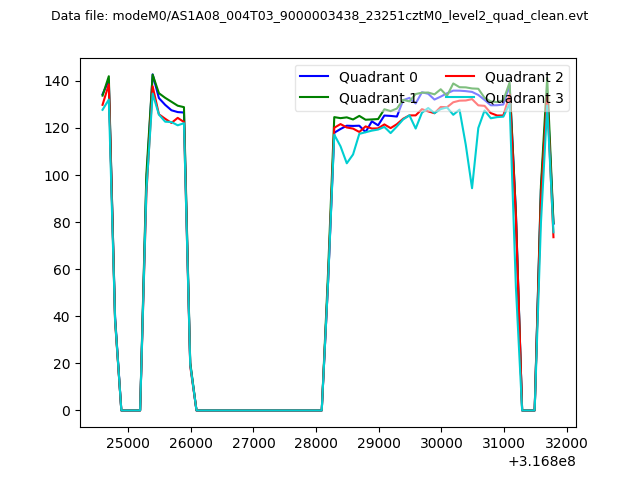 |
|
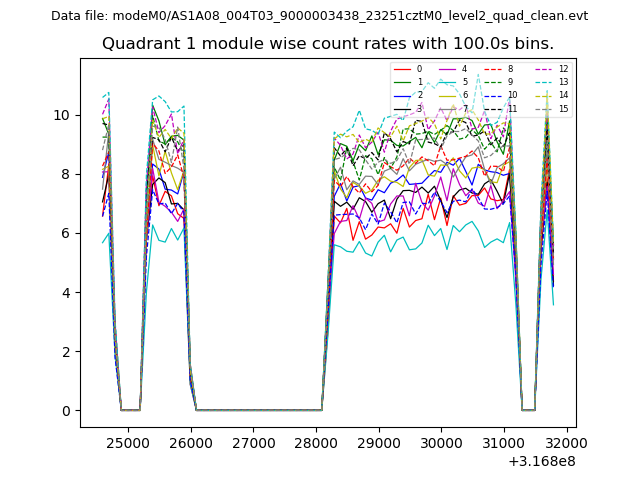
| Module-wise count rates for Quadrant A Data is divided into 100 sec bins |
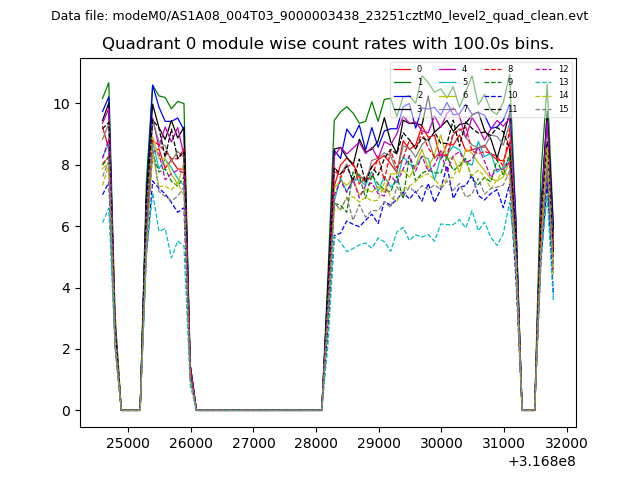 |
 |
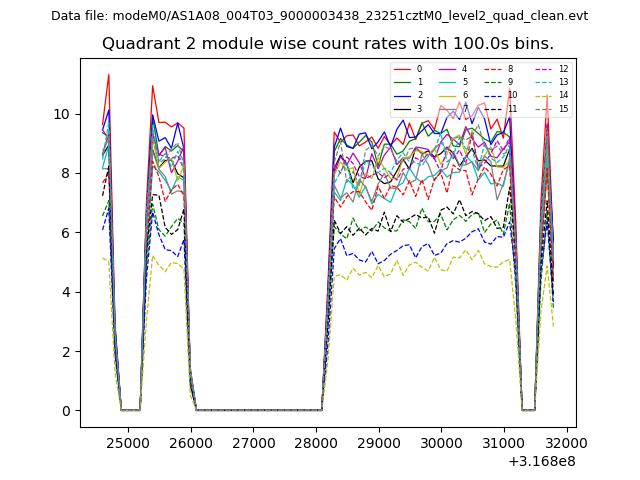
| Module-wise count rates for Quadrant B Data is divided into 100 sec bins |
 |
 |
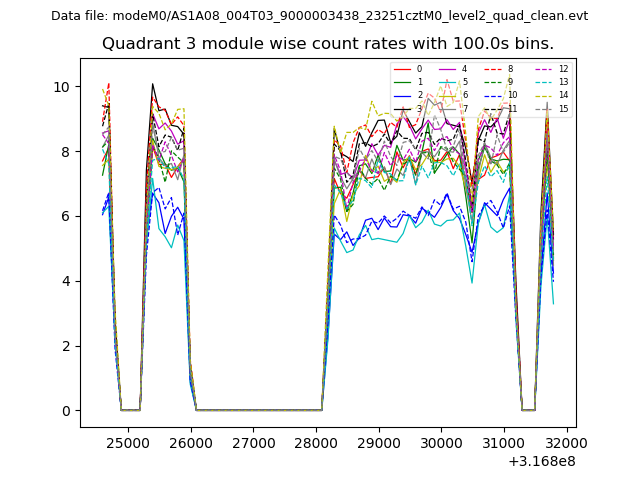
| Module-wise count rates for Quadrant C Data is divided into 100 sec bins |
 |
 |
| Module-wise count rates for Quadrant D Data is divided into 100 sec bins |
 |
 |
| Parameter | Plot |
|---|---|
| CZT HV Monitor | 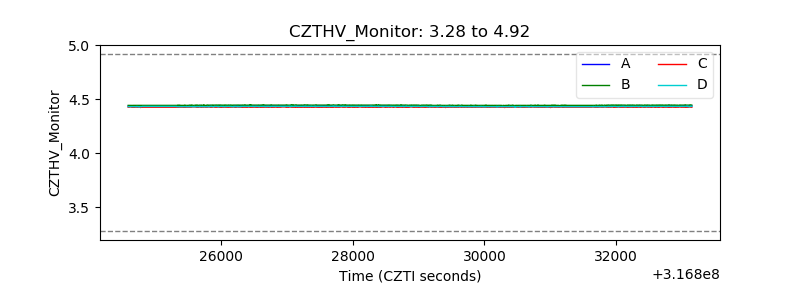 |
| D_VDD | 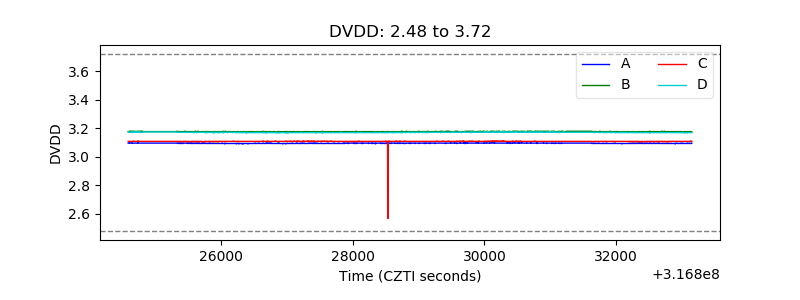 |
| Temperature 1 | 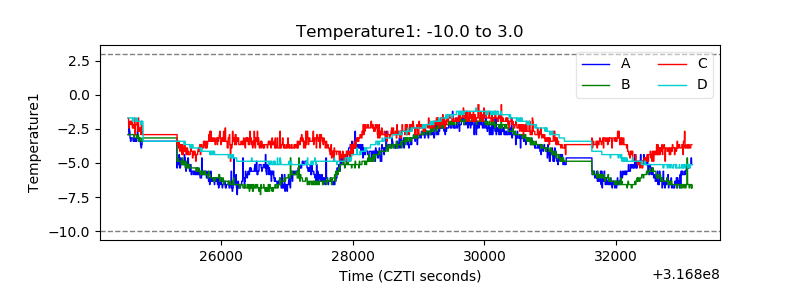 |
| Veto HV Monitor |  |
| Veto LLD | 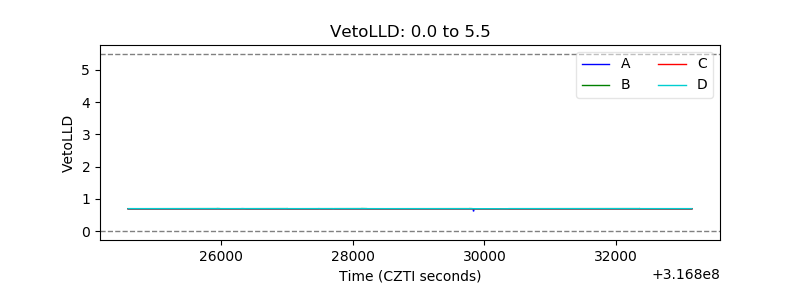 |
| Alpha Counter | 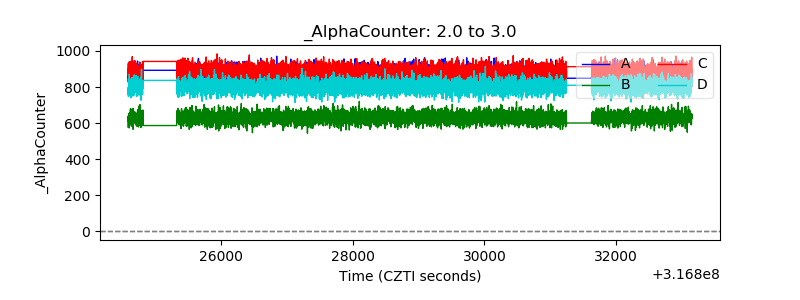 |
| _CPM_Rate | 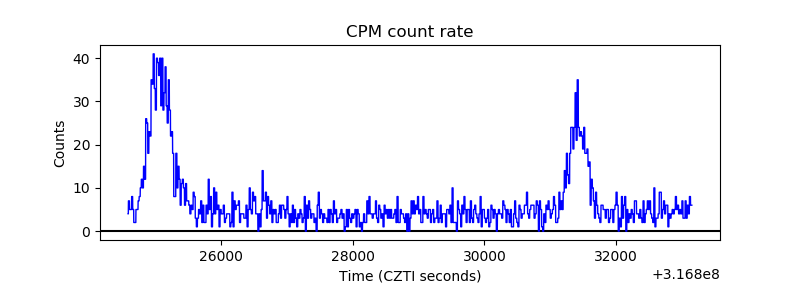 |
| CZT Counter | 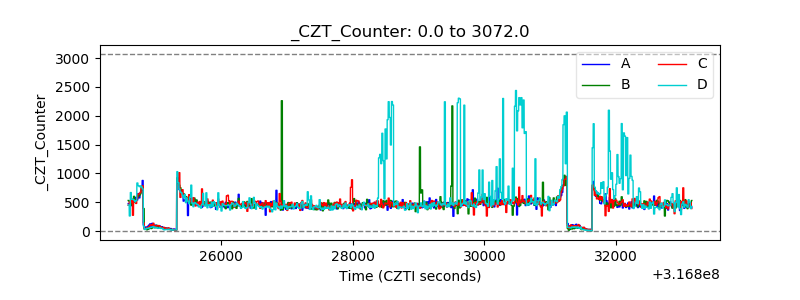 |
| +2.5 Volts monitor |  |
| +5 Volts monitor | 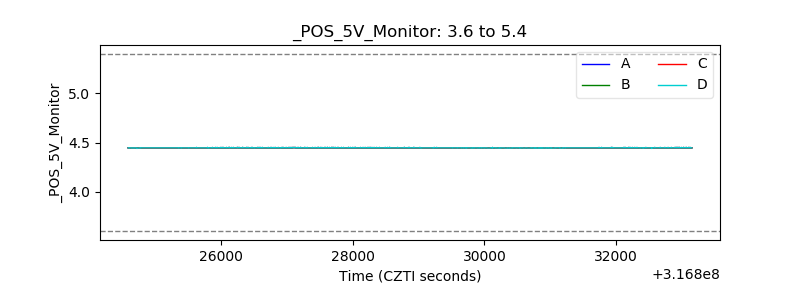 |
| _ROLL_ROT | 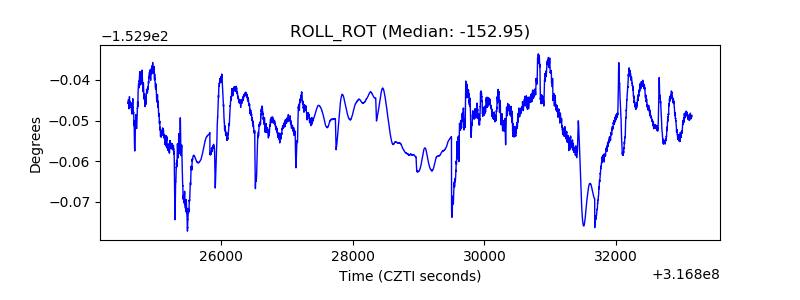 |
| _Roll_DEC |  |
| _Roll_RA | 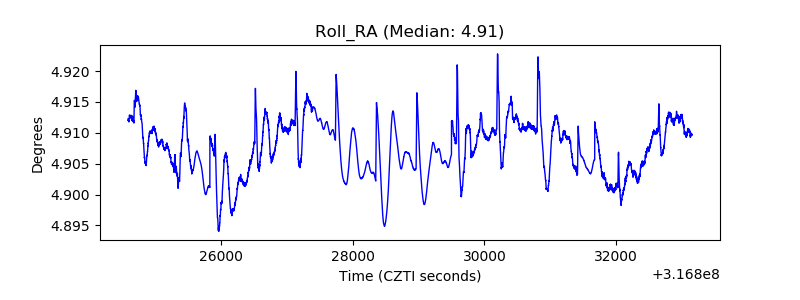 |
| Veto Counter | 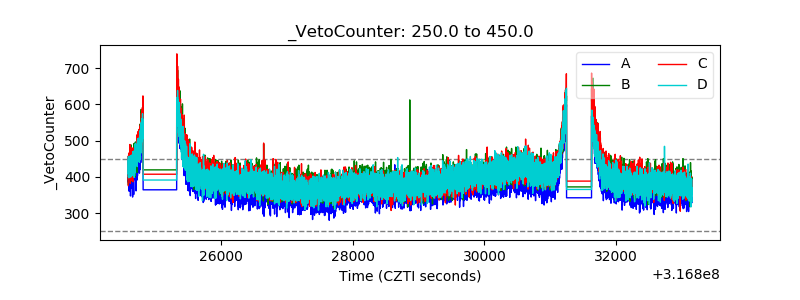 |