| Param | Original file | Final file |
|---|---|---|
| Filename | modeM0/AS1A08_004T03_9000003438_23254cztM0_level2.evt | modeM0/AS1A08_004T03_9000003438_23254cztM0_level2_quad_clean.evt |
| Size (bytes) | 891,037,440 | 152,870,400 |
| Size | 849.8 MB | 145.8 MB |
| Events in quadrant A | 5,973,159 | 952,206 |
| Events in quadrant B | 6,153,122 | 966,939 |
| Events in quadrant C | 6,791,943 | 919,993 |
| Events in quadrant D | 7,200,303 | 905,926 |
| Mode M9 | |||
|---|---|---|---|
| Quadrant | BADHDUFLAG | Total packets | Discarded packets |
| A | 0 | 12 | 0 |
| B | 0 | 12 | 0 |
| C | 0 | 12 | 0 |
| D | 0 | 12 | 0 |
| Mode M0 | |||
|---|---|---|---|
| Quadrant | BADHDUFLAG | Total packets | Discarded packets |
| A | 0 | 25981 | 2 |
| B | 0 | 26243 | 2 |
| C | 0 | 28551 | 2 |
| D | 0 | 29818 | 2 |
| Mode SS | |||
|---|---|---|---|
| Quadrant | BADHDUFLAG | Total packets | Discarded packets |
| A | 0 | 260 | 0 |
| B | 0 | 260 | 0 |
| C | 0 | 260 | 0 |
| D | 0 | 260 | 0 |
| Quadrant | Total seconds | Saturated seconds | Saturation percentage |
|---|---|---|---|
| A | 12800 | 130 | 1.015625% |
| B | 12800 | 176 | 1.375000% |
| C | 12800 | 302 | 2.359375% |
| D | 12800 | 265 | 2.070312% |
Noise dominated data is calculated using 1-second bins in cleaned event files. If a bin has >2000 counts, and if more than 50% of those come from <1% of pixels, then it is considered to be noise-dominated and hence unusable.
| Quadrant | # 1 sec bins | Bins with >0 counts | Bins with >2000 counts | High rate bins dominated by noise | Noise dominated (total time) | Noise dominated (detector-on time) | Marked lightcurve |
|---|---|---|---|---|---|---|---|
| A | 14045 | 12800 | 0 | 0 | 0.00% | 0.00% | 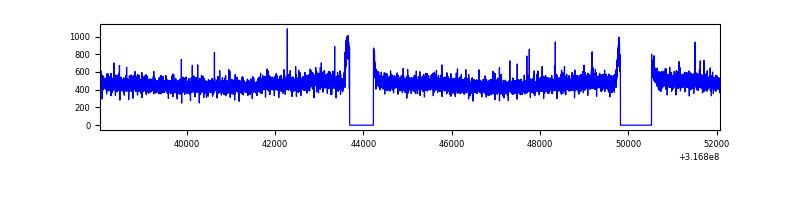 |
| B | 14045 | 12800 | 1 | 1 | 0.01% | 0.01% | 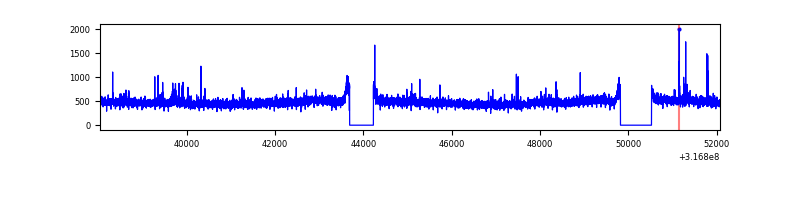 |
| C | 14045 | 12800 | 71 | 71 | 0.51% | 0.55% | 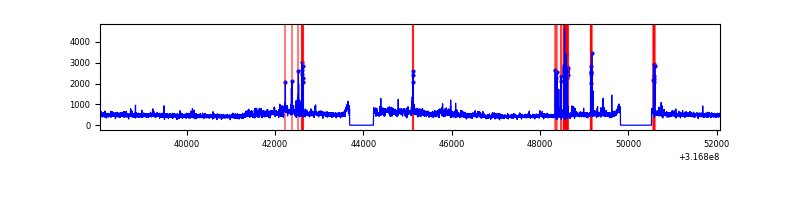 |
| D | 14045 | 12800 | 136 | 136 | 0.97% | 1.06% | 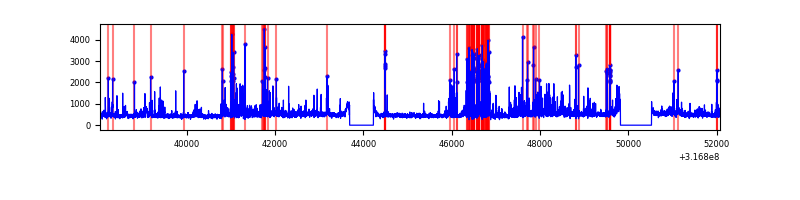 |
Top three noisy pixels from each quadrant. If the there are fewer than three noisy pixels in the level2.evt file, extra rows are filled as -1
| Pixel properties | Quadrant properties | ||||||
|---|---|---|---|---|---|---|---|
| Quadrant | DetID | PixID | Counts | Sigma | Mean | Median | Sigma |
| A | 13 | 254 | 18916 | 55.59 | 1546 | 1510 | 313.1 |
| A | 3 | 137 | 13822 | 39.32 | 1546 | 1510 | 313.1 |
| A | 0 | 226 | 13071 | 36.92 | 1546 | 1510 | 313.1 |
| B | 4 | 173 | 46103 | 149.33 | 1543 | 1502 | 298.7 |
| B | 12 | 111 | 37016 | 118.9 | 1543 | 1502 | 298.7 |
| B | 11 | 111 | 32743 | 104.6 | 1543 | 1502 | 298.7 |
| C | 8 | 208 | 520953 | 1482.99 | 1480 | 1486 | 350.3 |
| C | 14 | 238 | 233395 | 662.06 | 1480 | 1486 | 350.3 |
| C | 0 | 207 | 213451 | 605.12 | 1480 | 1486 | 350.3 |
| D | 1 | 52 | 1169218 | 3197.97 | 1501 | 1461 | 365.2 |
| D | 12 | 233 | 120507 | 326.01 | 1501 | 1461 | 365.2 |
| D | 2 | 152 | 115484 | 312.26 | 1501 | 1461 | 365.2 |
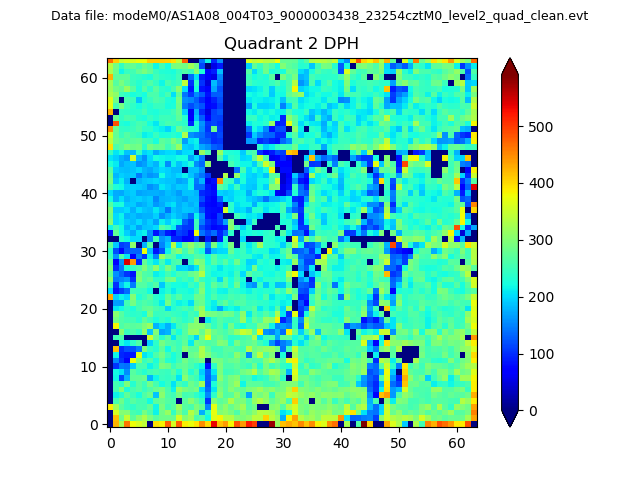
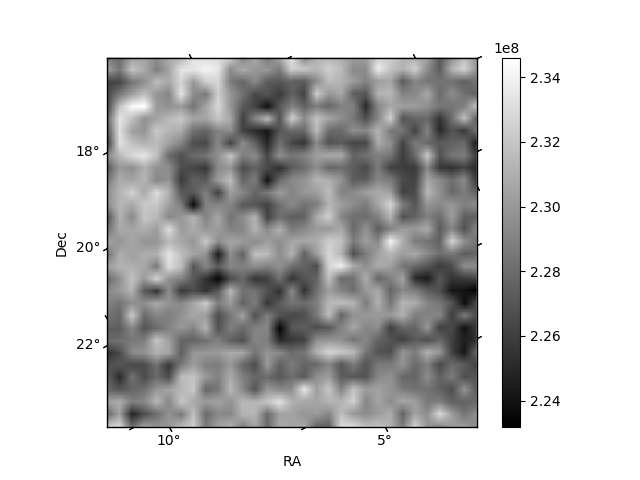
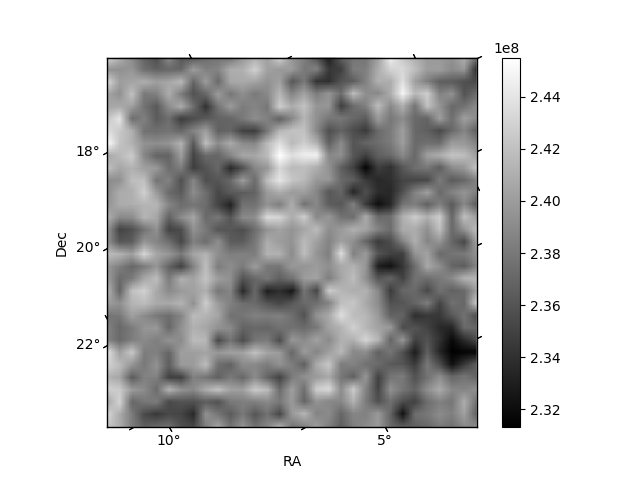
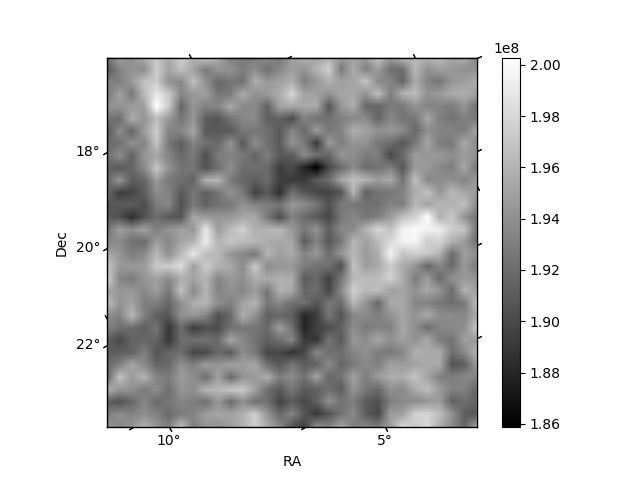
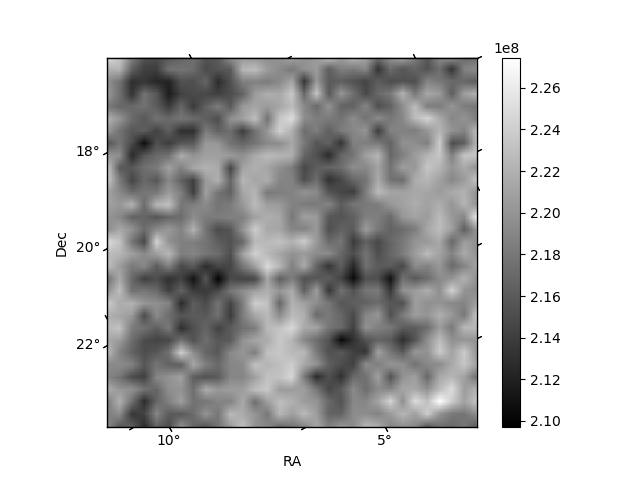
Histogram calculated using DETX and DETY for each event in the final _common_clean file
| Quadrant A |  |
 |
Quadrant B |
|---|---|---|---|
| Quadrant D | 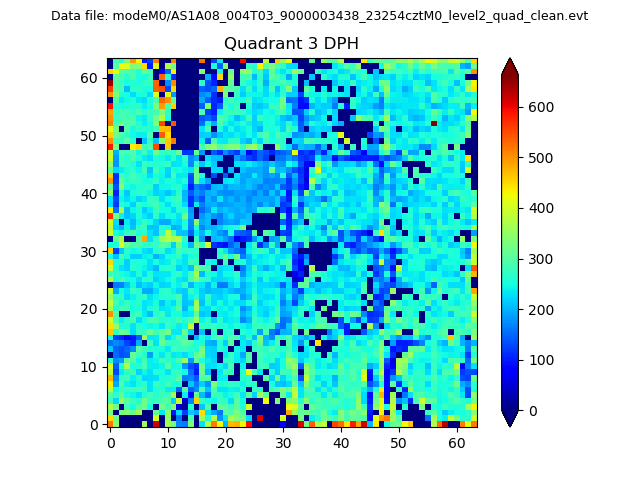 |
 |
Quadrant C |
| Plot type | Count rate plots | Images |
|---|---|---|
| Comparison with Poisson distribution Blue bars denote a histogram of data divided into 1 sec bins. Red curve is a Poisson curve with rate = median count rate of data. |
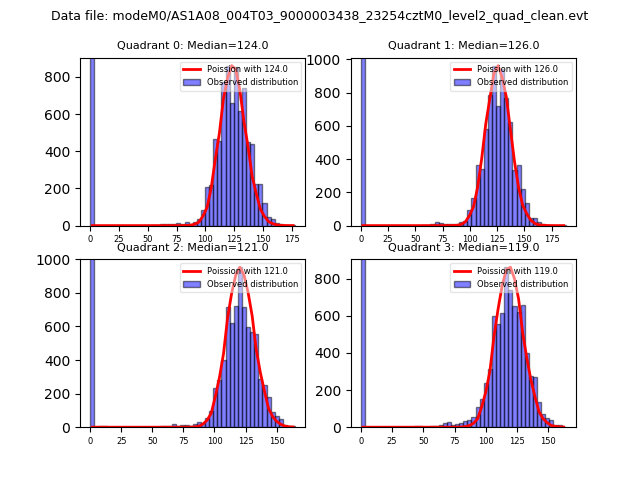 |
 |
| Quadrant-wise count rates Data is divided into 100 sec bins |
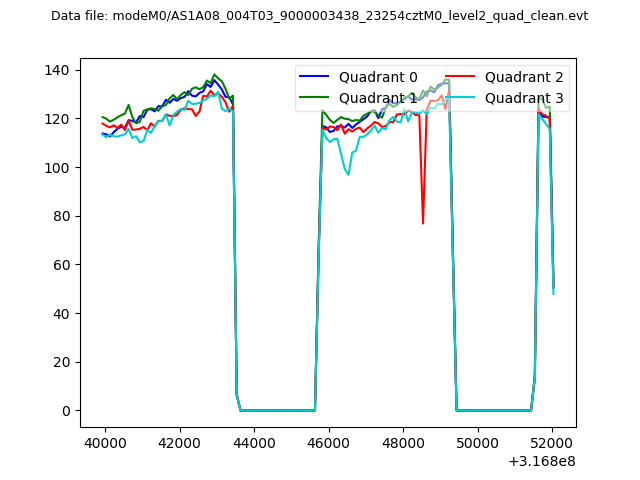 |
|
| Module-wise count rates for Quadrant A Data is divided into 100 sec bins |
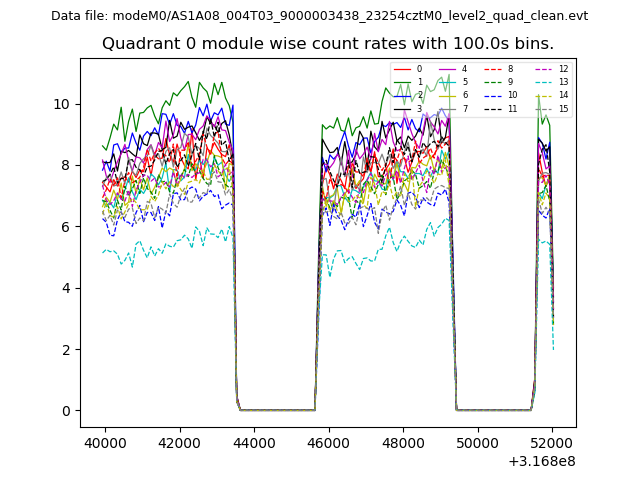 |
 |
| Module-wise count rates for Quadrant B Data is divided into 100 sec bins |
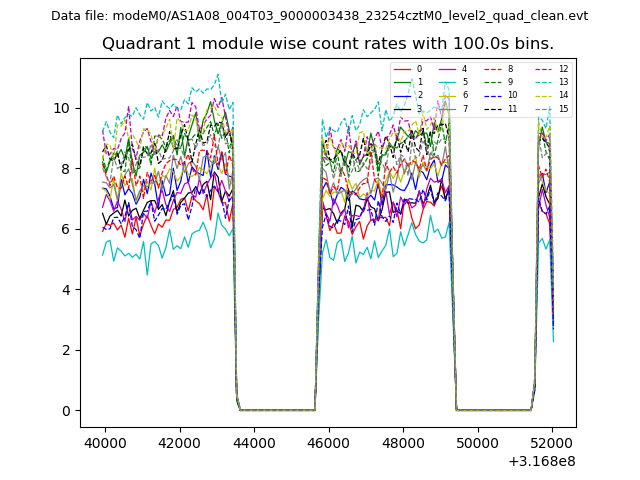 |
 |
| Module-wise count rates for Quadrant C Data is divided into 100 sec bins |
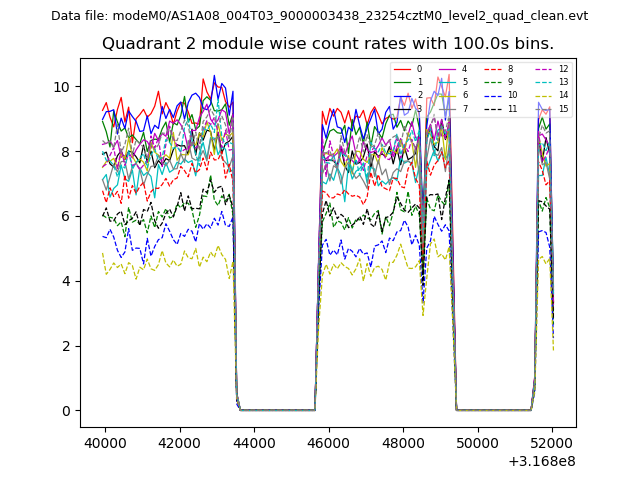 |
 |
| Module-wise count rates for Quadrant D Data is divided into 100 sec bins |
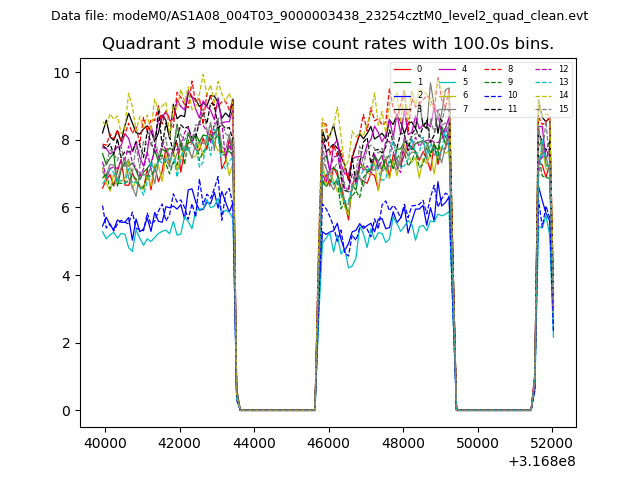 |
 |
| Parameter | Plot |
|---|---|
| CZT HV Monitor | 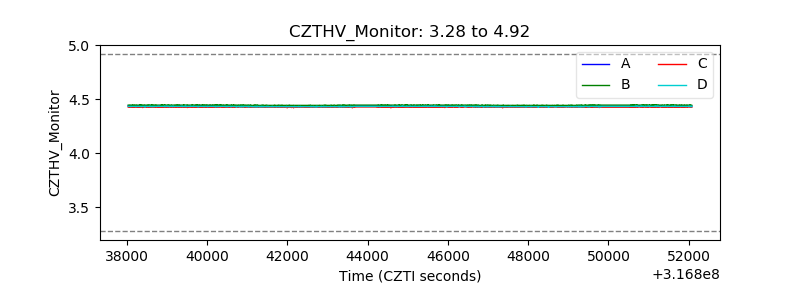 |
| D_VDD | 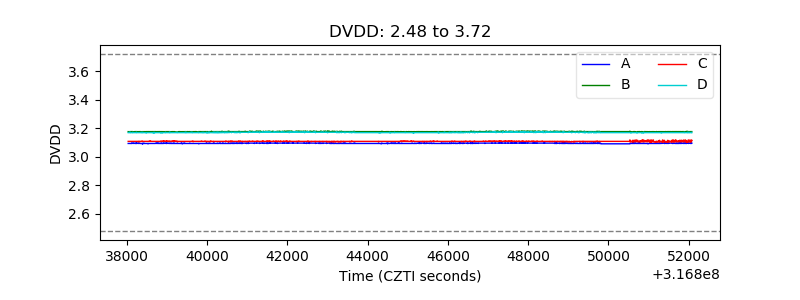 |
| Temperature 1 | 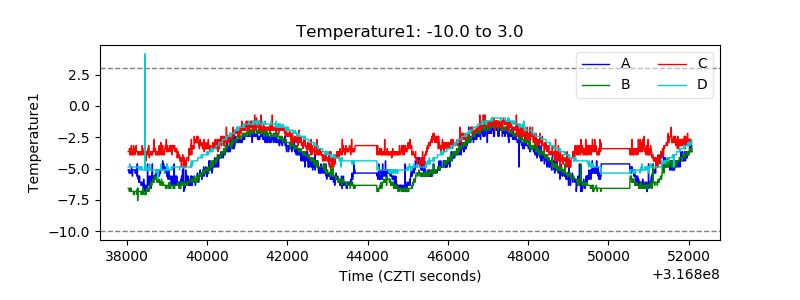 |
| Veto HV Monitor | 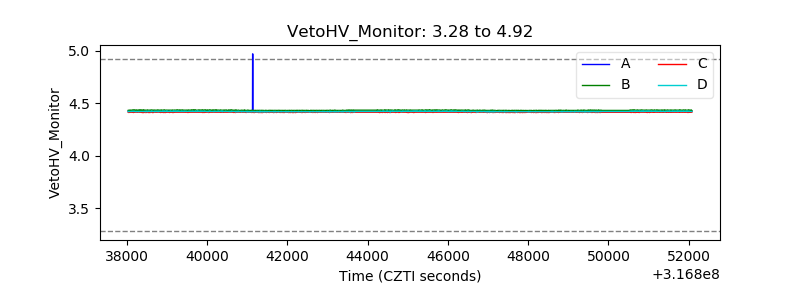 |
| Veto LLD |  |
| Alpha Counter | 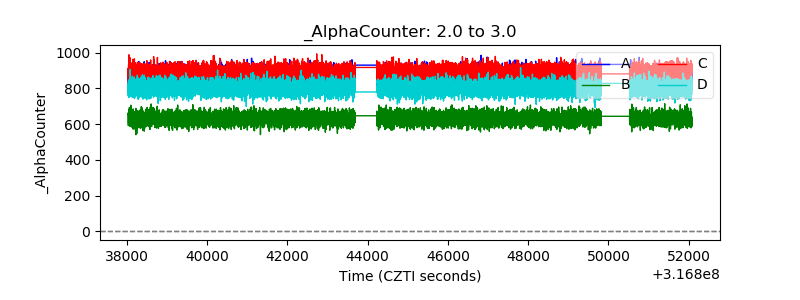 |
| _CPM_Rate | 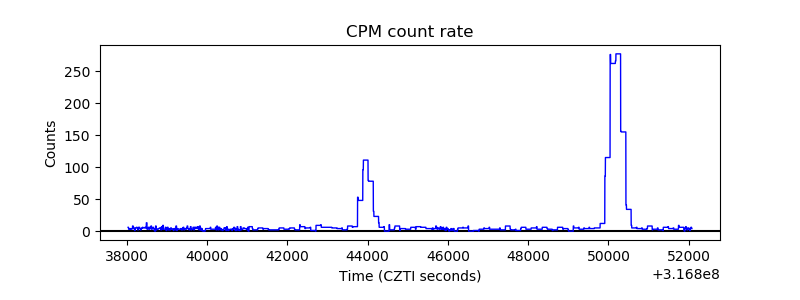 |
| CZT Counter | 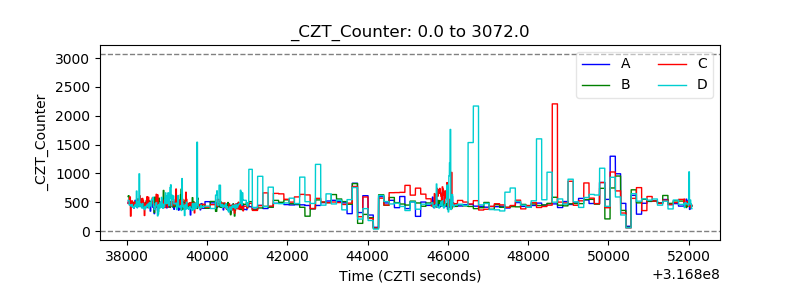 |
| +2.5 Volts monitor | 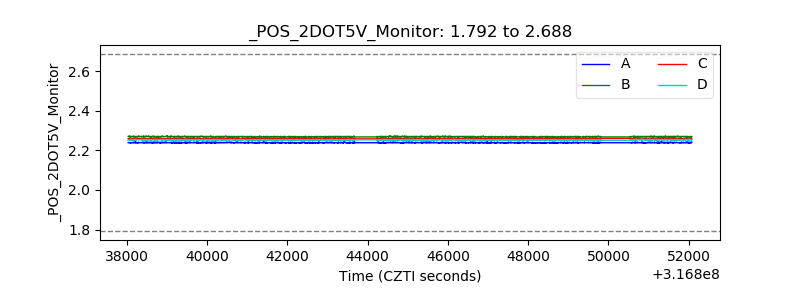 |
| +5 Volts monitor | 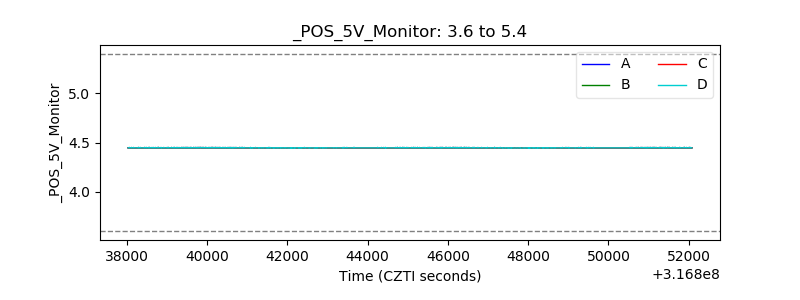 |
| _ROLL_ROT | 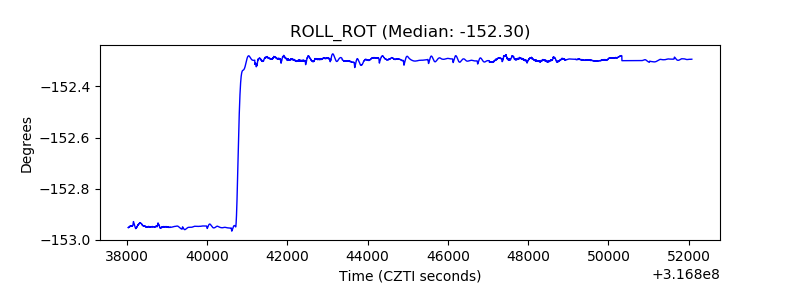 |
| _Roll_DEC | 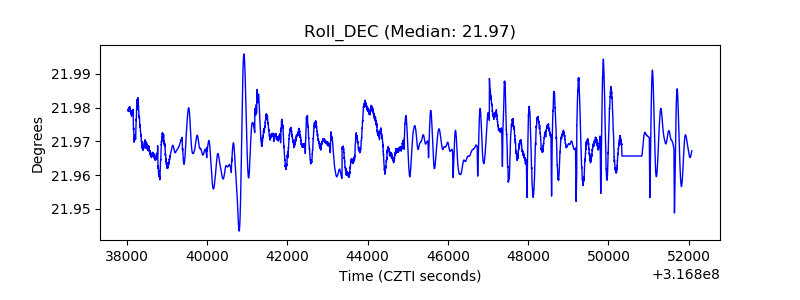 |
| _Roll_RA |  |
| Veto Counter | 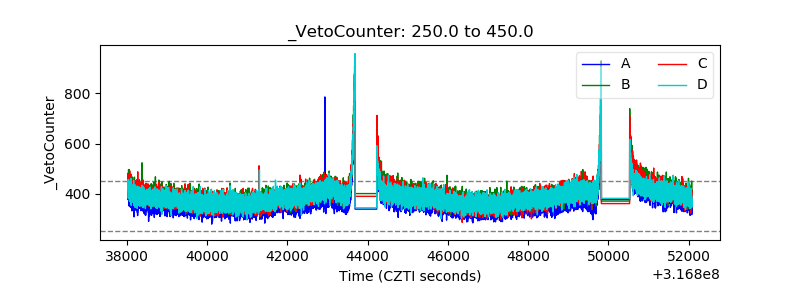 |