| Param | Original file | Final file |
|---|---|---|
| Filename | modeM0/AS1A08_004T03_9000003438_23256cztM0_level2.evt | modeM0/AS1A08_004T03_9000003438_23256cztM0_level2_quad_clean.evt |
| Size (bytes) | 462,225,600 | 96,814,080 |
| Size | 440.8 MB | 92.3 MB |
| Events in quadrant A | 3,195,202 | 632,687 |
| Events in quadrant B | 3,261,285 | 642,049 |
| Events in quadrant C | 3,252,445 | 604,374 |
| Events in quadrant D | 3,843,187 | 594,575 |
| Mode M9 | |||
|---|---|---|---|
| Quadrant | BADHDUFLAG | Total packets | Discarded packets |
| A | 0 | 11 | 0 |
| B | 0 | 11 | 0 |
| C | 0 | 11 | 0 |
| D | 0 | 11 | 0 |
| Mode M0 | |||
|---|---|---|---|
| Quadrant | BADHDUFLAG | Total packets | Discarded packets |
| A | 0 | 13675 | 1 |
| B | 0 | 13805 | 1 |
| C | 0 | 13790 | 1 |
| D | 0 | 15530 | 1 |
| Mode SS | |||
|---|---|---|---|
| Quadrant | BADHDUFLAG | Total packets | Discarded packets |
| A | 0 | 132 | 0 |
| B | 0 | 132 | 0 |
| C | 0 | 132 | 0 |
| D | 0 | 132 | 0 |
| Quadrant | Total seconds | Saturated seconds | Saturation percentage |
|---|---|---|---|
| A | 6577 | 32 | 0.486544% |
| B | 6577 | 46 | 0.699407% |
| C | 6577 | 73 | 1.109929% |
| D | 6577 | 101 | 1.535655% |
Noise dominated data is calculated using 1-second bins in cleaned event files. If a bin has >2000 counts, and if more than 50% of those come from <1% of pixels, then it is considered to be noise-dominated and hence unusable.
| Quadrant | # 1 sec bins | Bins with >0 counts | Bins with >2000 counts | High rate bins dominated by noise | Noise dominated (total time) | Noise dominated (detector-on time) | Marked lightcurve |
|---|---|---|---|---|---|---|---|
| A | 7598 | 6578 | 0 | 0 | 0.00% | 0.00% | 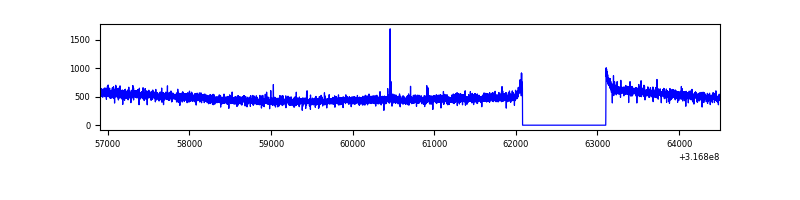 |
| B | 7598 | 6578 | 2 | 2 | 0.03% | 0.03% | 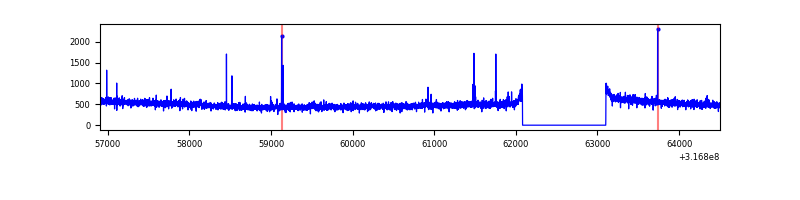 |
| C | 7598 | 6578 | 1 | 1 | 0.01% | 0.02% | 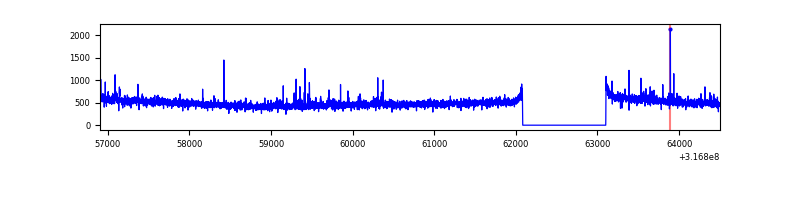 |
| D | 7598 | 6578 | 66 | 66 | 0.87% | 1.00% | 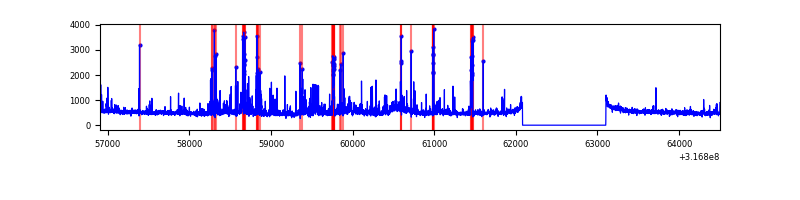 |
Top three noisy pixels from each quadrant. If the there are fewer than three noisy pixels in the level2.evt file, extra rows are filled as -1
| Pixel properties | Quadrant properties | ||||||
|---|---|---|---|---|---|---|---|
| Quadrant | DetID | PixID | Counts | Sigma | Mean | Median | Sigma |
| A | 13 | 254 | 10118 | 55.72 | 827 | 810 | 167.1 |
| A | 3 | 137 | 7232 | 38.44 | 827 | 810 | 167.1 |
| A | 0 | 226 | 7073 | 37.49 | 827 | 810 | 167.1 |
| B | 12 | 111 | 18990 | 114.85 | 821 | 802 | 158.4 |
| B | 3 | 64 | 18195 | 109.83 | 821 | 802 | 158.4 |
| B | 11 | 111 | 17178 | 103.41 | 821 | 802 | 158.4 |
| C | 14 | 238 | 124683 | 673.29 | 781 | 789 | 184.0 |
| C | 0 | 207 | 57487 | 308.12 | 781 | 789 | 184.0 |
| C | 7 | 247 | 9307 | 46.29 | 781 | 789 | 184.0 |
| D | 1 | 52 | 344389 | 1781.34 | 795 | 772 | 192.9 |
| D | 12 | 233 | 169355 | 873.95 | 795 | 772 | 192.9 |
| D | 2 | 152 | 63634 | 325.88 | 795 | 772 | 192.9 |
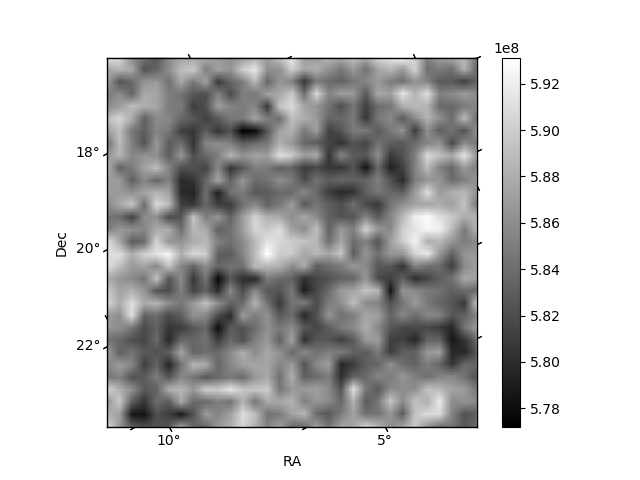
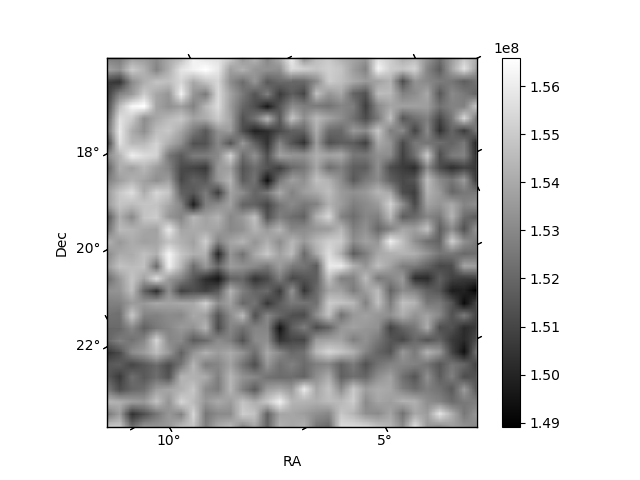
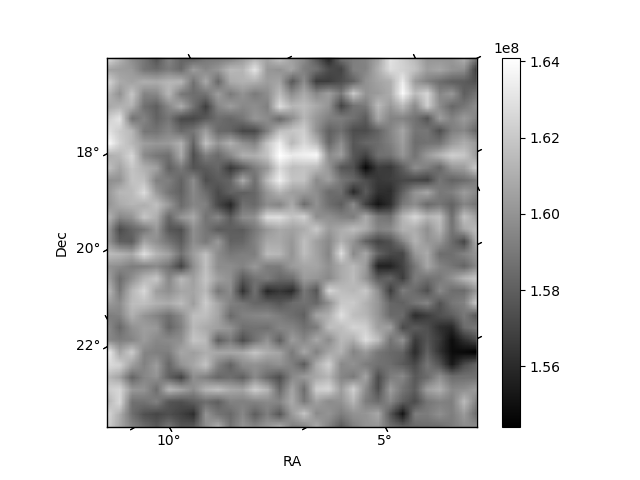
Histogram calculated using DETX and DETY for each event in the final _common_clean file
| Quadrant A | 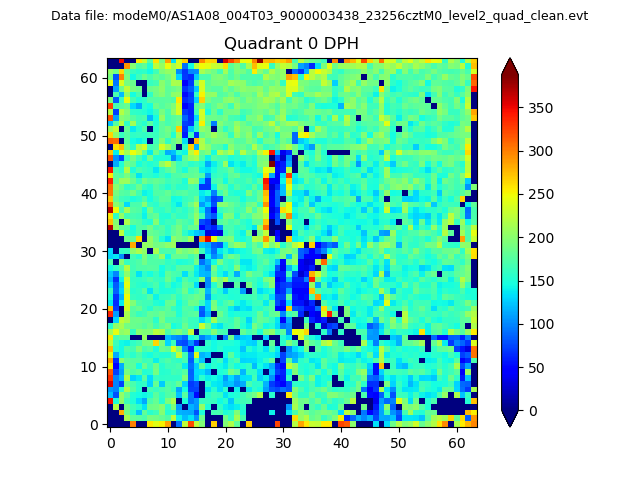 |
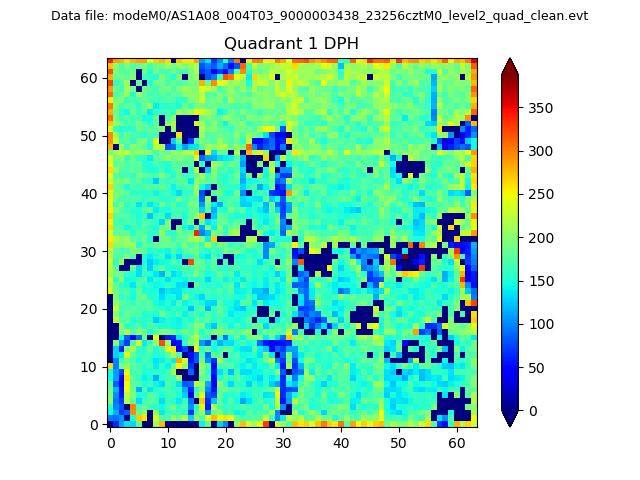 |
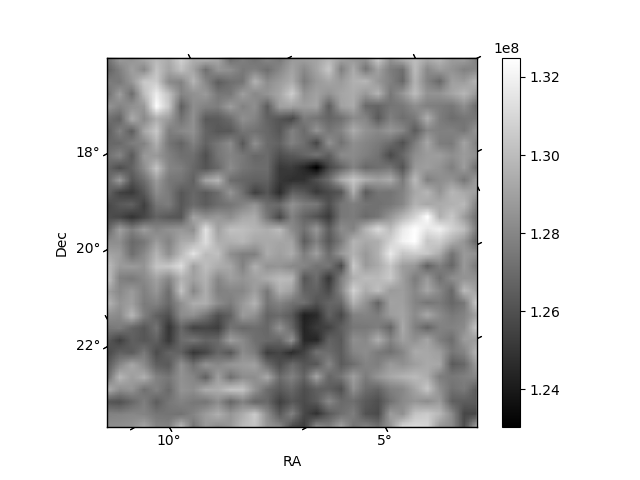
Quadrant B |
|---|---|---|---|
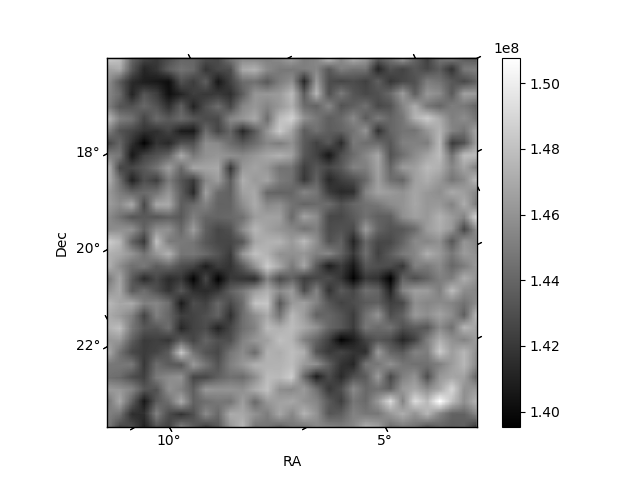
| Quadrant D | 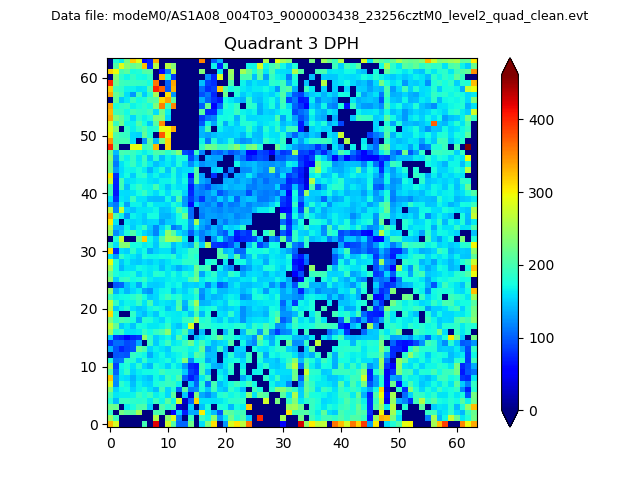 |
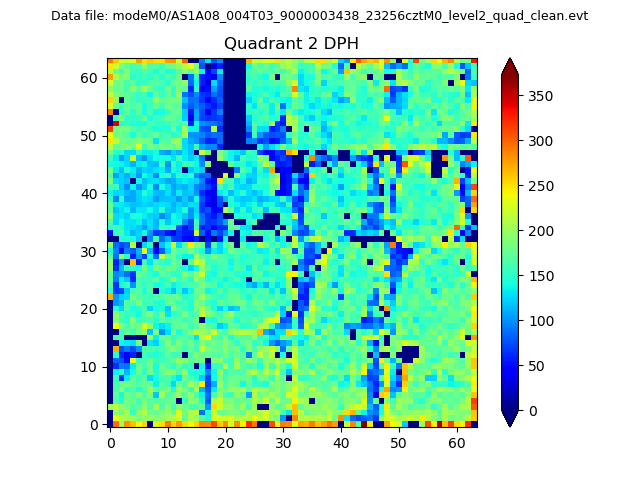 |
Quadrant C |
| Plot type | Count rate plots | Images |
|---|---|---|
| Comparison with Poisson distribution Blue bars denote a histogram of data divided into 1 sec bins. Red curve is a Poisson curve with rate = median count rate of data. |
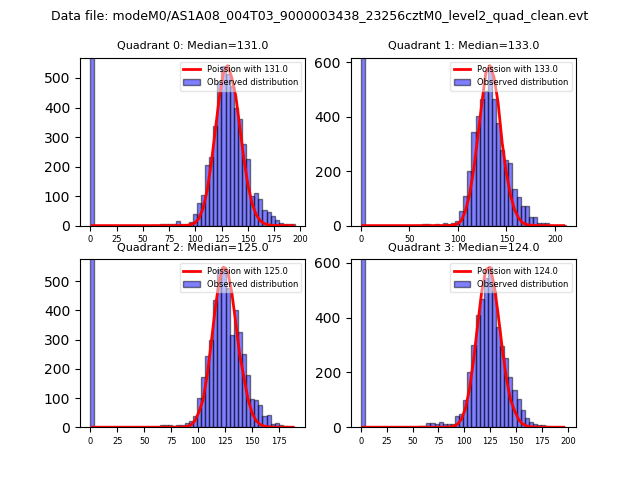 |
 |
| Quadrant-wise count rates Data is divided into 100 sec bins |
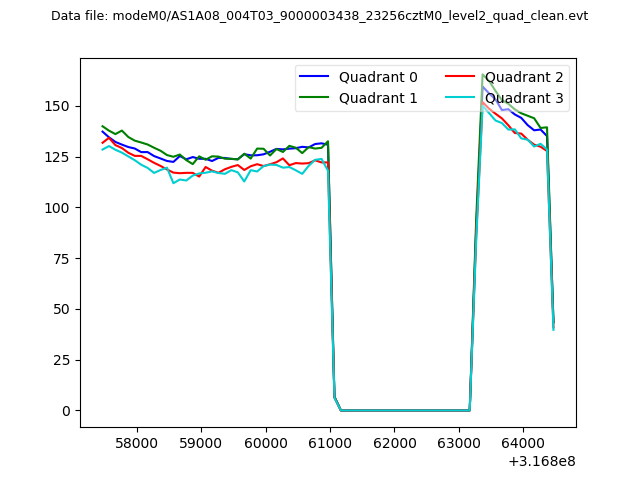 |
|
| Module-wise count rates for Quadrant A Data is divided into 100 sec bins |
 |
 |
| Module-wise count rates for Quadrant B Data is divided into 100 sec bins |
 |
 |
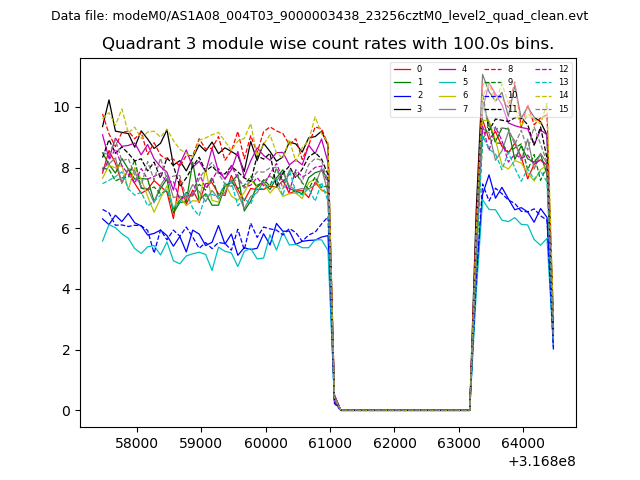
| Module-wise count rates for Quadrant C Data is divided into 100 sec bins |
 |
 |
| Module-wise count rates for Quadrant D Data is divided into 100 sec bins |
 |
 |
| Parameter | Plot |
|---|---|
| CZT HV Monitor |  |
| D_VDD | 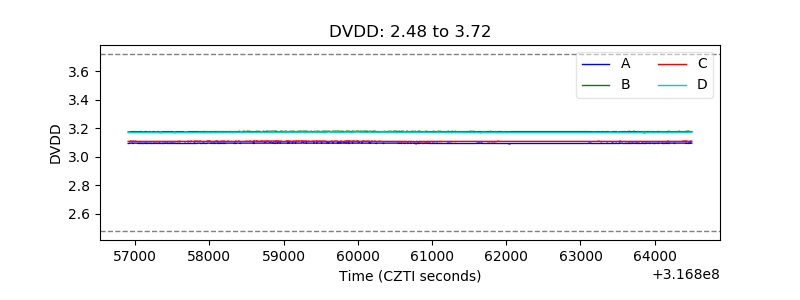 |
| Temperature 1 | 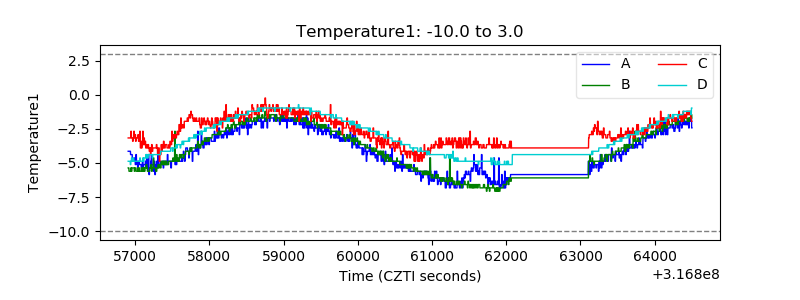 |
| Veto HV Monitor | 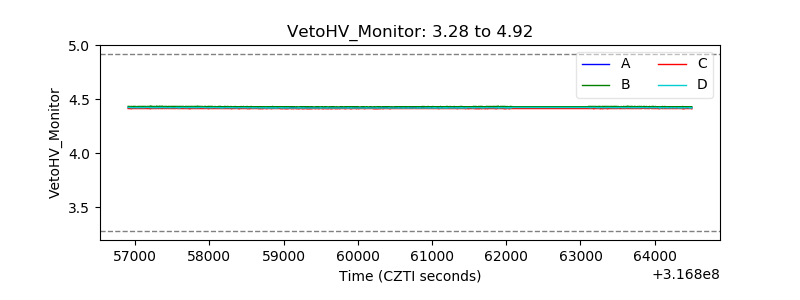 |
| Veto LLD | 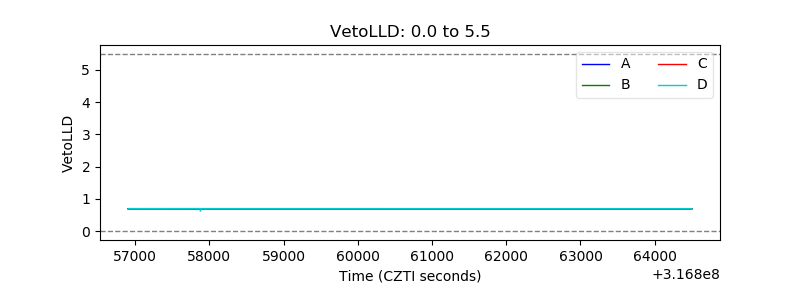 |
| Alpha Counter | 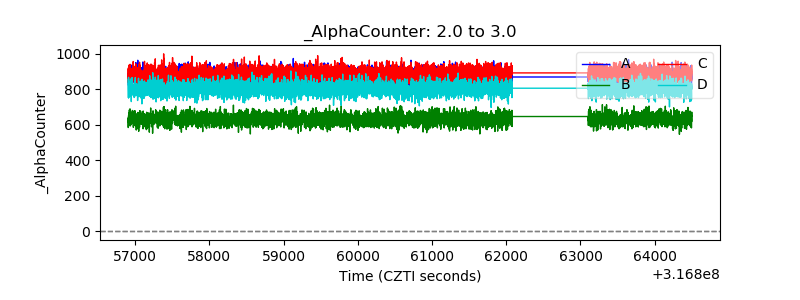 |
| _CPM_Rate | 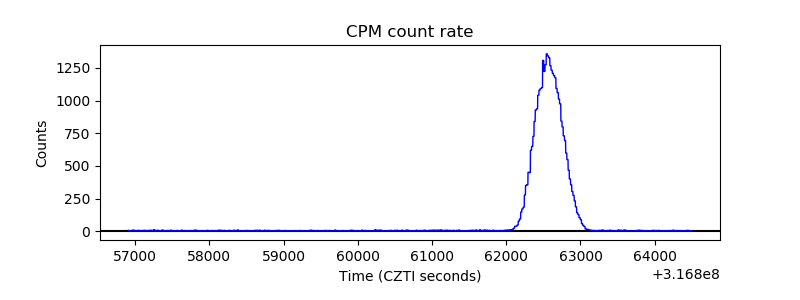 |
| CZT Counter | 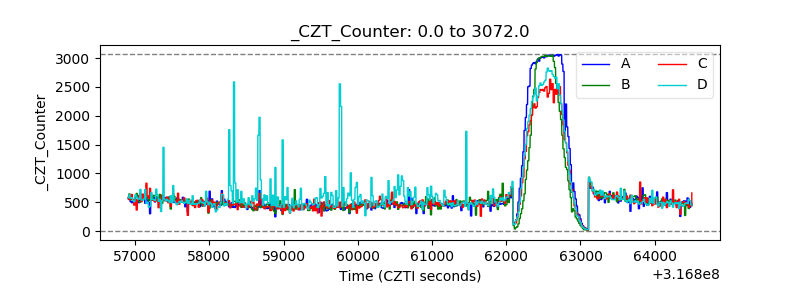 |
| +2.5 Volts monitor |  |
| +5 Volts monitor |  |
| _ROLL_ROT | 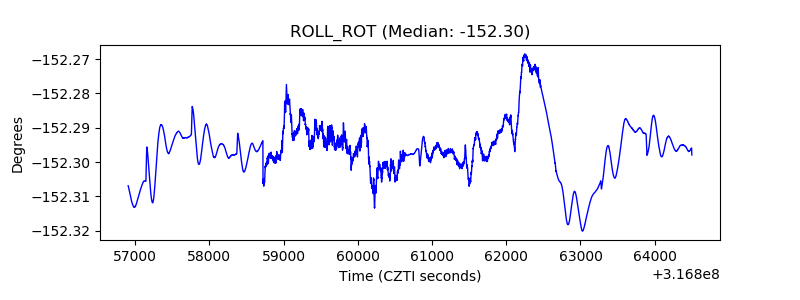 |
| _Roll_DEC | 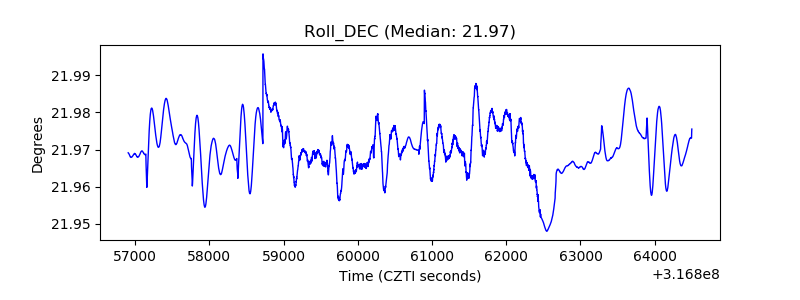 |
| _Roll_RA | 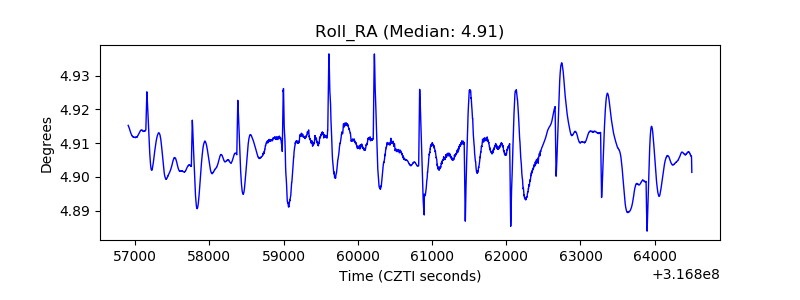 |
| Veto Counter |  |