| Param | Original file | Final file |
|---|---|---|
| Filename | modeM0/AS1A08_004T03_9000003438_23258cztM0_level2.evt | modeM0/AS1A08_004T03_9000003438_23258cztM0_level2_quad_clean.evt |
| Size (bytes) | 456,770,880 | 106,355,520 |
| Size | 435.6 MB | 101.4 MB |
| Events in quadrant A | 3,271,616 | 712,229 |
| Events in quadrant B | 3,322,282 | 721,272 |
| Events in quadrant C | 3,333,444 | 669,649 |
| Events in quadrant D | 3,464,890 | 665,045 |
| Mode M9 | |||
|---|---|---|---|
| Quadrant | BADHDUFLAG | Total packets | Discarded packets |
| A | 0 | 11 | 0 |
| B | 0 | 12 | 0 |
| C | 0 | 12 | 0 |
| D | 0 | 12 | 0 |
| Mode M0 | |||
|---|---|---|---|
| Quadrant | BADHDUFLAG | Total packets | Discarded packets |
| A | 0 | 13906 | 2 |
| B | 0 | 14034 | 2 |
| C | 0 | 14074 | 3 |
| D | 0 | 14274 | 2 |
| Mode SS | |||
|---|---|---|---|
| Quadrant | BADHDUFLAG | Total packets | Discarded packets |
| A | 0 | 132 | 0 |
| B | 0 | 132 | 0 |
| C | 0 | 132 | 0 |
| D | 0 | 132 | 0 |
| Quadrant | Total seconds | Saturated seconds | Saturation percentage |
|---|---|---|---|
| A | 6494 | 54 | 0.831537% |
| B | 6494 | 63 | 0.970126% |
| C | 6493 | 75 | 1.155090% |
| D | 6493 | 43 | 0.662252% |
Noise dominated data is calculated using 1-second bins in cleaned event files. If a bin has >2000 counts, and if more than 50% of those come from <1% of pixels, then it is considered to be noise-dominated and hence unusable.
| Quadrant | # 1 sec bins | Bins with >0 counts | Bins with >2000 counts | High rate bins dominated by noise | Noise dominated (total time) | Noise dominated (detector-on time) | Marked lightcurve |
|---|---|---|---|---|---|---|---|
| A | 7619 | 6494 | 0 | 0 | 0.00% | 0.00% | 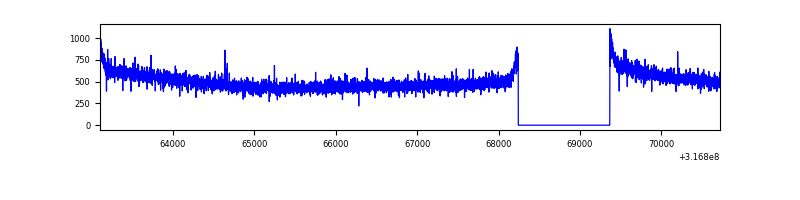 |
| B | 7619 | 6494 | 1 | 1 | 0.01% | 0.02% | 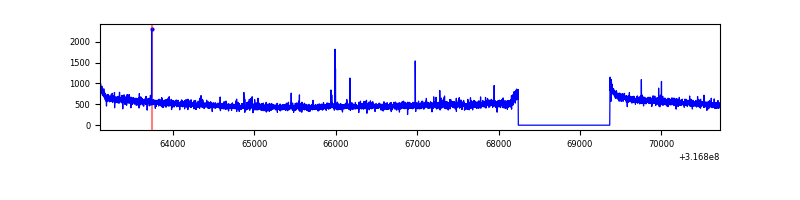 |
| C | 7618 | 6493 | 1 | 1 | 0.01% | 0.02% | 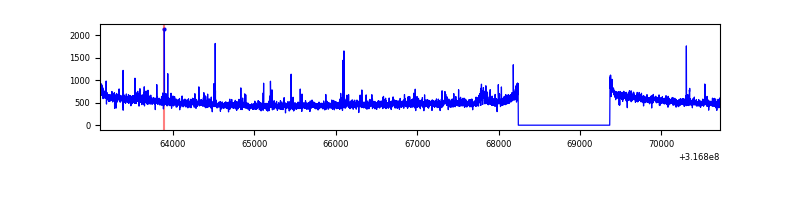 |
| D | 7618 | 6493 | 7 | 7 | 0.09% | 0.11% | 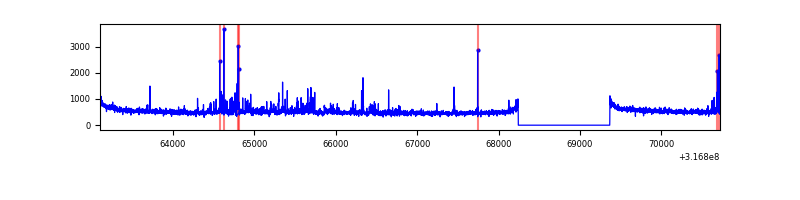 |
Top three noisy pixels from each quadrant. If the there are fewer than three noisy pixels in the level2.evt file, extra rows are filled as -1
| Pixel properties | Quadrant properties | ||||||
|---|---|---|---|---|---|---|---|
| Quadrant | DetID | PixID | Counts | Sigma | Mean | Median | Sigma |
| A | 13 | 254 | 10463 | 56.64 | 848 | 831 | 170.1 |
| A | 0 | 226 | 7481 | 39.1 | 848 | 831 | 170.1 |
| A | 3 | 137 | 7092 | 36.82 | 848 | 831 | 170.1 |
| B | 12 | 111 | 18824 | 114.4 | 838 | 818 | 157.4 |
| B | 11 | 111 | 16833 | 101.75 | 838 | 818 | 157.4 |
| B | 0 | 229 | 15985 | 96.36 | 838 | 818 | 157.4 |
| C | 14 | 238 | 127645 | 687.64 | 793 | 801 | 184.5 |
| C | 0 | 207 | 76347 | 409.55 | 793 | 801 | 184.5 |
| C | 10 | 9 | 14340 | 73.4 | 793 | 801 | 184.5 |
| D | 1 | 239 | 121335 | 606.8 | 817 | 794 | 198.7 |
| D | 2 | 152 | 77771 | 387.5 | 817 | 794 | 198.7 |
| D | 12 | 233 | 51573 | 255.62 | 817 | 794 | 198.7 |
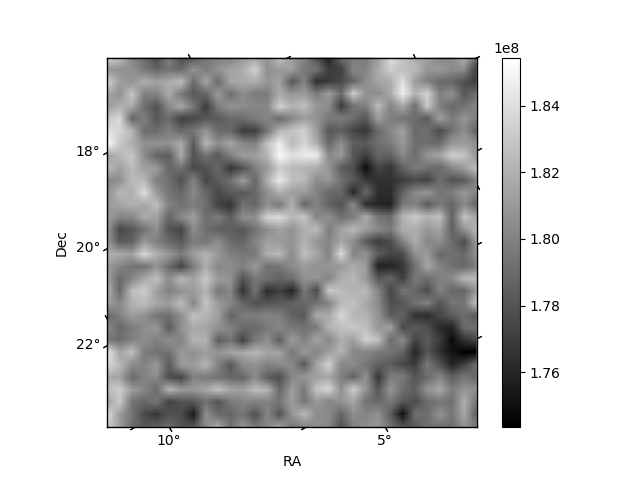
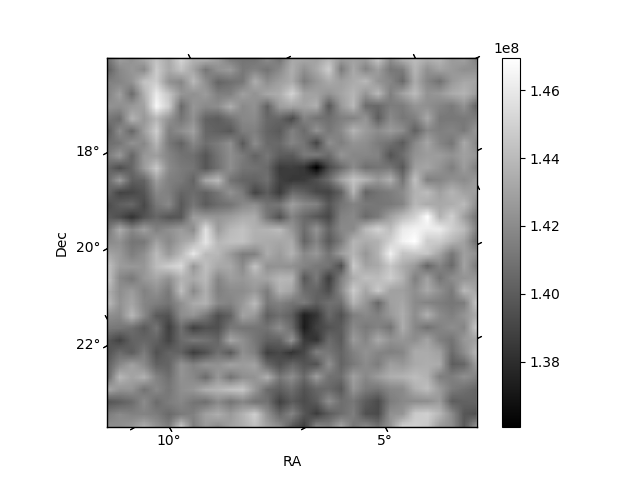
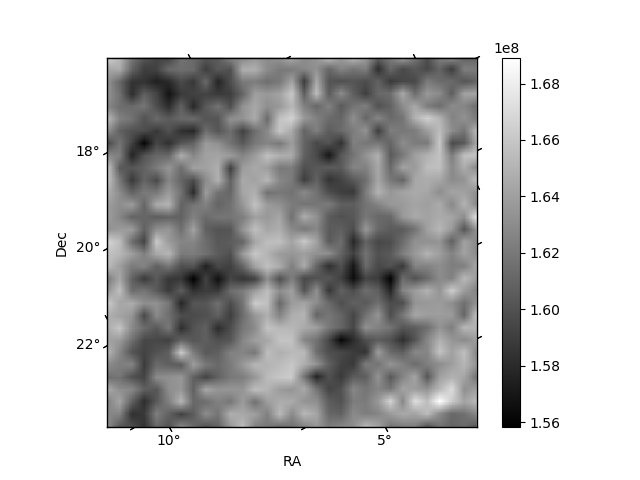
Histogram calculated using DETX and DETY for each event in the final _common_clean file
| Quadrant A | 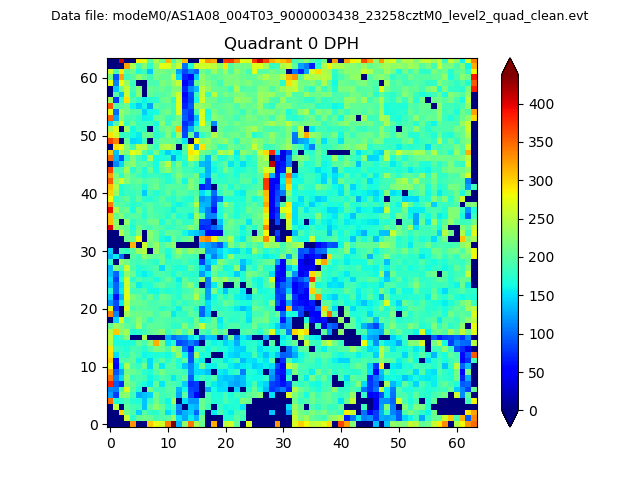 |
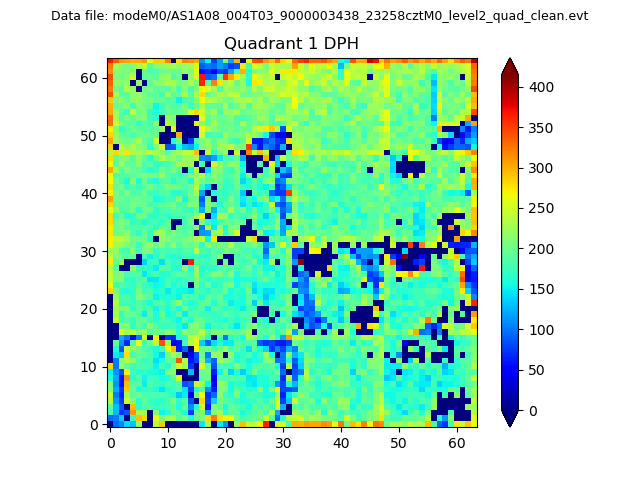 |
Quadrant B |
|---|---|---|---|
| Quadrant D | 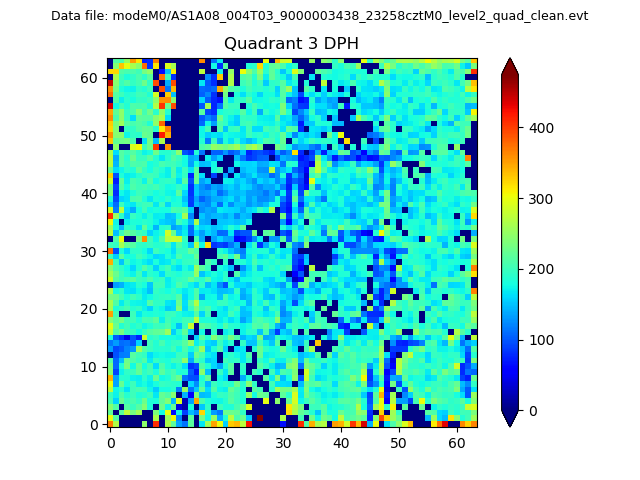 |
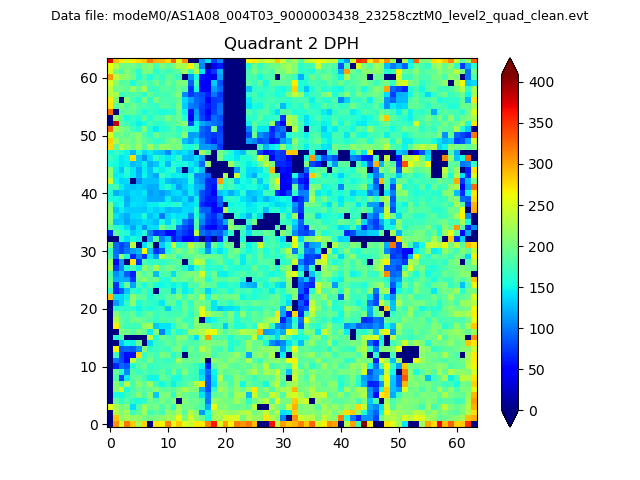 |
Quadrant C |
| Plot type | Count rate plots | Images |
|---|---|---|
| Comparison with Poisson distribution Blue bars denote a histogram of data divided into 1 sec bins. Red curve is a Poisson curve with rate = median count rate of data. |
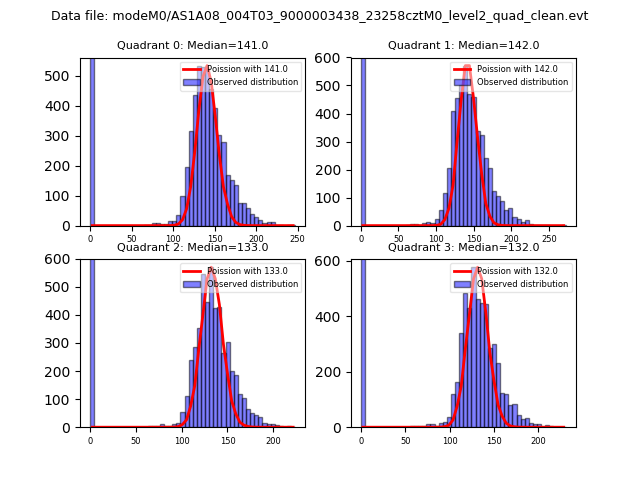 |
 |
| Quadrant-wise count rates Data is divided into 100 sec bins |
 |
|
| Module-wise count rates for Quadrant A Data is divided into 100 sec bins |
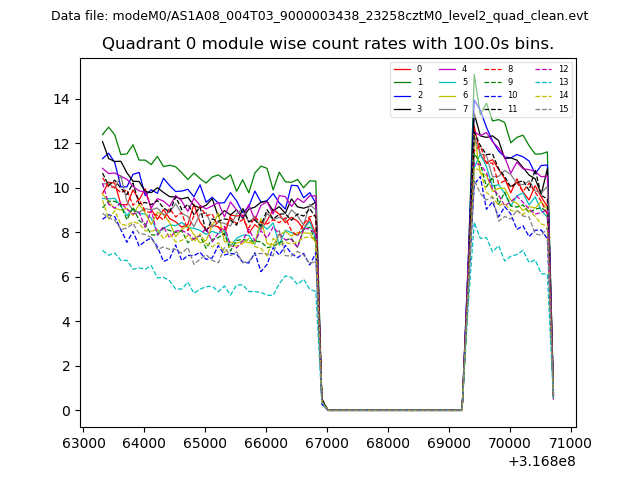 |
 |
| Module-wise count rates for Quadrant B Data is divided into 100 sec bins |
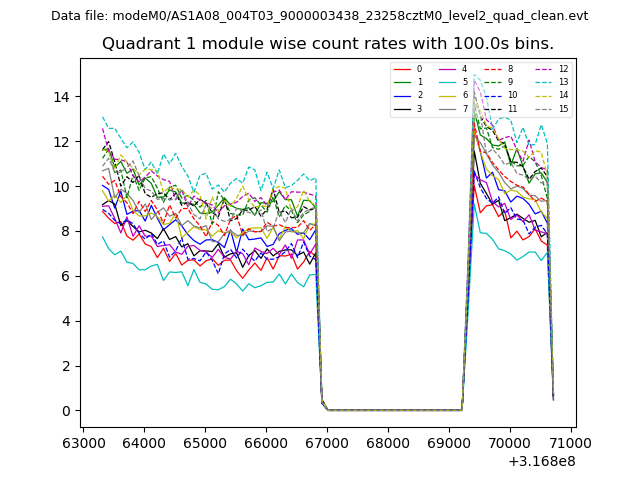 |
 |
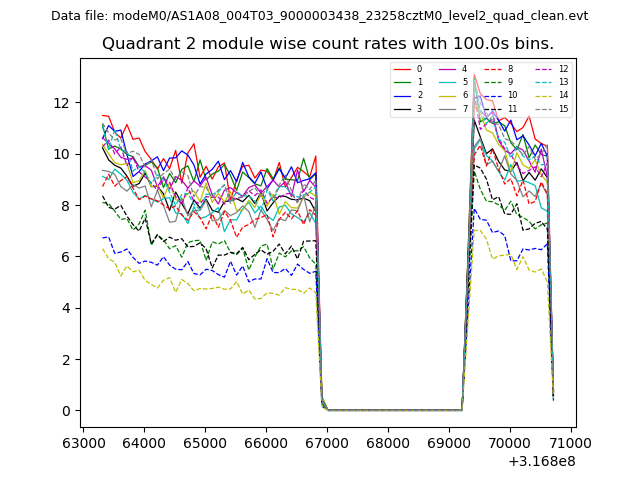
| Module-wise count rates for Quadrant C Data is divided into 100 sec bins |
 |
 |
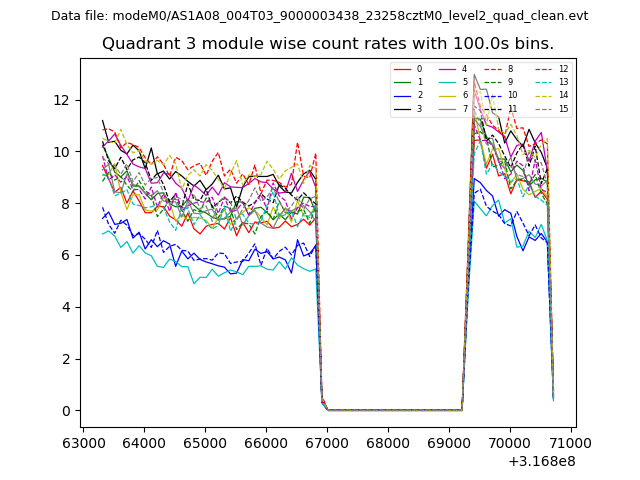
| Module-wise count rates for Quadrant D Data is divided into 100 sec bins |
 |
 |
| Parameter | Plot |
|---|---|
| CZT HV Monitor | 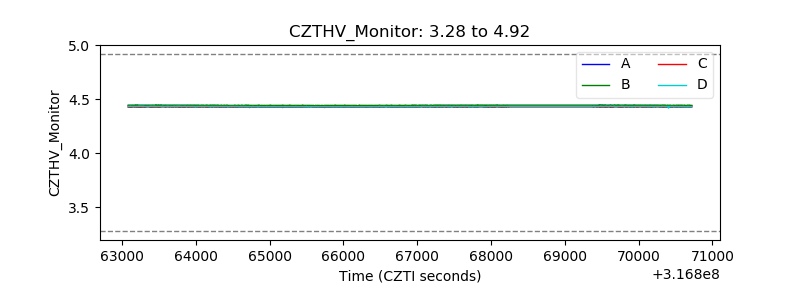 |
| D_VDD | 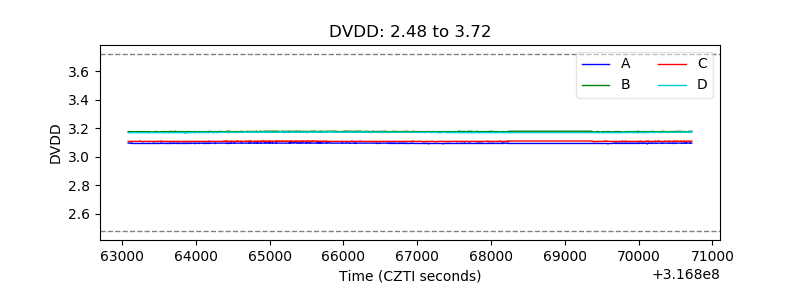 |
| Temperature 1 | 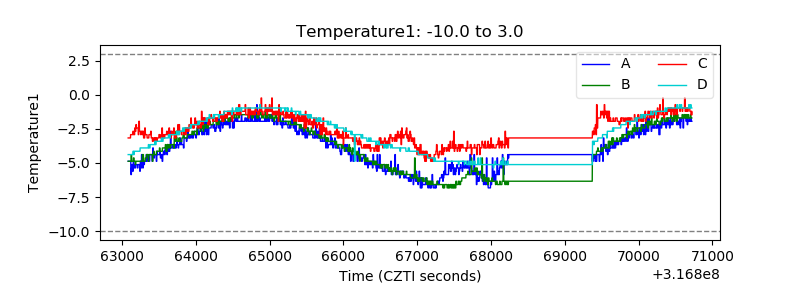 |
| Veto HV Monitor | 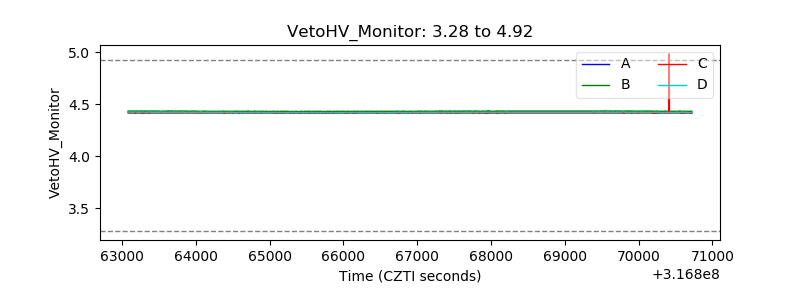 |
| Veto LLD | 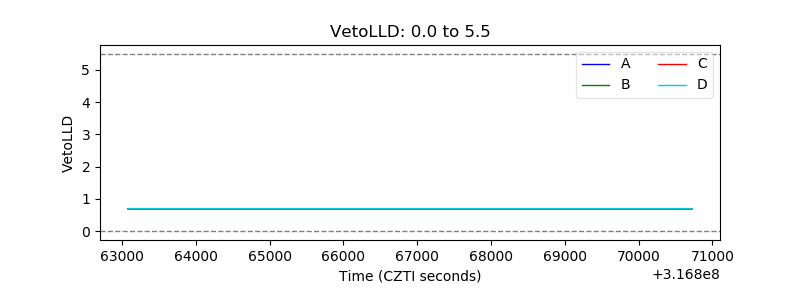 |
| Alpha Counter | 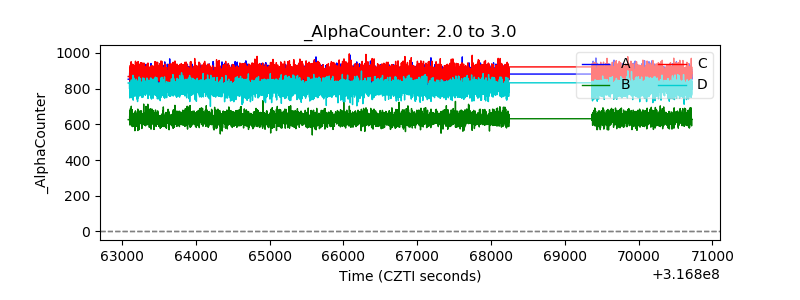 |
| _CPM_Rate | 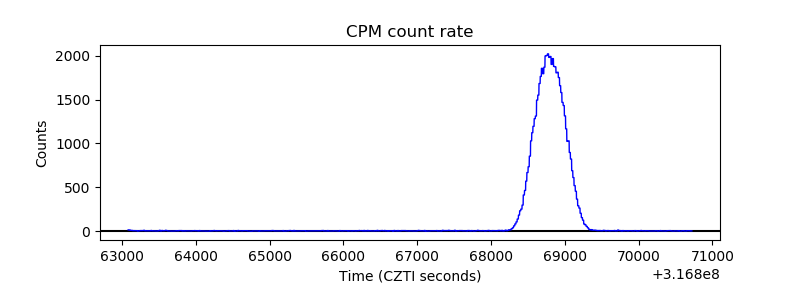 |
| CZT Counter |  |
| +2.5 Volts monitor |  |
| +5 Volts monitor |  |
| _ROLL_ROT | 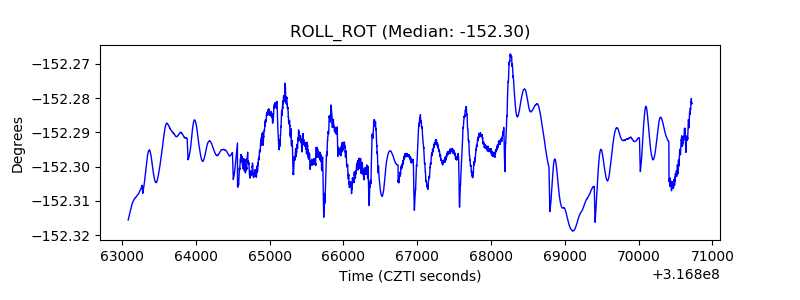 |
| _Roll_DEC | 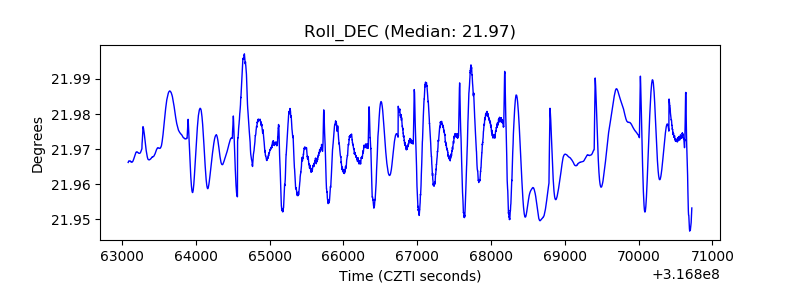 |
| _Roll_RA |  |
| Veto Counter | 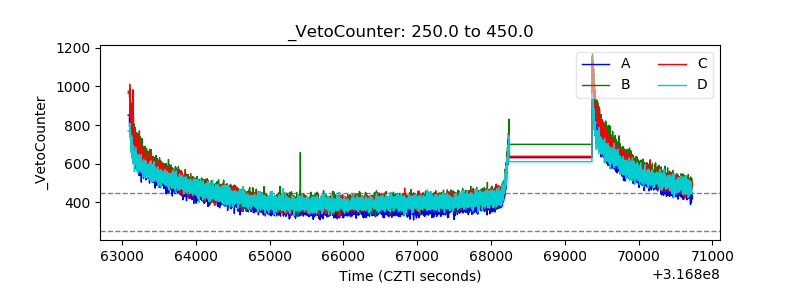 |