| Param | Original file | Final file |
|---|---|---|
| Filename | modeM0/AS1A08_004T03_9000003438_23260cztM0_level2.evt | modeM0/AS1A08_004T03_9000003438_23260cztM0_level2_quad_clean.evt |
| Size (bytes) | 483,713,280 | 107,559,360 |
| Size | 461.3 MB | 102.6 MB |
| Events in quadrant A | 3,408,161 | 723,388 |
| Events in quadrant B | 3,464,092 | 731,849 |
| Events in quadrant C | 3,615,824 | 676,178 |
| Events in quadrant D | 3,716,196 | 669,092 |
| Mode M9 | |||
|---|---|---|---|
| Quadrant | BADHDUFLAG | Total packets | Discarded packets |
| A | 0 | 15 | 0 |
| B | 0 | 16 | 0 |
| C | 0 | 16 | 0 |
| D | 0 | 16 | 0 |
| Mode M0 | |||
|---|---|---|---|
| Quadrant | BADHDUFLAG | Total packets | Discarded packets |
| A | 0 | 14150 | 2 |
| B | 0 | 14253 | 2 |
| C | 0 | 14743 | 2 |
| D | 0 | 15241 | 2 |
| Mode SS | |||
|---|---|---|---|
| Quadrant | BADHDUFLAG | Total packets | Discarded packets |
| A | 0 | 134 | 0 |
| B | 0 | 134 | 0 |
| C | 0 | 134 | 0 |
| D | 0 | 134 | 0 |
| Quadrant | Total seconds | Saturated seconds | Saturation percentage |
|---|---|---|---|
| A | 6553 | 75 | 1.144514% |
| B | 6553 | 95 | 1.449718% |
| C | 6553 | 119 | 1.815962% |
| D | 6553 | 88 | 1.342896% |
Noise dominated data is calculated using 1-second bins in cleaned event files. If a bin has >2000 counts, and if more than 50% of those come from <1% of pixels, then it is considered to be noise-dominated and hence unusable.
| Quadrant | # 1 sec bins | Bins with >0 counts | Bins with >2000 counts | High rate bins dominated by noise | Noise dominated (total time) | Noise dominated (detector-on time) | Marked lightcurve |
|---|---|---|---|---|---|---|---|
| A | 7853 | 6553 | 0 | 0 | 0.00% | 0.00% | 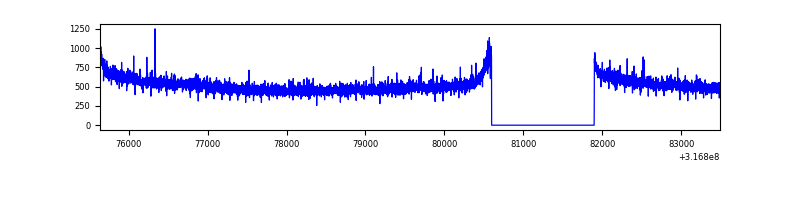 |
| B | 7853 | 6553 | 1 | 1 | 0.01% | 0.02% | 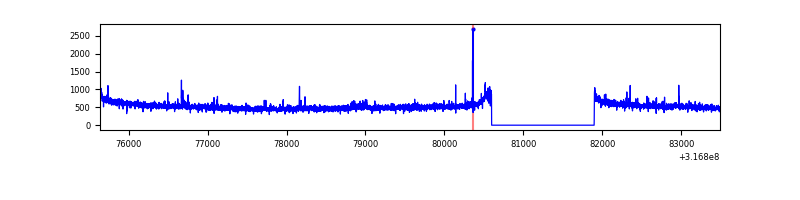 |
| C | 7853 | 6554 | 10 | 10 | 0.13% | 0.15% | 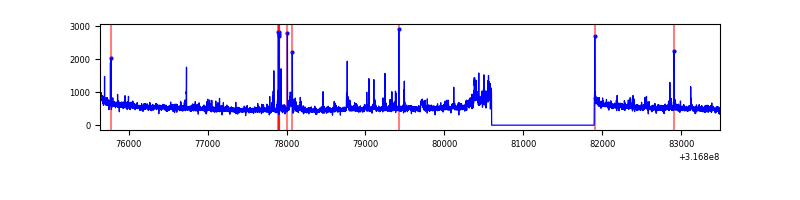 |
| D | 7853 | 6554 | 32 | 32 | 0.41% | 0.49% | 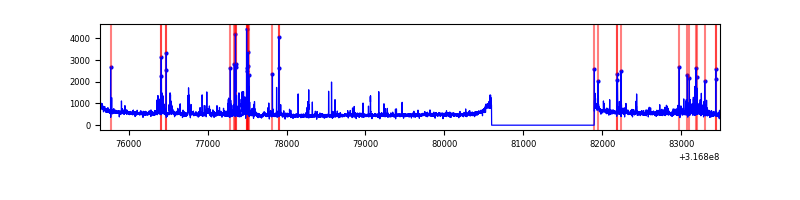 |
Top three noisy pixels from each quadrant. If the there are fewer than three noisy pixels in the level2.evt file, extra rows are filled as -1
| Pixel properties | Quadrant properties | ||||||
|---|---|---|---|---|---|---|---|
| Quadrant | DetID | PixID | Counts | Sigma | Mean | Median | Sigma |
| A | 13 | 254 | 10298 | 53.92 | 882 | 864 | 175.0 |
| A | 0 | 226 | 7733 | 39.26 | 882 | 864 | 175.0 |
| A | 3 | 137 | 7037 | 35.28 | 882 | 864 | 175.0 |
| B | 12 | 111 | 18614 | 109.45 | 873 | 855 | 162.3 |
| B | 11 | 111 | 16321 | 95.32 | 873 | 855 | 162.3 |
| B | 14 | 111 | 13835 | 80.0 | 873 | 855 | 162.3 |
| C | 10 | 9 | 175709 | 914.71 | 828 | 835 | 191.2 |
| C | 14 | 238 | 133878 | 695.91 | 828 | 835 | 191.2 |
| C | 2 | 16 | 42966 | 220.37 | 828 | 835 | 191.2 |
| D | 2 | 152 | 161938 | 777.2 | 851 | 829 | 207.3 |
| D | 12 | 233 | 132528 | 635.33 | 851 | 829 | 207.3 |
| D | 7 | 238 | 55323 | 262.88 | 851 | 829 | 207.3 |
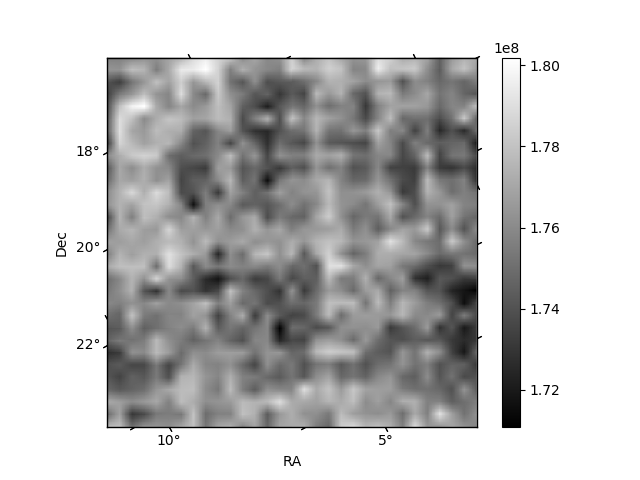
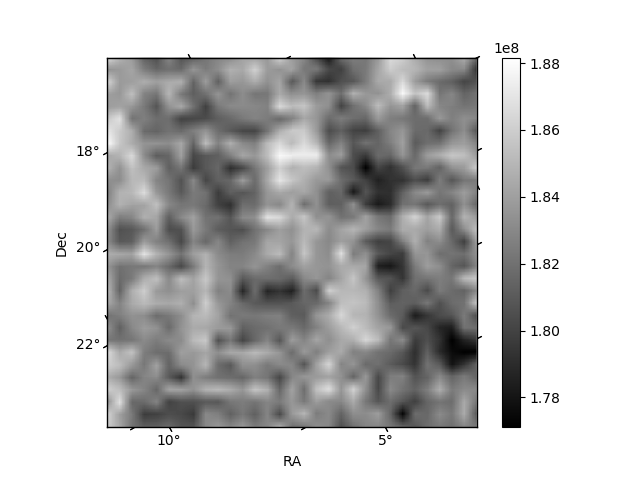
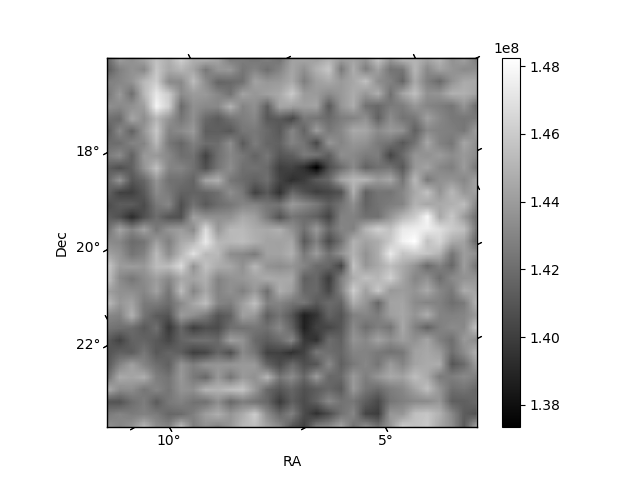
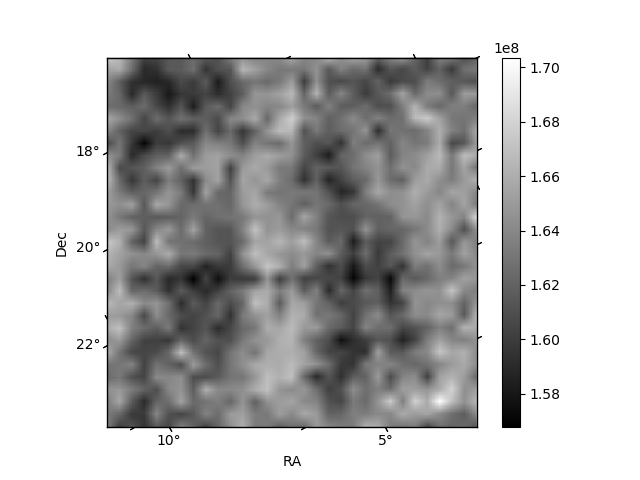
Histogram calculated using DETX and DETY for each event in the final _common_clean file
| Quadrant A | 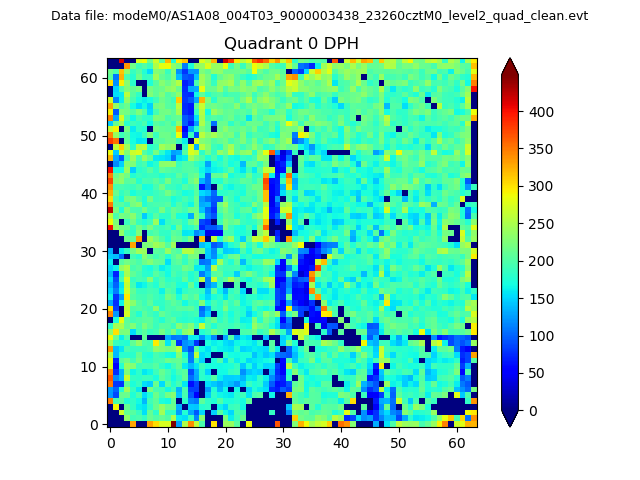 |
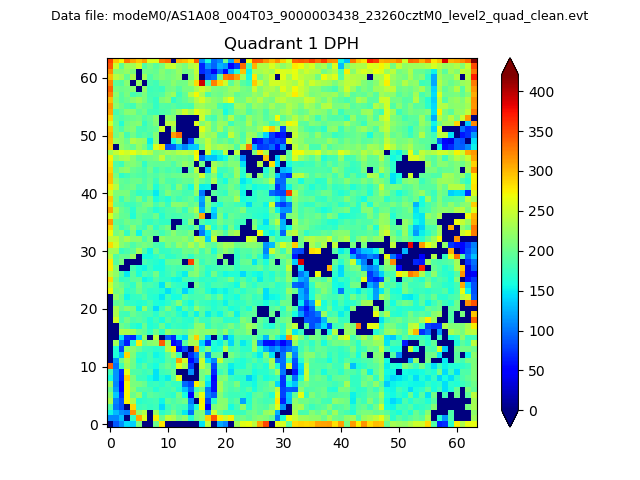 |
Quadrant B |
|---|---|---|---|
| Quadrant D | 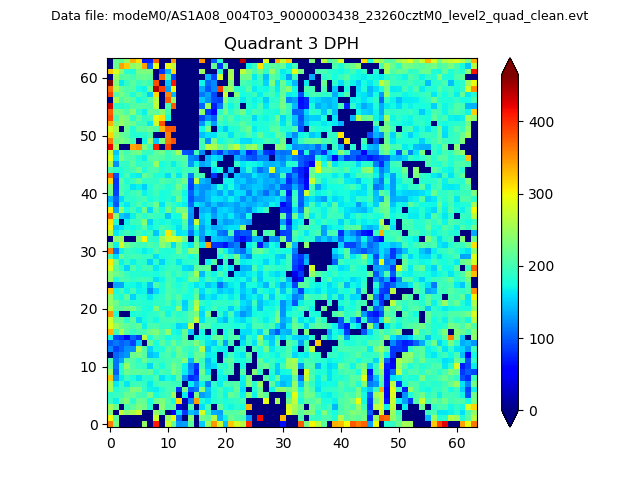 |
 |
Quadrant C |
| Plot type | Count rate plots | Images |
|---|---|---|
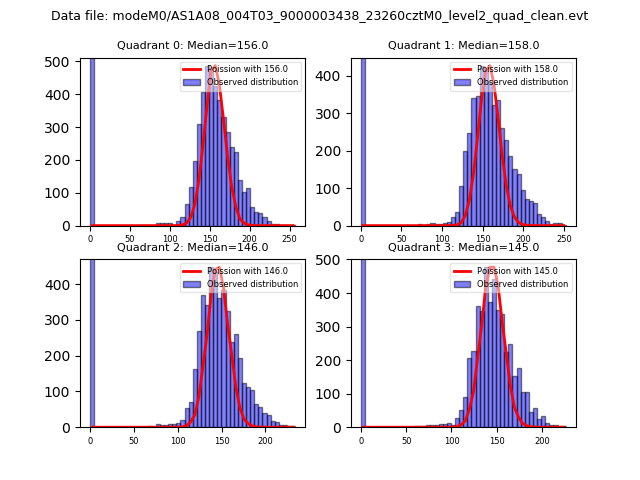
| Comparison with Poisson distribution Blue bars denote a histogram of data divided into 1 sec bins. Red curve is a Poisson curve with rate = median count rate of data. |
 |
 |
| Quadrant-wise count rates Data is divided into 100 sec bins |
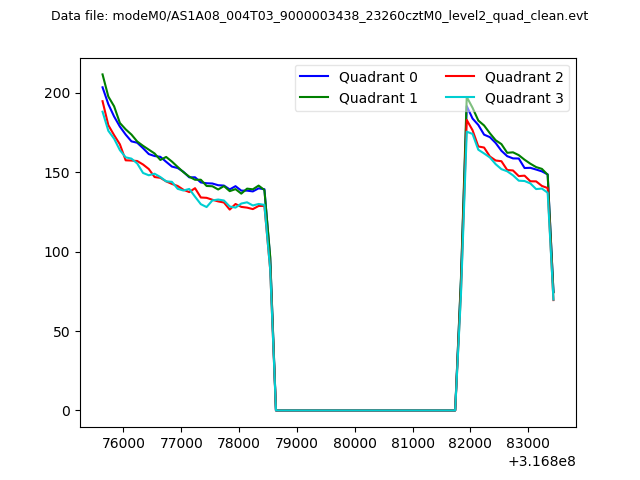 |
|
| Module-wise count rates for Quadrant A Data is divided into 100 sec bins |
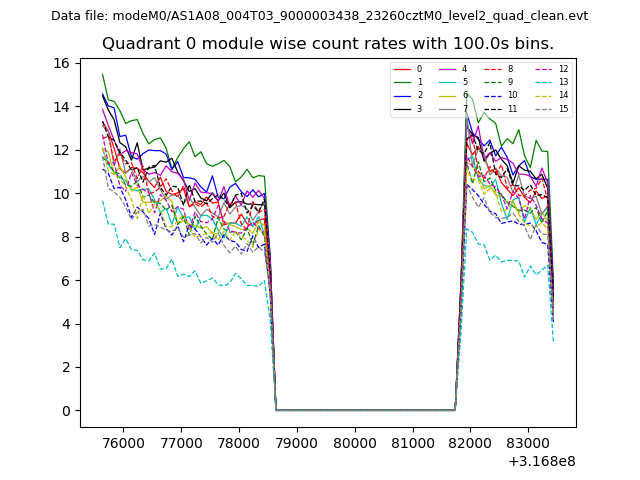 |
 |
| Module-wise count rates for Quadrant B Data is divided into 100 sec bins |
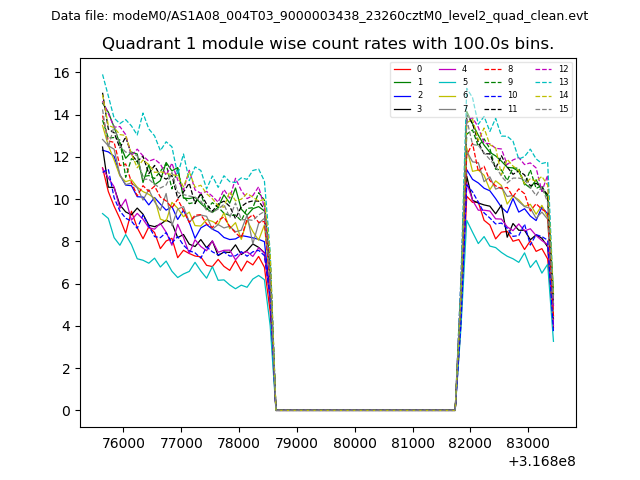 |
 |
| Module-wise count rates for Quadrant C Data is divided into 100 sec bins |
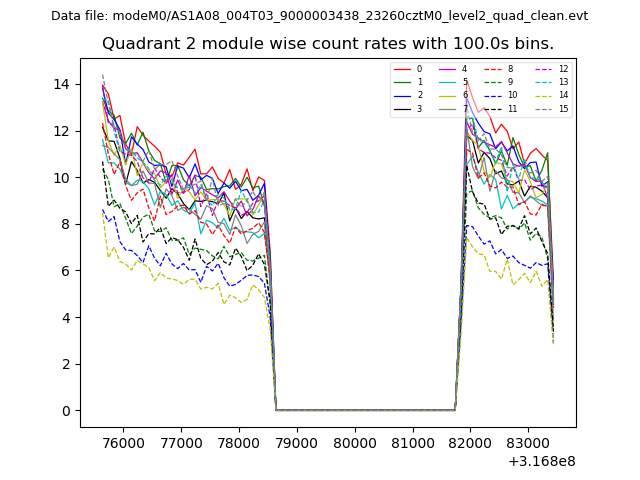 |
 |
| Module-wise count rates for Quadrant D Data is divided into 100 sec bins |
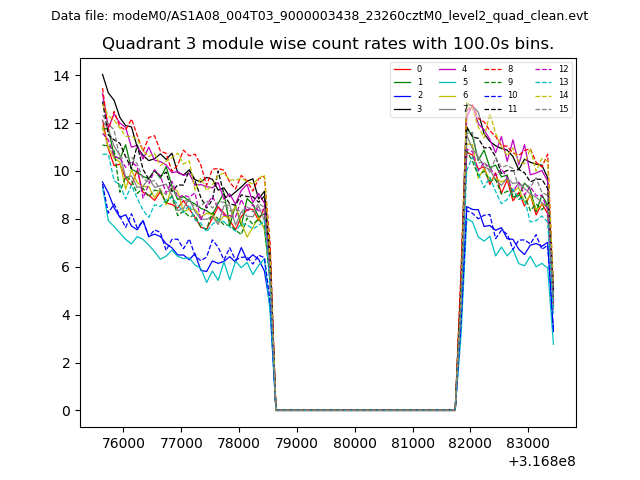 |
 |
| Parameter | Plot |
|---|---|
| CZT HV Monitor | 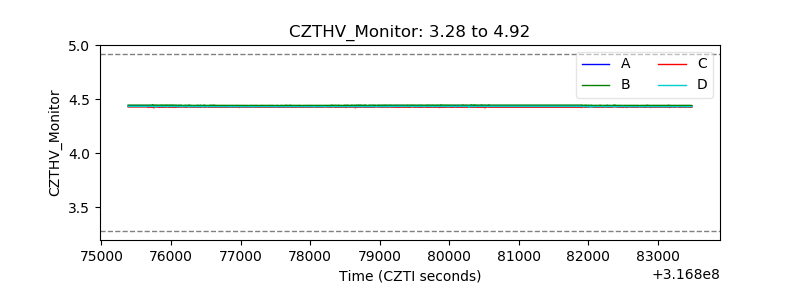 |
| D_VDD | 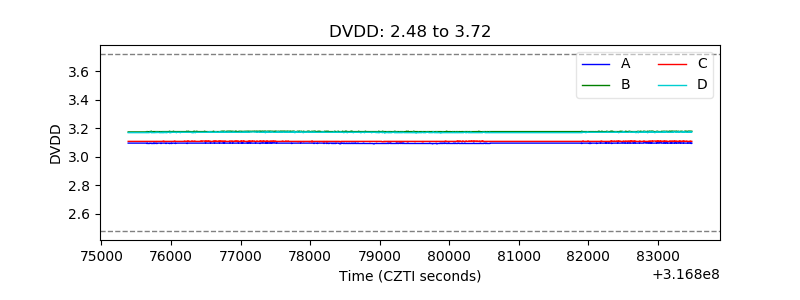 |
| Temperature 1 |  |
| Veto HV Monitor | 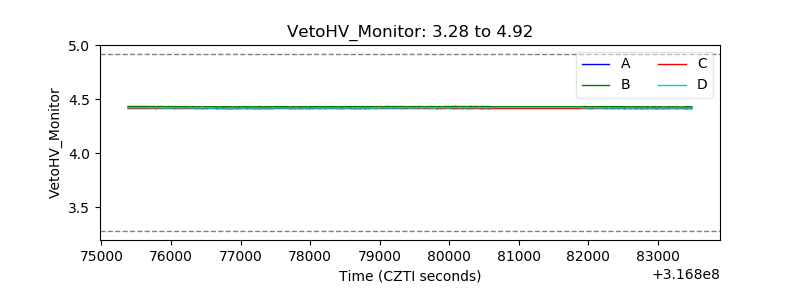 |
| Veto LLD | 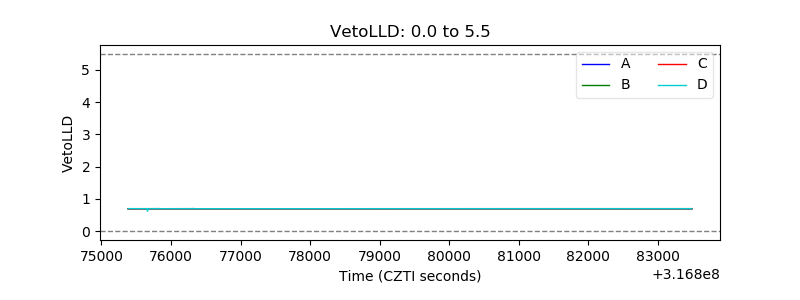 |
| Alpha Counter | 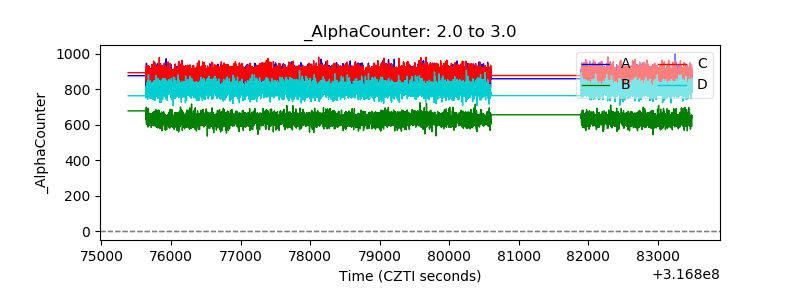 |
| _CPM_Rate | 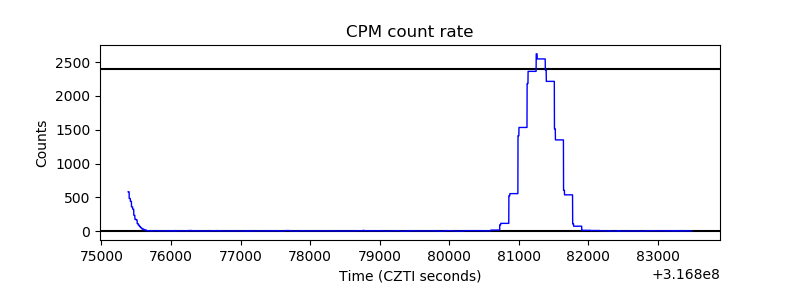 |
| CZT Counter | 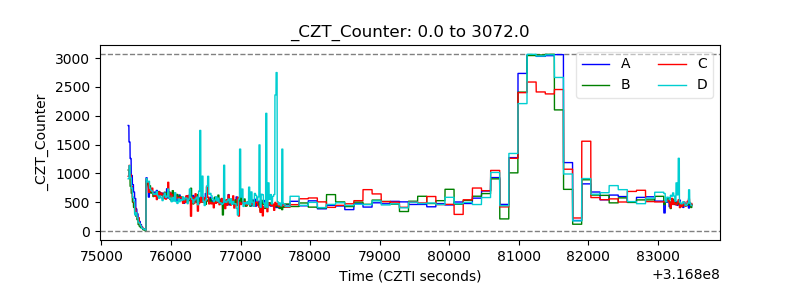 |
| +2.5 Volts monitor |  |
| +5 Volts monitor |  |
| _ROLL_ROT | 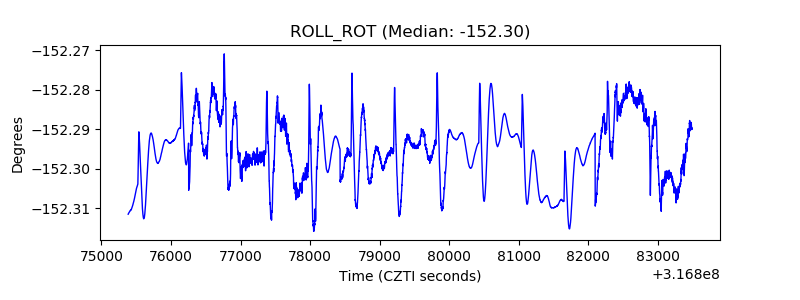 |
| _Roll_DEC | 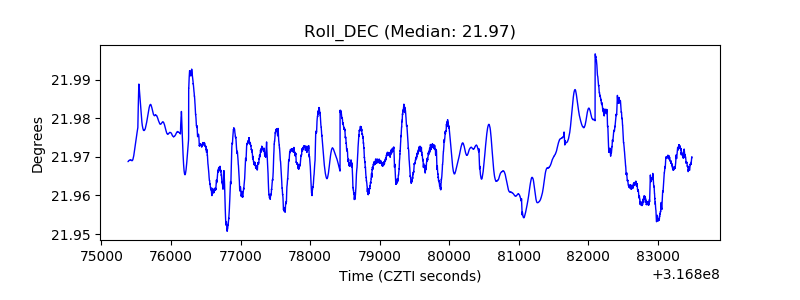 |
| _Roll_RA |  |
| Veto Counter | 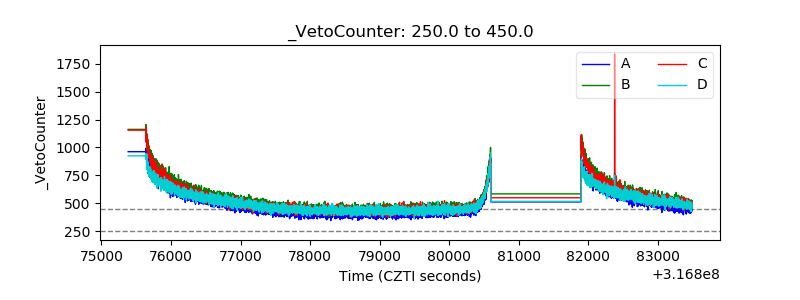 |