| Param | Original file | Final file |
|---|---|---|
| Filename | modeM0/AS1A08_004T03_9000003438_23261cztM0_level2.evt | modeM0/AS1A08_004T03_9000003438_23261cztM0_level2_quad_clean.evt |
| Size (bytes) | 493,917,120 | 98,688,960 |
| Size | 471.0 MB | 94.1 MB |
| Events in quadrant A | 3,284,099 | 653,899 |
| Events in quadrant B | 3,361,382 | 665,912 |
| Events in quadrant C | 3,372,497 | 617,787 |
| Events in quadrant D | 4,503,891 | 602,728 |
| Mode M9 | |||
|---|---|---|---|
| Quadrant | BADHDUFLAG | Total packets | Discarded packets |
| A | 0 | 17 | 0 |
| B | 0 | 18 | 0 |
| C | 0 | 18 | 0 |
| D | 0 | 18 | 0 |
| Mode M0 | |||
|---|---|---|---|
| Quadrant | BADHDUFLAG | Total packets | Discarded packets |
| A | 0 | 13686 | 2 |
| B | 0 | 13826 | 2 |
| C | 0 | 13858 | 3 |
| D | 0 | 17646 | 2 |
| Mode SS | |||
|---|---|---|---|
| Quadrant | BADHDUFLAG | Total packets | Discarded packets |
| A | 0 | 130 | 0 |
| B | 0 | 130 | 0 |
| C | 0 | 130 | 0 |
| D | 0 | 130 | 0 |
| Quadrant | Total seconds | Saturated seconds | Saturation percentage |
|---|---|---|---|
| A | 6431 | 54 | 0.839683% |
| B | 6431 | 62 | 0.964080% |
| C | 6430 | 83 | 1.290824% |
| D | 6430 | 421 | 6.547434% |
Noise dominated data is calculated using 1-second bins in cleaned event files. If a bin has >2000 counts, and if more than 50% of those come from <1% of pixels, then it is considered to be noise-dominated and hence unusable.
| Quadrant | # 1 sec bins | Bins with >0 counts | Bins with >2000 counts | High rate bins dominated by noise | Noise dominated (total time) | Noise dominated (detector-on time) | Marked lightcurve |
|---|---|---|---|---|---|---|---|
| A | 7766 | 6432 | 0 | 0 | 0.00% | 0.00% | 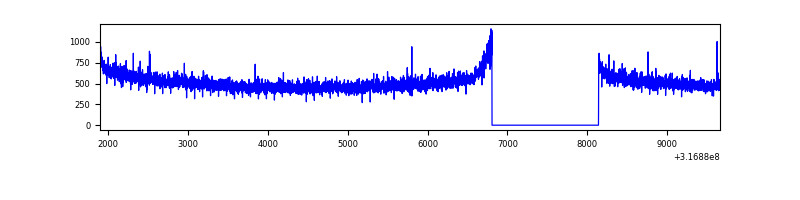 |
| B | 7766 | 6432 | 1 | 1 | 0.01% | 0.02% | 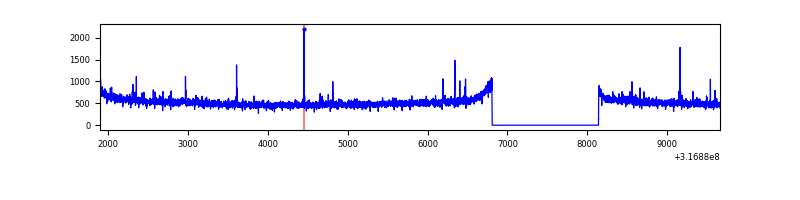 |
| C | 7765 | 6431 | 4 | 4 | 0.05% | 0.06% | 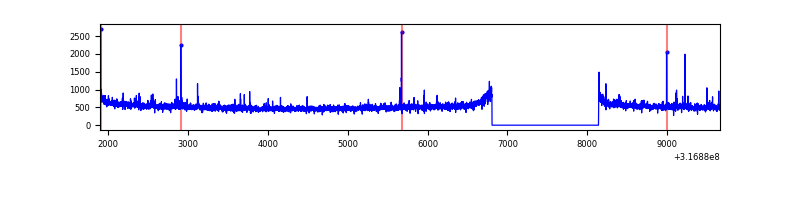 |
| D | 7765 | 6431 | 355 | 355 | 4.57% | 5.52% | 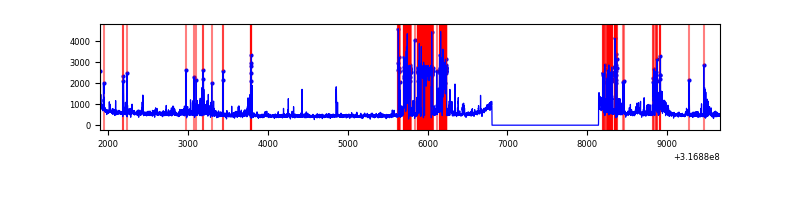 |
Top three noisy pixels from each quadrant. If the there are fewer than three noisy pixels in the level2.evt file, extra rows are filled as -1
| Pixel properties | Quadrant properties | ||||||
|---|---|---|---|---|---|---|---|
| Quadrant | DetID | PixID | Counts | Sigma | Mean | Median | Sigma |
| A | 13 | 254 | 10859 | 58.76 | 851 | 834 | 170.6 |
| A | 0 | 226 | 7360 | 38.25 | 851 | 834 | 170.6 |
| A | 3 | 137 | 7032 | 36.33 | 851 | 834 | 170.6 |
| B | 12 | 111 | 18057 | 109.66 | 848 | 831 | 157.1 |
| B | 0 | 228 | 17698 | 107.38 | 848 | 831 | 157.1 |
| B | 11 | 111 | 15944 | 96.21 | 848 | 831 | 157.1 |
| C | 14 | 238 | 129455 | 692.54 | 807 | 817 | 185.7 |
| C | 2 | 16 | 51841 | 274.69 | 807 | 817 | 185.7 |
| C | 10 | 9 | 20776 | 107.45 | 807 | 817 | 185.7 |
| D | 1 | 239 | 874661 | 4511.96 | 794 | 773 | 193.7 |
| D | 2 | 152 | 147699 | 758.59 | 794 | 773 | 193.7 |
| D | 2 | 120 | 126286 | 648.04 | 794 | 773 | 193.7 |
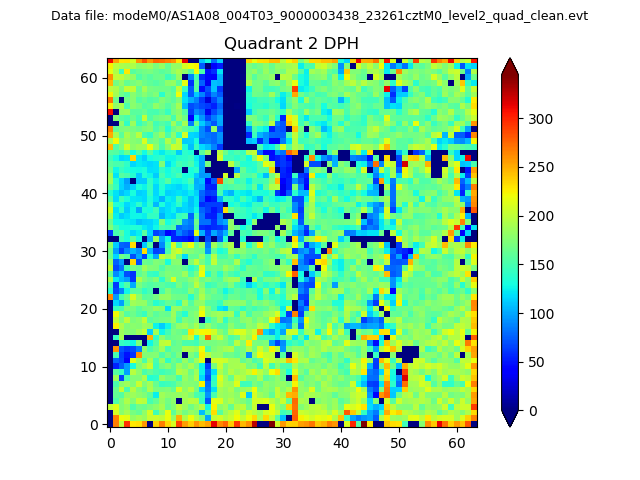
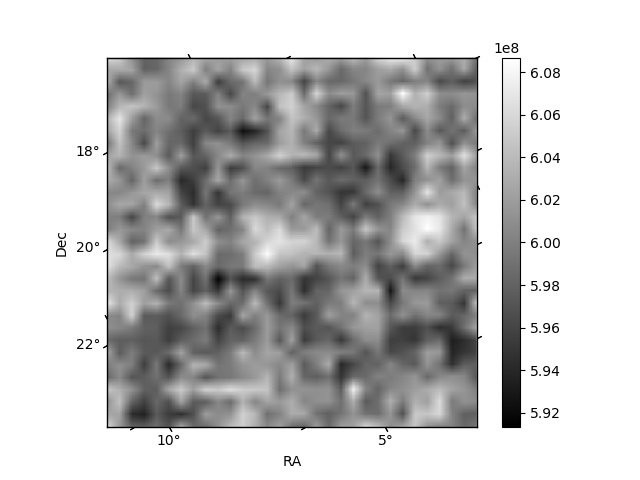
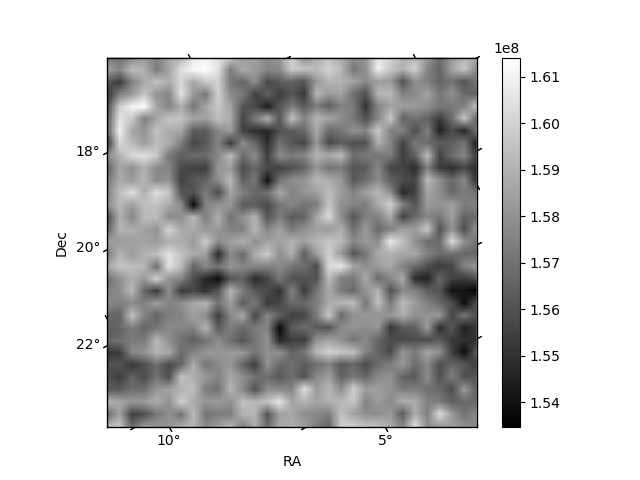
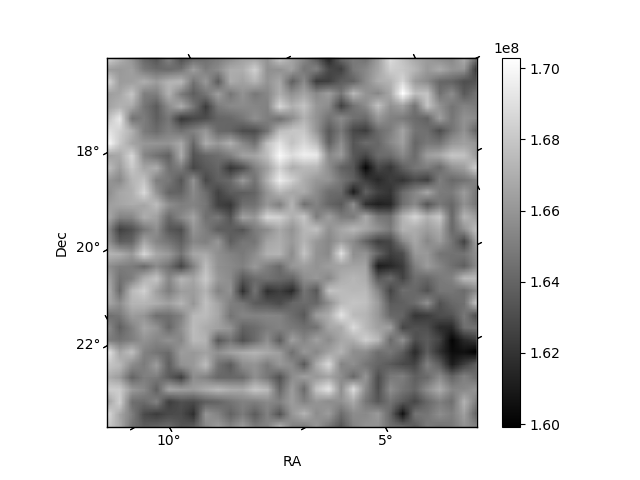
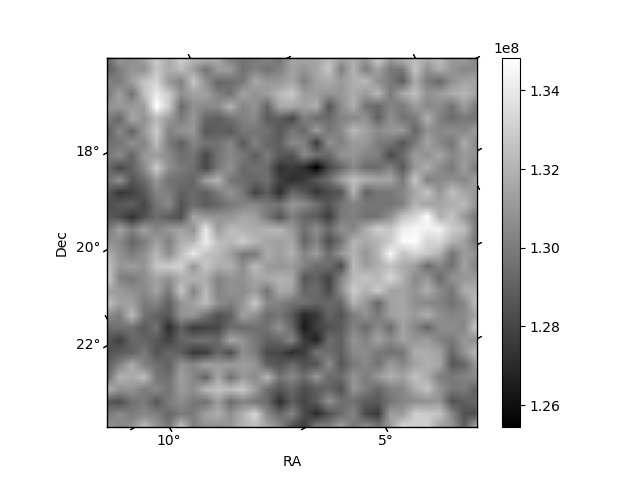
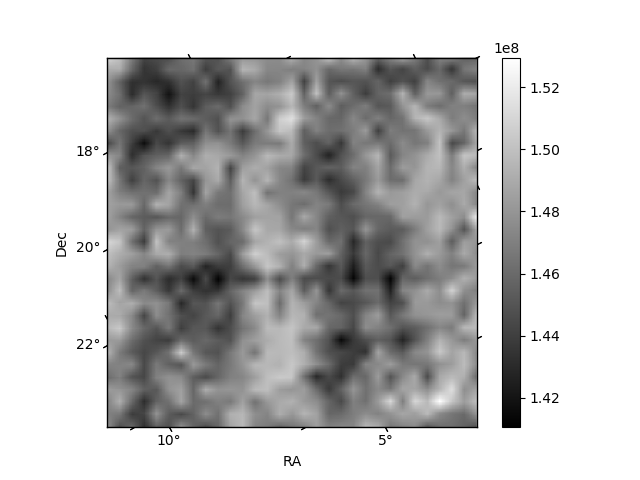
Histogram calculated using DETX and DETY for each event in the final _common_clean file
| Quadrant A | 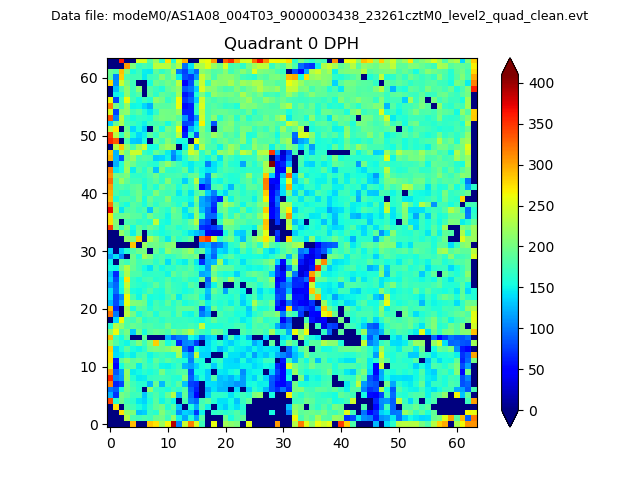 |
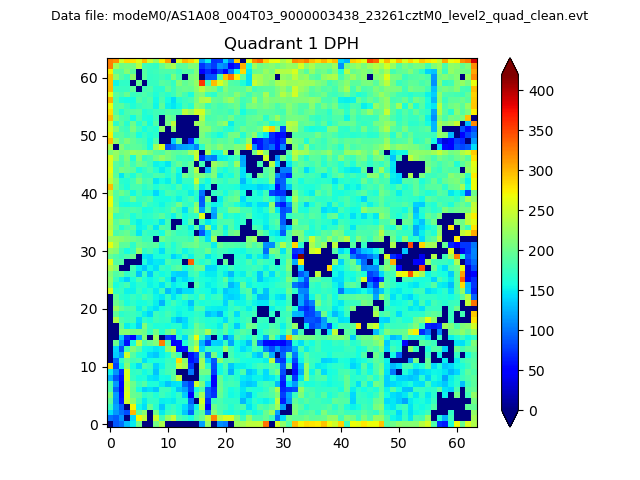 |
Quadrant B |
|---|---|---|---|
| Quadrant D | 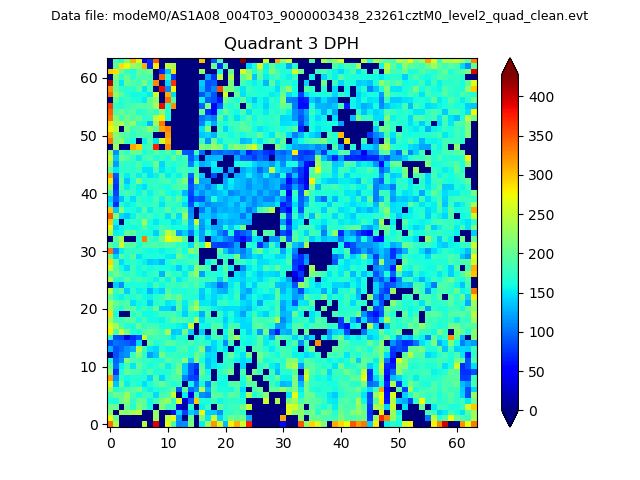 |
 |
Quadrant C |
| Plot type | Count rate plots | Images |
|---|---|---|
| Comparison with Poisson distribution Blue bars denote a histogram of data divided into 1 sec bins. Red curve is a Poisson curve with rate = median count rate of data. |
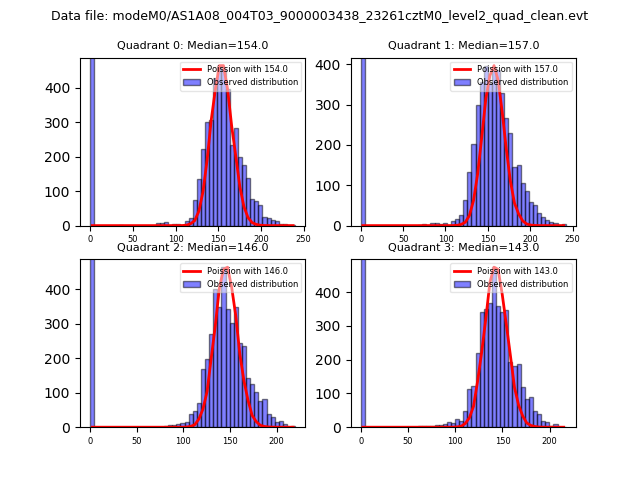 |
 |
| Quadrant-wise count rates Data is divided into 100 sec bins |
 |
|
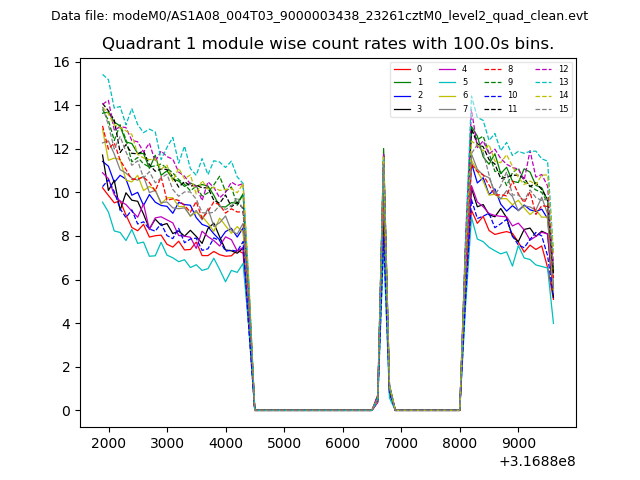
| Module-wise count rates for Quadrant A Data is divided into 100 sec bins |
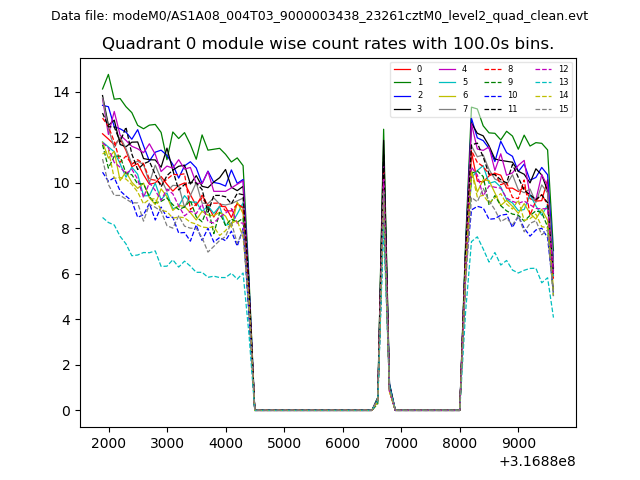 |
 |
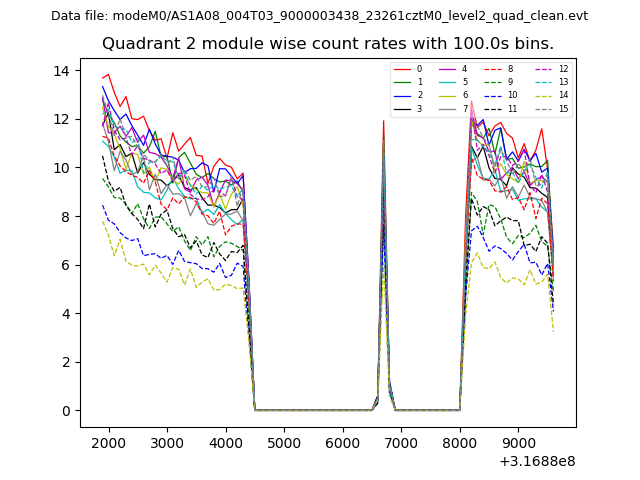
| Module-wise count rates for Quadrant B Data is divided into 100 sec bins |
 |
 |
| Module-wise count rates for Quadrant C Data is divided into 100 sec bins |
 |
 |
| Module-wise count rates for Quadrant D Data is divided into 100 sec bins |
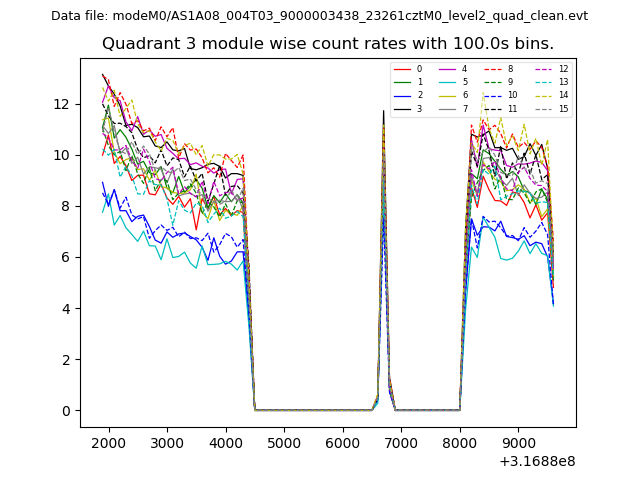 |
 |
| Parameter | Plot |
|---|---|
| CZT HV Monitor | 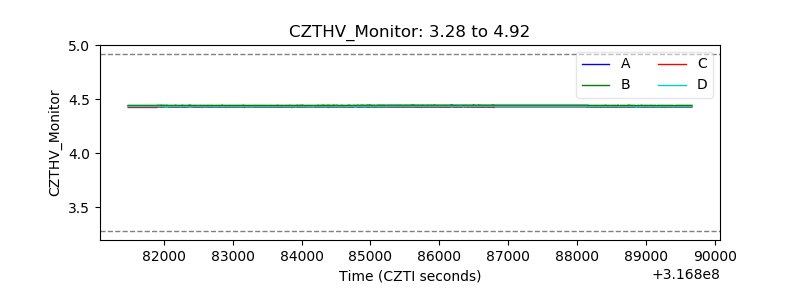 |
| D_VDD | 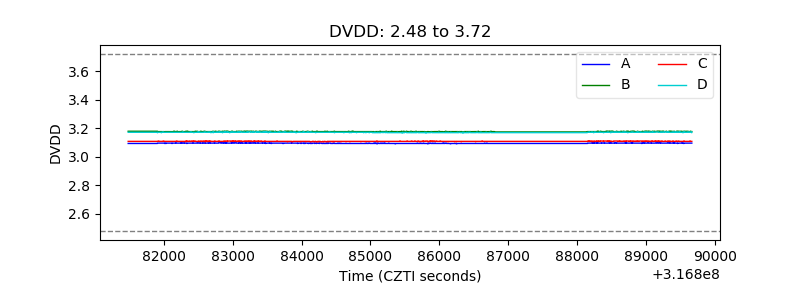 |
| Temperature 1 | 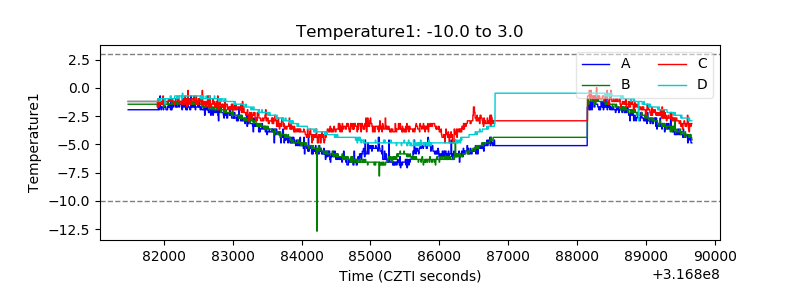 |
| Veto HV Monitor | 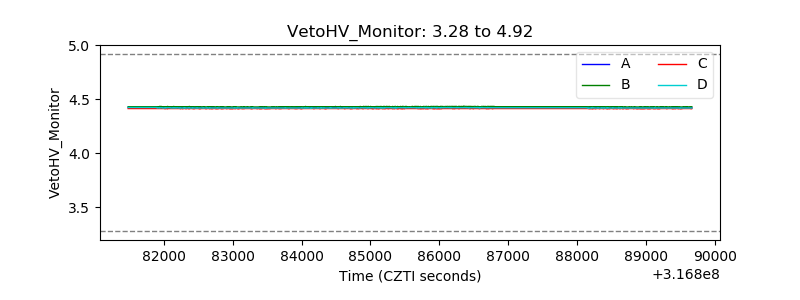 |
| Veto LLD |  |
| Alpha Counter | 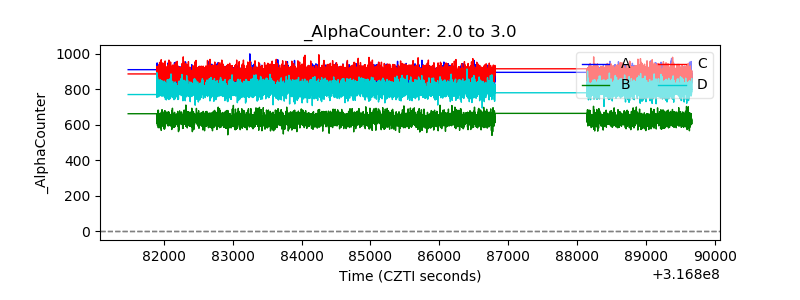 |
| _CPM_Rate | 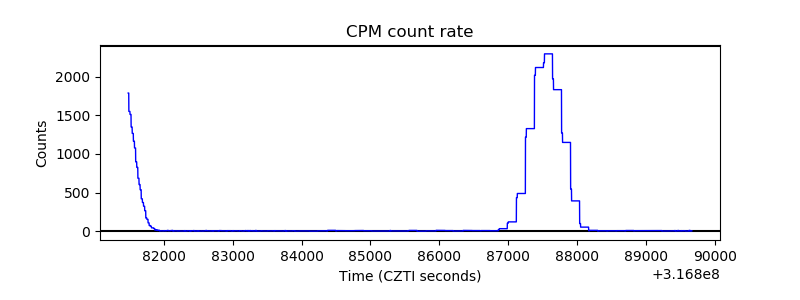 |
| CZT Counter |  |
| +2.5 Volts monitor |  |
| +5 Volts monitor |  |
| _ROLL_ROT | 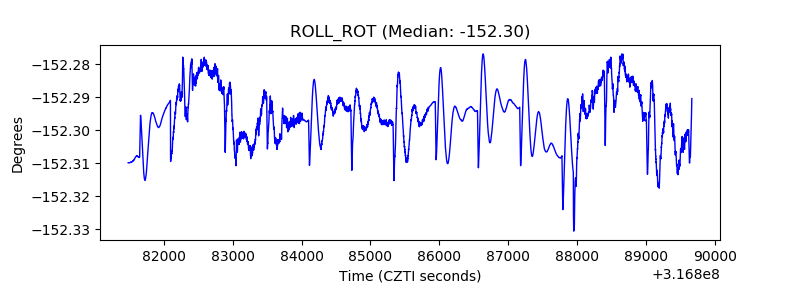 |
| _Roll_DEC | 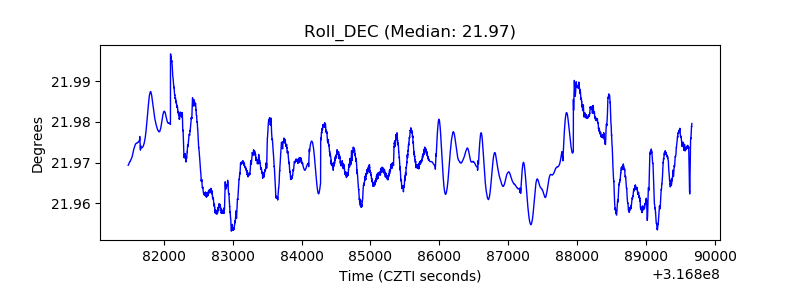 |
| _Roll_RA | 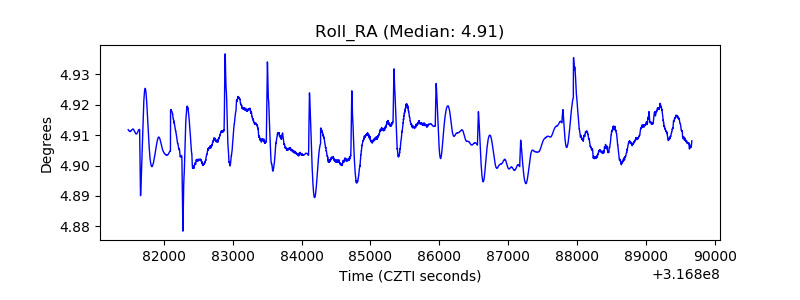 |
| Veto Counter | 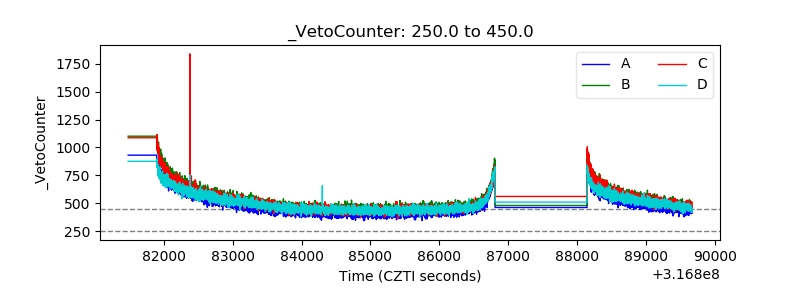 |