| Param | Original file | Final file |
|---|---|---|
| Filename | modeM0/AS1A08_004T03_9000003438_23264cztM0_level2.evt | modeM0/AS1A08_004T03_9000003438_23264cztM0_level2_quad_clean.evt |
| Size (bytes) | 837,092,160 | 147,723,840 |
| Size | 798.3 MB | 140.9 MB |
| Events in quadrant A | 5,638,348 | 928,918 |
| Events in quadrant B | 5,830,540 | 943,707 |
| Events in quadrant C | 5,864,833 | 897,913 |
| Events in quadrant D | 7,201,452 | 869,588 |
| Mode M9 | |||
|---|---|---|---|
| Quadrant | BADHDUFLAG | Total packets | Discarded packets |
| A | 0 | 16 | 0 |
| B | 0 | 16 | 0 |
| C | 0 | 16 | 0 |
| D | 0 | 16 | 0 |
| Mode M0 | |||
|---|---|---|---|
| Quadrant | BADHDUFLAG | Total packets | Discarded packets |
| A | 0 | 24615 | 2 |
| B | 0 | 24855 | 2 |
| C | 0 | 24911 | 2 |
| D | 0 | 29348 | 2 |
| Mode SS | |||
|---|---|---|---|
| Quadrant | BADHDUFLAG | Total packets | Discarded packets |
| A | 0 | 246 | 0 |
| B | 0 | 246 | 0 |
| C | 0 | 246 | 0 |
| D | 0 | 246 | 0 |
| Quadrant | Total seconds | Saturated seconds | Saturation percentage |
|---|---|---|---|
| A | 12053 | 35 | 0.290384% |
| B | 12054 | 52 | 0.431392% |
| C | 12054 | 106 | 0.879376% |
| D | 12054 | 222 | 1.841712% |
Noise dominated data is calculated using 1-second bins in cleaned event files. If a bin has >2000 counts, and if more than 50% of those come from <1% of pixels, then it is considered to be noise-dominated and hence unusable.
| Quadrant | # 1 sec bins | Bins with >0 counts | Bins with >2000 counts | High rate bins dominated by noise | Noise dominated (total time) | Noise dominated (detector-on time) | Marked lightcurve |
|---|---|---|---|---|---|---|---|
| A | 13703 | 12055 | 0 | 0 | 0.00% | 0.00% | 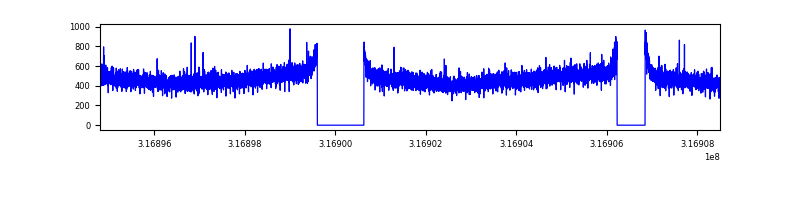 |
| B | 13704 | 12056 | 5 | 5 | 0.04% | 0.04% |  |
| C | 13704 | 12056 | 4 | 4 | 0.03% | 0.03% | 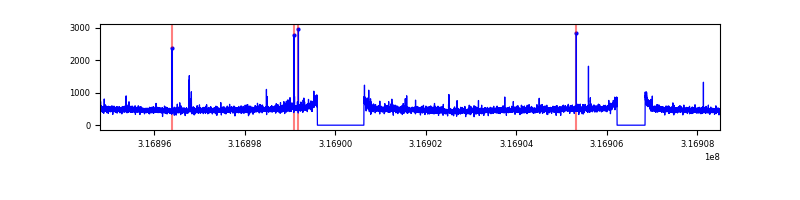 |
| D | 13704 | 12056 | 156 | 156 | 1.14% | 1.29% | 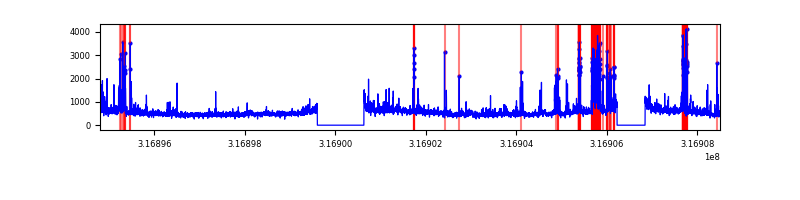 |
Top three noisy pixels from each quadrant. If the there are fewer than three noisy pixels in the level2.evt file, extra rows are filled as -1
| Pixel properties | Quadrant properties | ||||||
|---|---|---|---|---|---|---|---|
| Quadrant | DetID | PixID | Counts | Sigma | Mean | Median | Sigma |
| A | 13 | 254 | 19552 | 61.96 | 1462 | 1432 | 292.5 |
| A | 3 | 137 | 12934 | 39.33 | 1462 | 1432 | 292.5 |
| A | 0 | 226 | 12514 | 37.89 | 1462 | 1432 | 292.5 |
| B | 12 | 111 | 33949 | 116.59 | 1465 | 1428 | 278.9 |
| B | 11 | 111 | 30119 | 102.86 | 1465 | 1428 | 278.9 |
| B | 0 | 230 | 26599 | 90.24 | 1465 | 1428 | 278.9 |
| C | 14 | 238 | 221389 | 669.87 | 1409 | 1421 | 328.4 |
| C | 0 | 207 | 94231 | 282.63 | 1409 | 1421 | 328.4 |
| C | 2 | 16 | 43333 | 127.63 | 1409 | 1421 | 328.4 |
| D | 7 | 238 | 778562 | 2250.7 | 1423 | 1382 | 345.3 |
| D | 1 | 52 | 624496 | 1804.53 | 1423 | 1382 | 345.3 |
| D | 1 | 239 | 185869 | 534.27 | 1423 | 1382 | 345.3 |
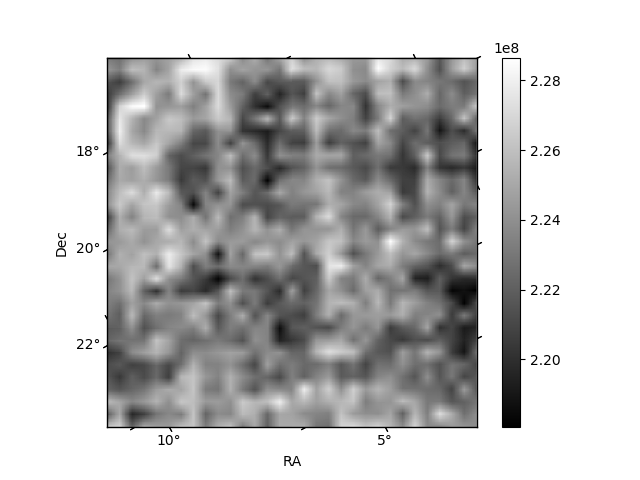
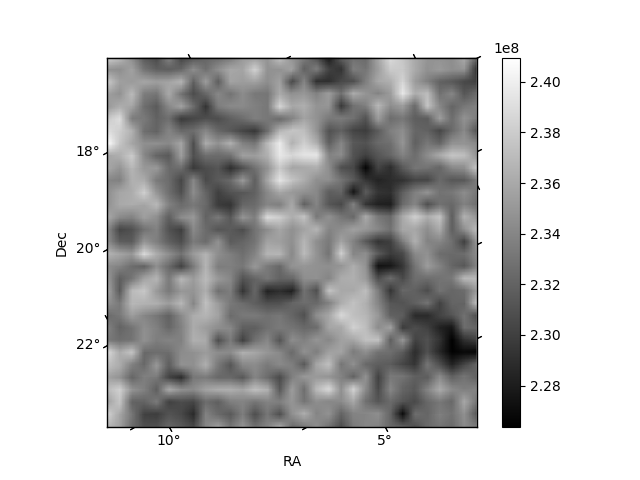
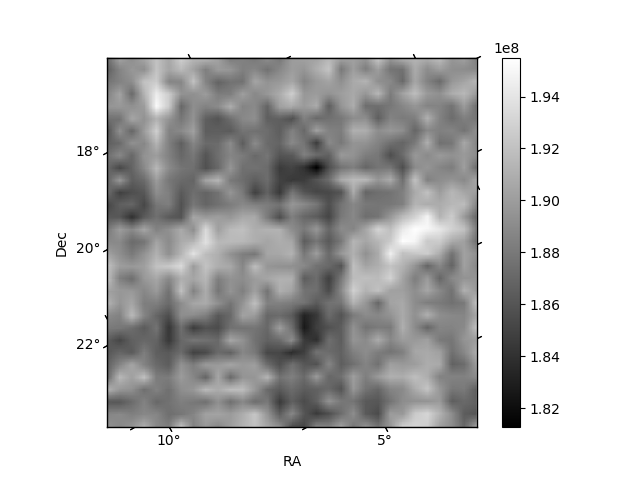
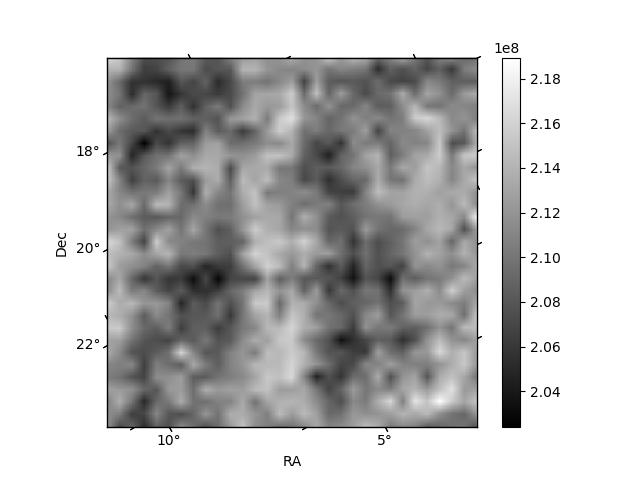
Histogram calculated using DETX and DETY for each event in the final _common_clean file
| Quadrant A |  |
 |
Quadrant B |
|---|---|---|---|
| Quadrant D | 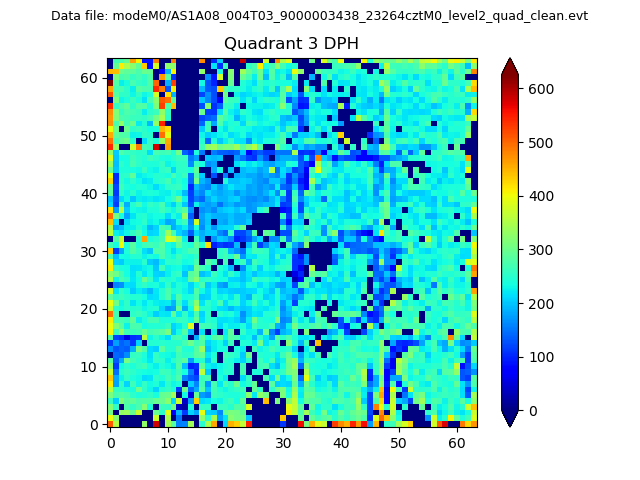 |
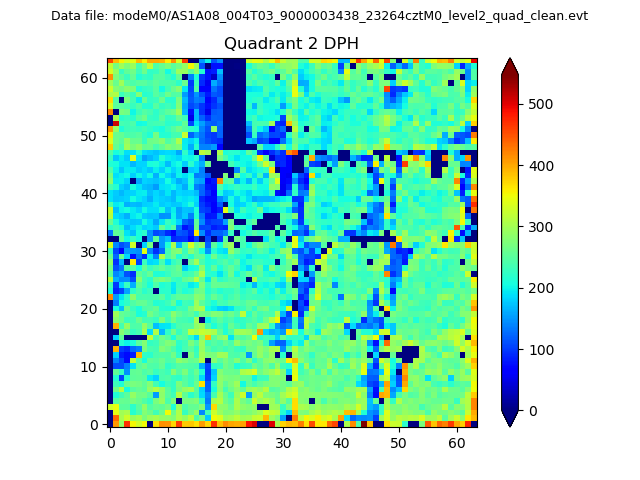 |
Quadrant C |
| Plot type | Count rate plots | Images |
|---|---|---|
| Comparison with Poisson distribution Blue bars denote a histogram of data divided into 1 sec bins. Red curve is a Poisson curve with rate = median count rate of data. |
 |
 |
| Quadrant-wise count rates Data is divided into 100 sec bins |
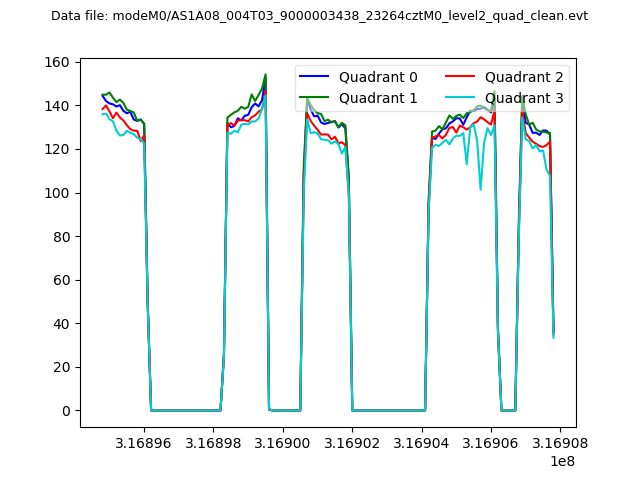 |
|
| Module-wise count rates for Quadrant A Data is divided into 100 sec bins |
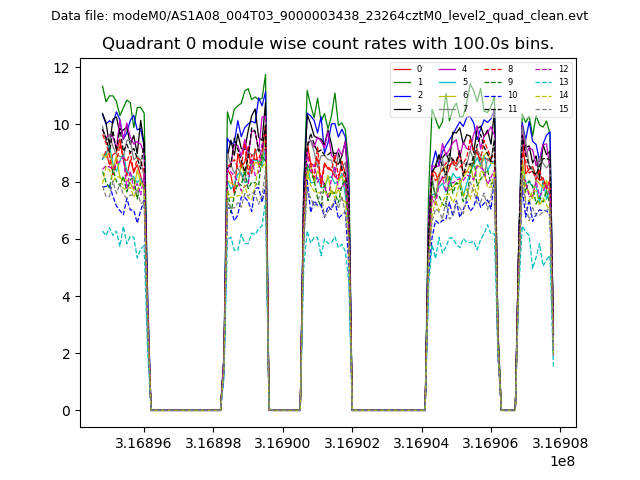 |
 |
| Module-wise count rates for Quadrant B Data is divided into 100 sec bins |
 |
 |
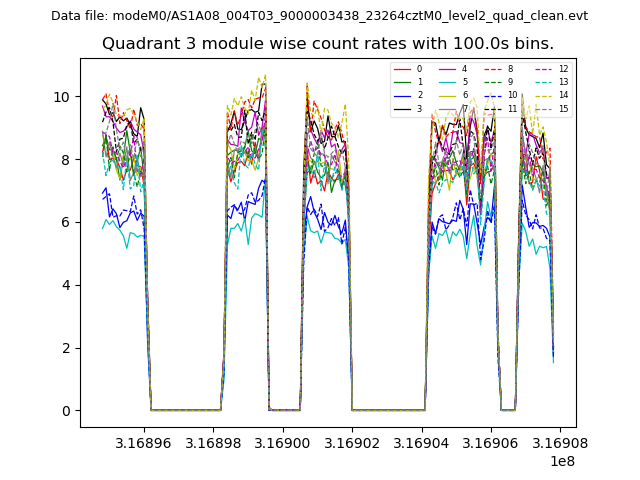
| Module-wise count rates for Quadrant C Data is divided into 100 sec bins |
 |
 |
| Module-wise count rates for Quadrant D Data is divided into 100 sec bins |
 |
 |
| Parameter | Plot |
|---|---|
| CZT HV Monitor |  |
| D_VDD | 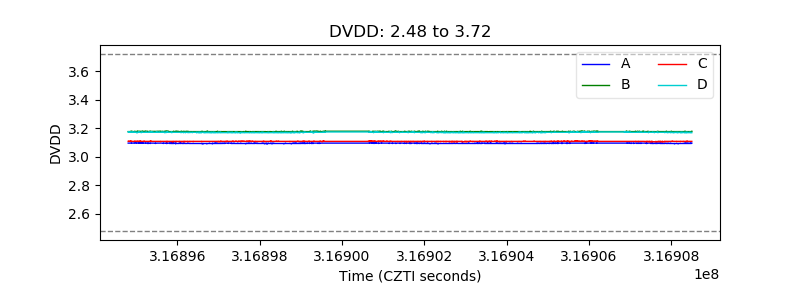 |
| Temperature 1 | 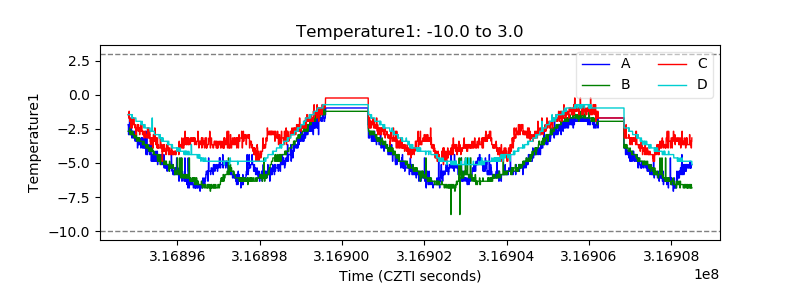 |
| Veto HV Monitor | 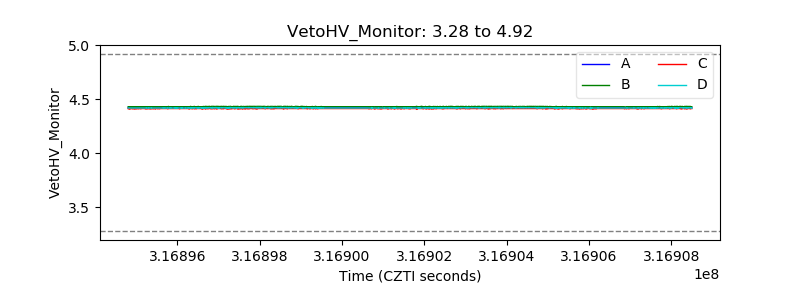 |
| Veto LLD | 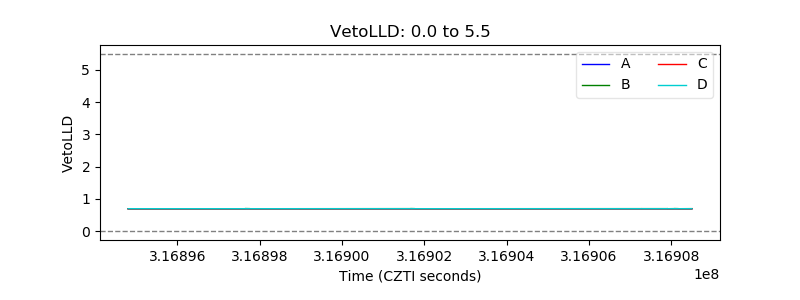 |
| Alpha Counter | 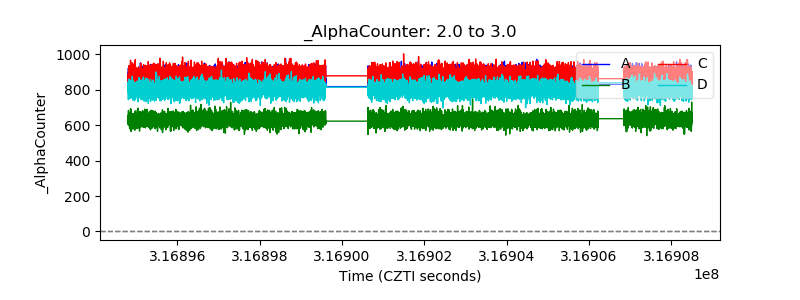 |
| _CPM_Rate | 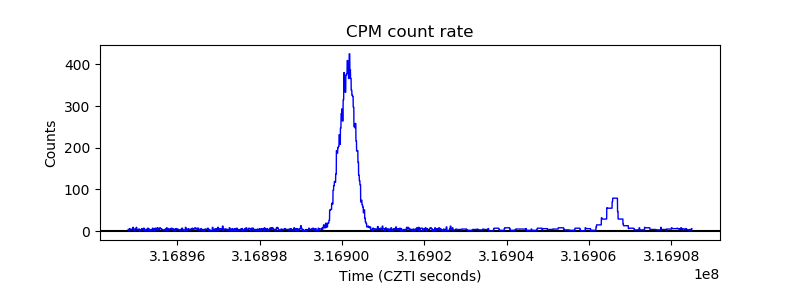 |
| CZT Counter | 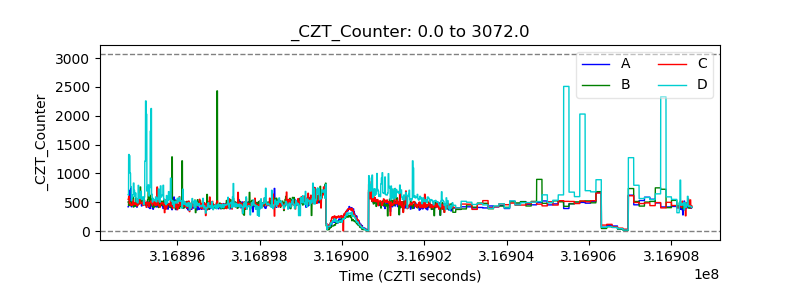 |
| +2.5 Volts monitor |  |
| +5 Volts monitor |  |
| _ROLL_ROT | 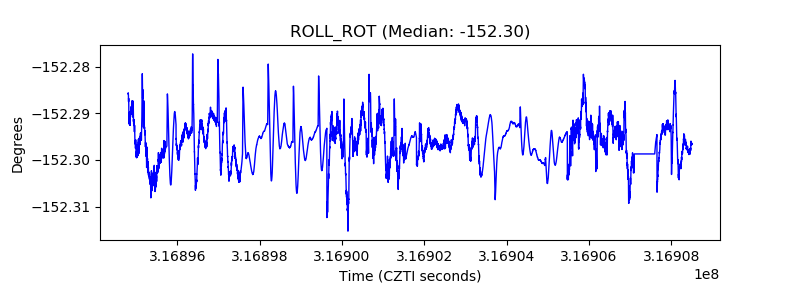 |
| _Roll_DEC | 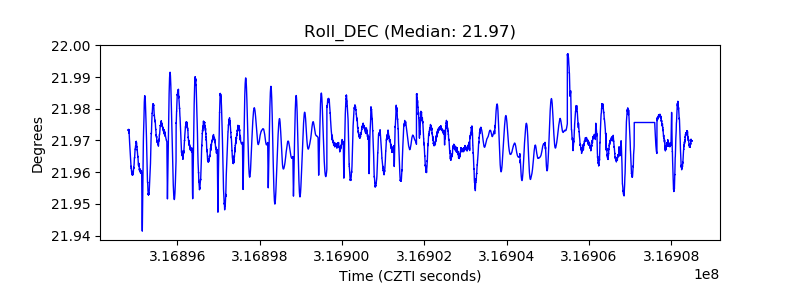 |
| _Roll_RA | 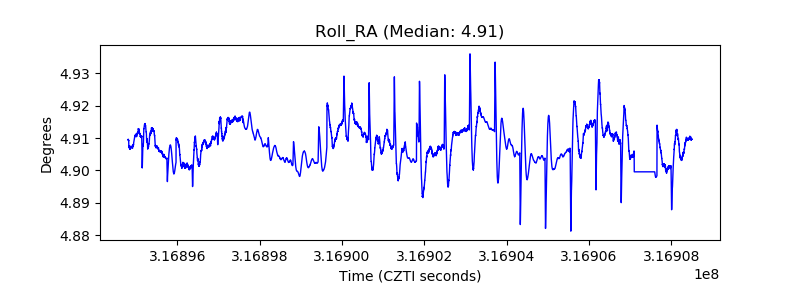 |
| Veto Counter | 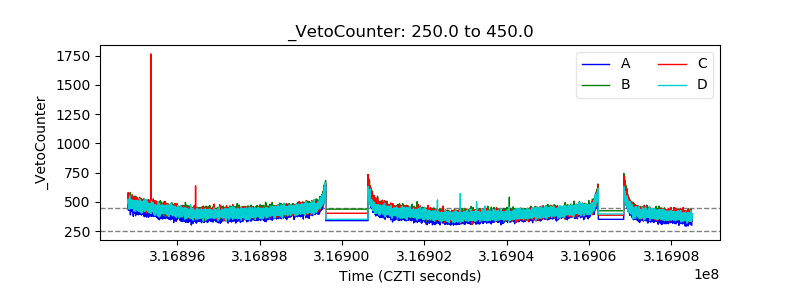 |