| Param | Original file | Final file |
|---|---|---|
| Filename | modeM0/AS1A08_004T03_9000003438_23269cztM0_level2.evt | modeM0/AS1A08_004T03_9000003438_23269cztM0_level2_quad_clean.evt |
| Size (bytes) | 1,279,235,520 | 221,765,760 |
| Size | 1.2 GB | 211.5 MB |
| Events in quadrant A | 8,529,427 | 1,398,222 |
| Events in quadrant B | 8,813,917 | 1,417,862 |
| Events in quadrant C | 10,519,398 | 1,305,719 |
| Events in quadrant D | 9,645,447 | 1,337,608 |
| Mode M9 | |||
|---|---|---|---|
| Quadrant | BADHDUFLAG | Total packets | Discarded packets |
| A | 0 | 20 | 0 |
| B | 0 | 20 | 0 |
| C | 0 | 20 | 0 |
| D | 0 | 20 | 0 |
| Mode M0 | |||
|---|---|---|---|
| Quadrant | BADHDUFLAG | Total packets | Discarded packets |
| A | 0 | 37186 | 3 |
| B | 0 | 37668 | 3 |
| C | 0 | 42523 | 3 |
| D | 0 | 40855 | 4 |
| Mode SS | |||
|---|---|---|---|
| Quadrant | BADHDUFLAG | Total packets | Discarded packets |
| A | 0 | 368 | 0 |
| B | 0 | 368 | 0 |
| C | 0 | 368 | 0 |
| D | 0 | 368 | 0 |
| Quadrant | Total seconds | Saturated seconds | Saturation percentage |
|---|---|---|---|
| A | 18249 | 197 | 1.079511% |
| B | 18250 | 241 | 1.320548% |
| C | 18250 | 946 | 5.183562% |
| D | 18249 | 214 | 1.172667% |
Noise dominated data is calculated using 1-second bins in cleaned event files. If a bin has >2000 counts, and if more than 50% of those come from <1% of pixels, then it is considered to be noise-dominated and hence unusable.
| Quadrant | # 1 sec bins | Bins with >0 counts | Bins with >2000 counts | High rate bins dominated by noise | Noise dominated (total time) | Noise dominated (detector-on time) | Marked lightcurve |
|---|---|---|---|---|---|---|---|
| A | 20129 | 18250 | 0 | 0 | 0.00% | 0.00% | 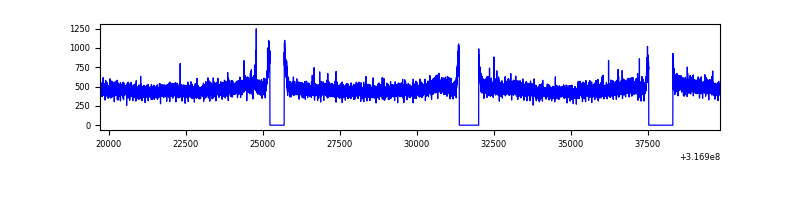 |
| B | 20130 | 18250 | 7 | 7 | 0.03% | 0.04% | 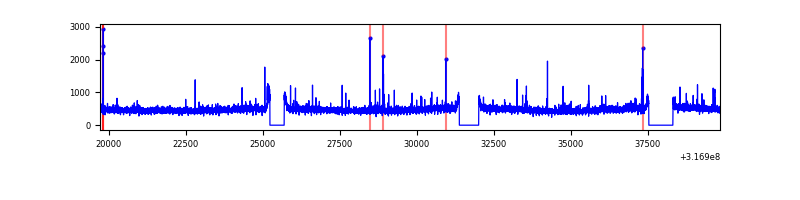 |
| C | 20130 | 18250 | 539 | 539 | 2.68% | 2.95% | 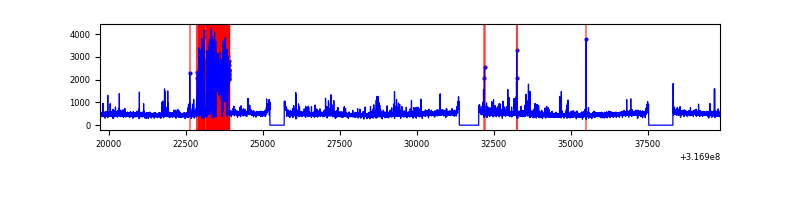 |
| D | 20129 | 18250 | 58 | 58 | 0.29% | 0.32% | 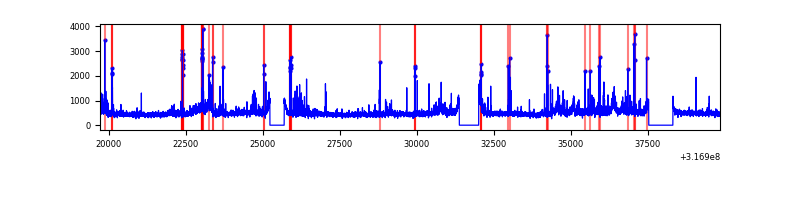 |
Top three noisy pixels from each quadrant. If the there are fewer than three noisy pixels in the level2.evt file, extra rows are filled as -1
| Pixel properties | Quadrant properties | ||||||
|---|---|---|---|---|---|---|---|
| Quadrant | DetID | PixID | Counts | Sigma | Mean | Median | Sigma |
| A | 6 | 16 | 27879 | 57.73 | 2206 | 2158 | 445.5 |
| A | 13 | 254 | 27327 | 56.49 | 2206 | 2158 | 445.5 |
| A | 3 | 137 | 19929 | 39.89 | 2206 | 2158 | 445.5 |
| B | 3 | 64 | 76143 | 176.14 | 2199 | 2143 | 420.1 |
| B | 12 | 111 | 52582 | 120.06 | 2199 | 2143 | 420.1 |
| B | 11 | 111 | 46789 | 106.27 | 2199 | 2143 | 420.1 |
| C | 10 | 9 | 1918015 | 3944.15 | 2076 | 2094 | 485.8 |
| C | 14 | 238 | 328420 | 671.78 | 2076 | 2094 | 485.8 |
| C | 0 | 207 | 134445 | 272.46 | 2076 | 2094 | 485.8 |
| D | 1 | 52 | 863988 | 1624.81 | 2152 | 2088 | 530.5 |
| D | 1 | 239 | 336933 | 631.23 | 2152 | 2088 | 530.5 |
| D | 7 | 238 | 191884 | 357.79 | 2152 | 2088 | 530.5 |
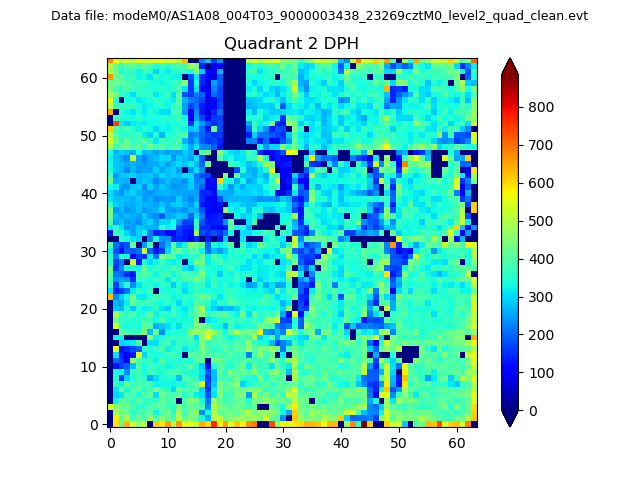
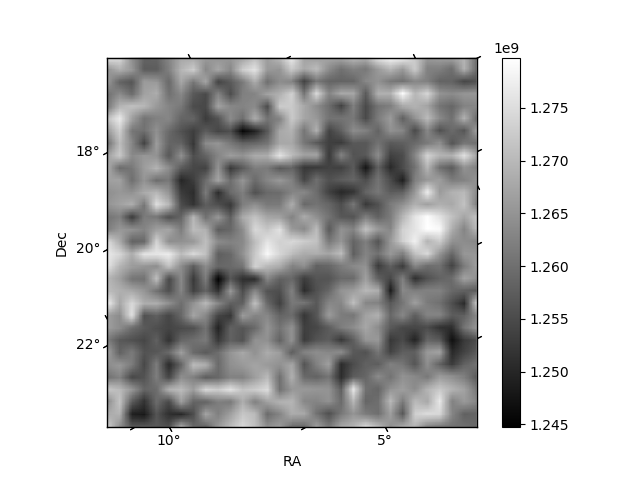
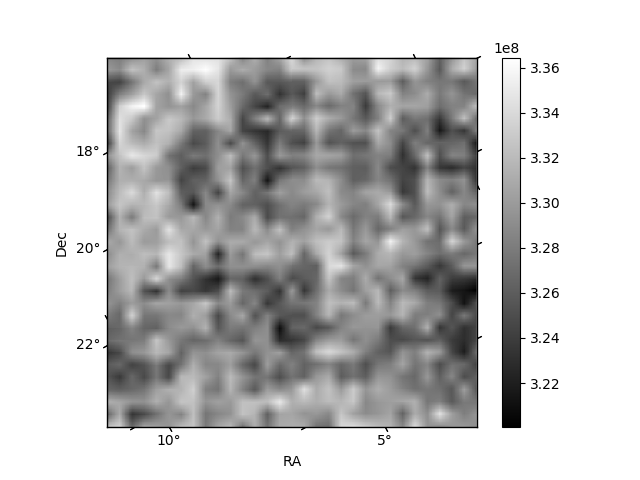
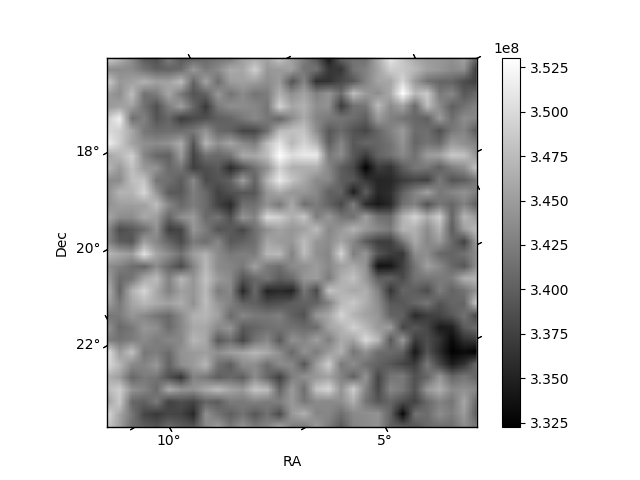
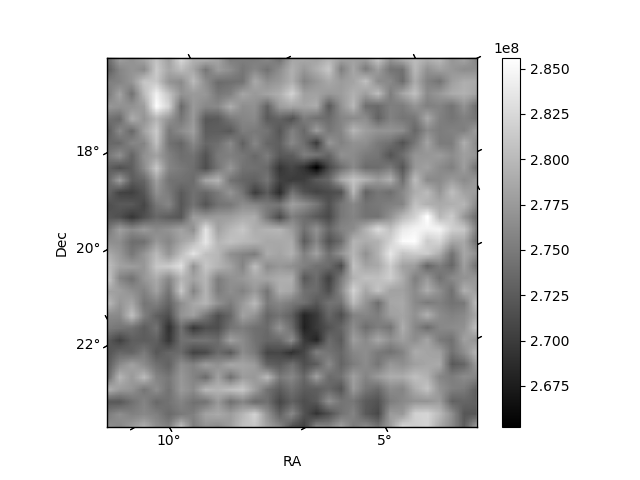
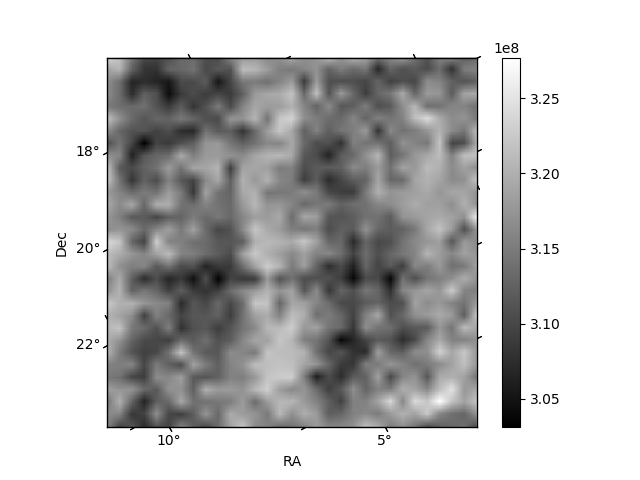
Histogram calculated using DETX and DETY for each event in the final _common_clean file
| Quadrant A | 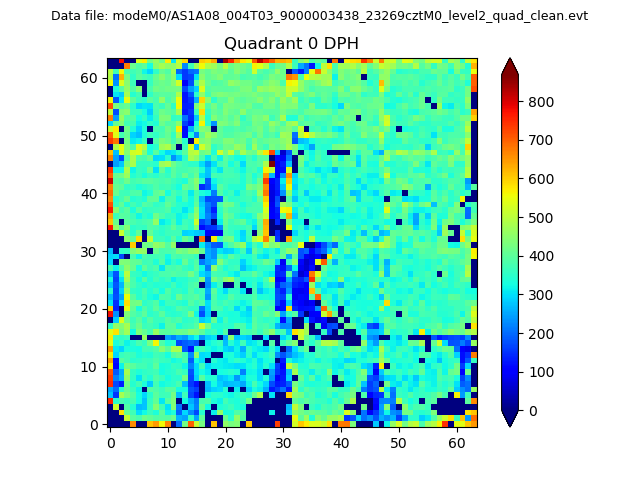 |
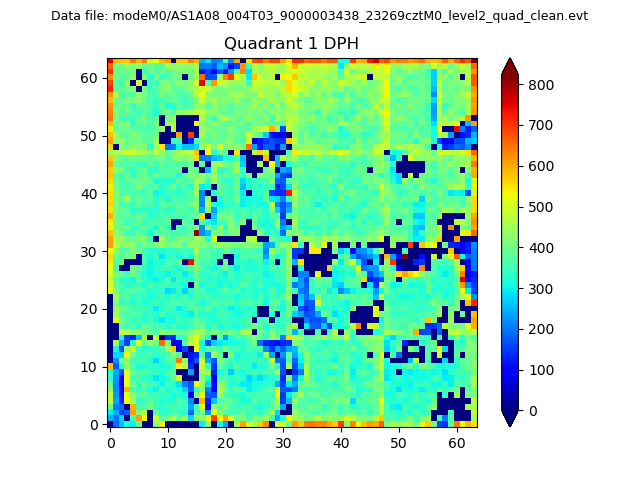 |
Quadrant B |
|---|---|---|---|
| Quadrant D | 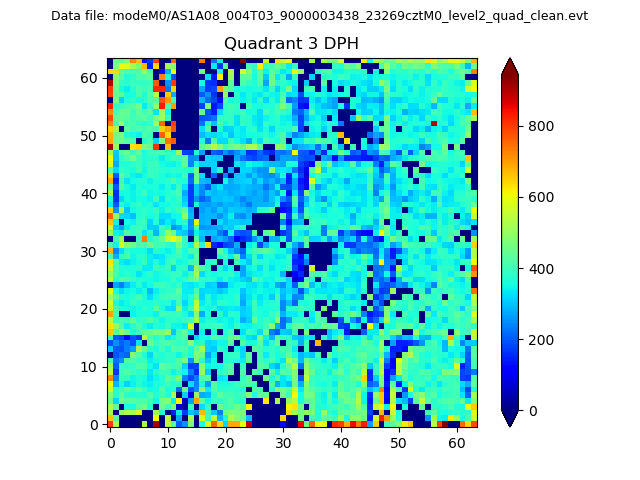 |
 |
Quadrant C |
| Plot type | Count rate plots | Images |
|---|---|---|
| Comparison with Poisson distribution Blue bars denote a histogram of data divided into 1 sec bins. Red curve is a Poisson curve with rate = median count rate of data. |
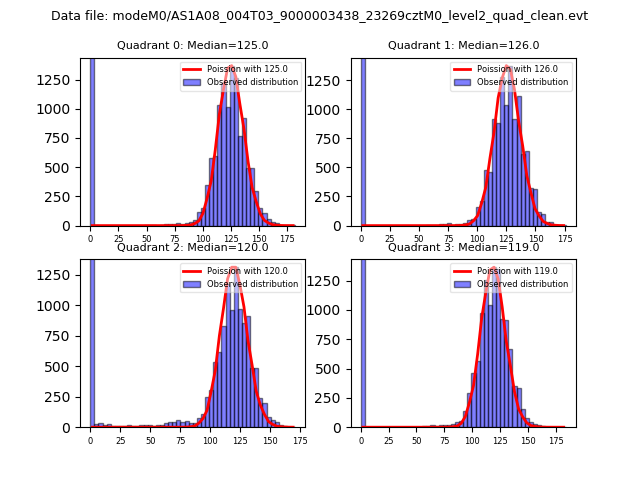 |
 |
| Quadrant-wise count rates Data is divided into 100 sec bins |
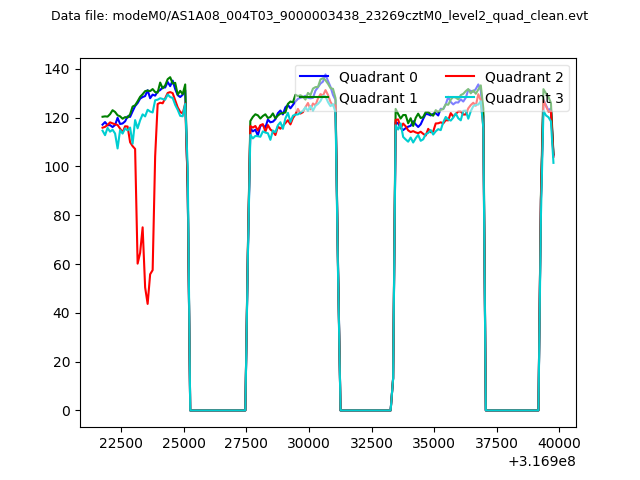 |
|
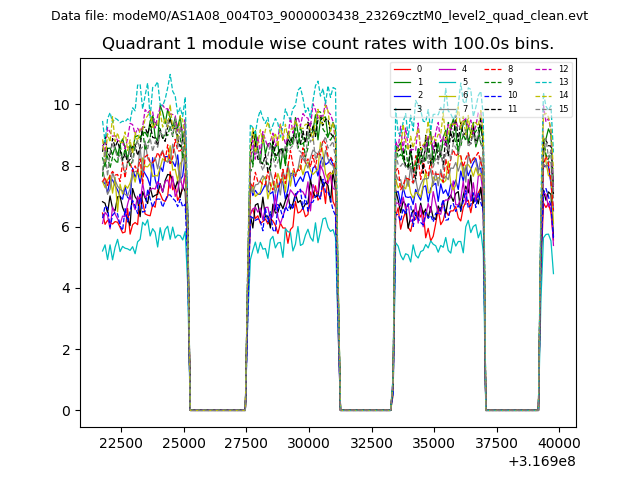
| Module-wise count rates for Quadrant A Data is divided into 100 sec bins |
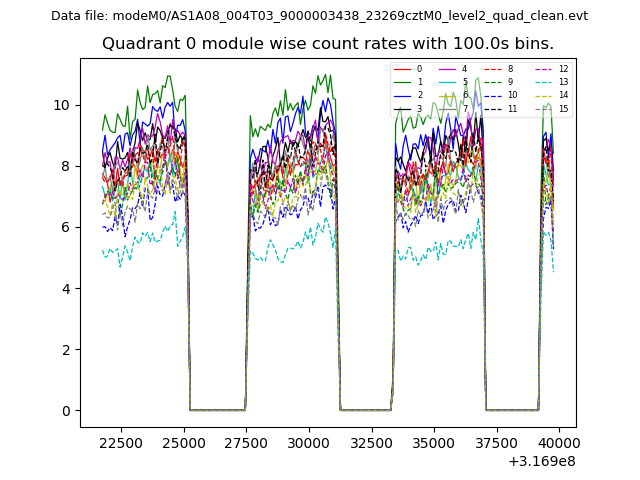 |
 |
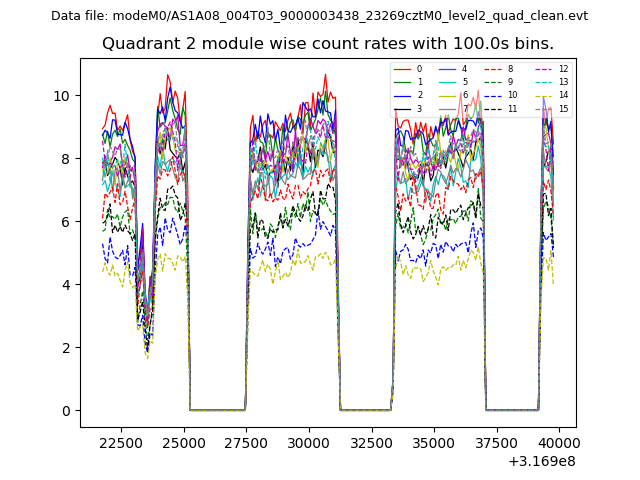
| Module-wise count rates for Quadrant B Data is divided into 100 sec bins |
 |
 |
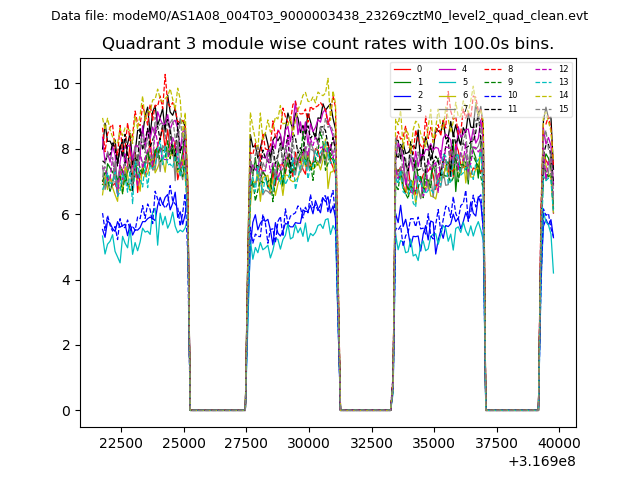
| Module-wise count rates for Quadrant C Data is divided into 100 sec bins |
 |
 |
| Module-wise count rates for Quadrant D Data is divided into 100 sec bins |
 |
 |
| Parameter | Plot |
|---|---|
| CZT HV Monitor | 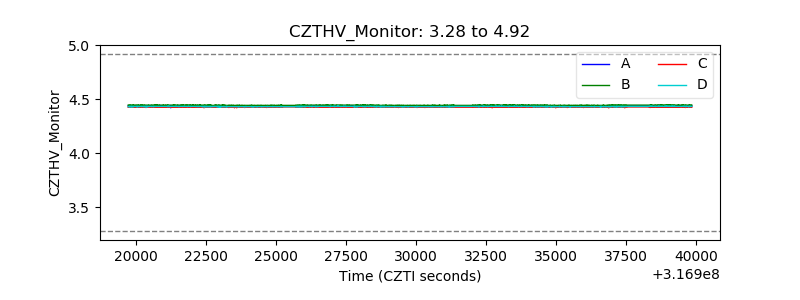 |
| D_VDD | 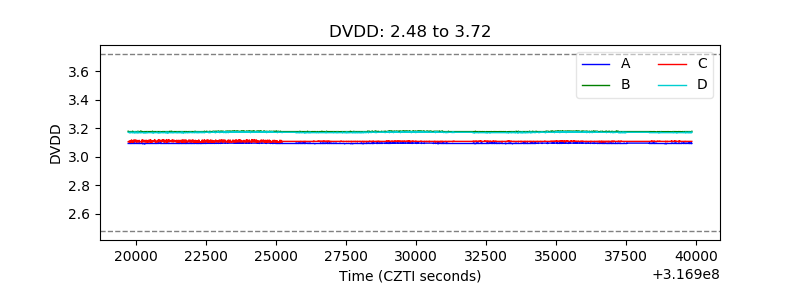 |
| Temperature 1 | 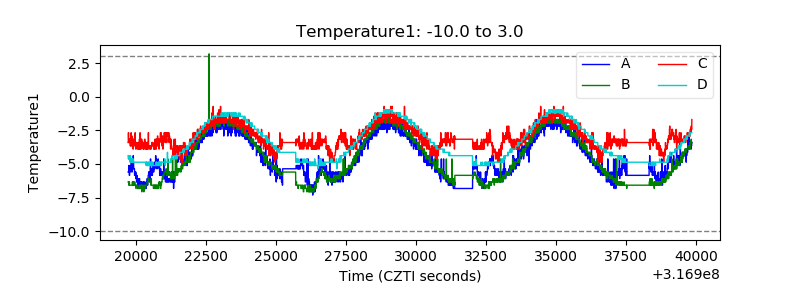 |
| Veto HV Monitor |  |
| Veto LLD | 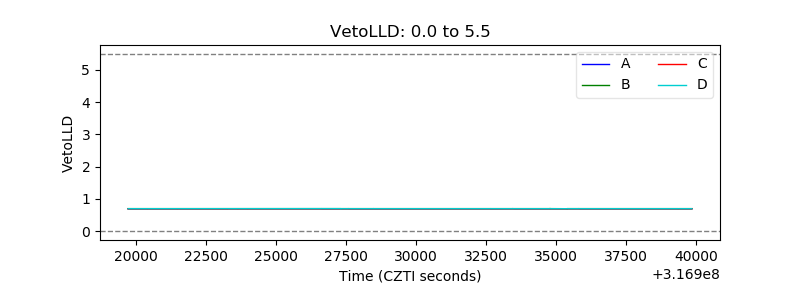 |
| Alpha Counter | 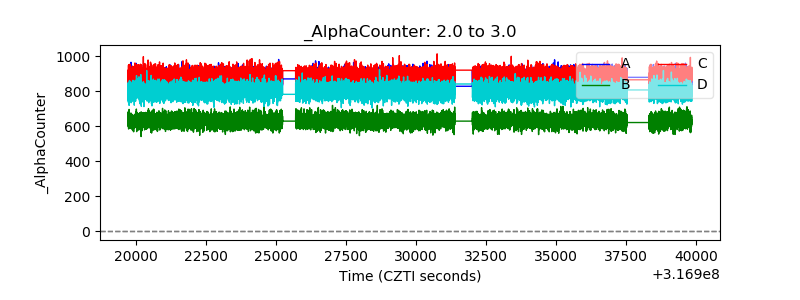 |
| _CPM_Rate | 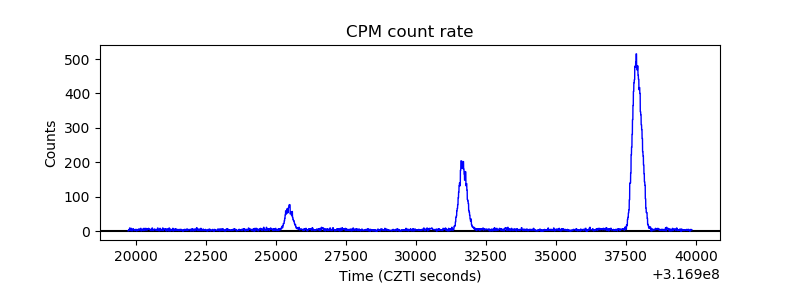 |
| CZT Counter | 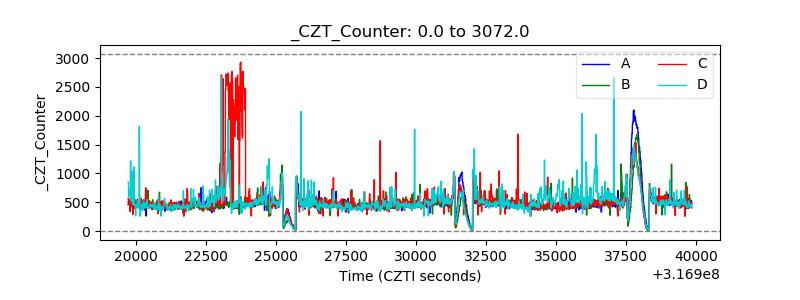 |
| +2.5 Volts monitor |  |
| +5 Volts monitor |  |
| _ROLL_ROT | 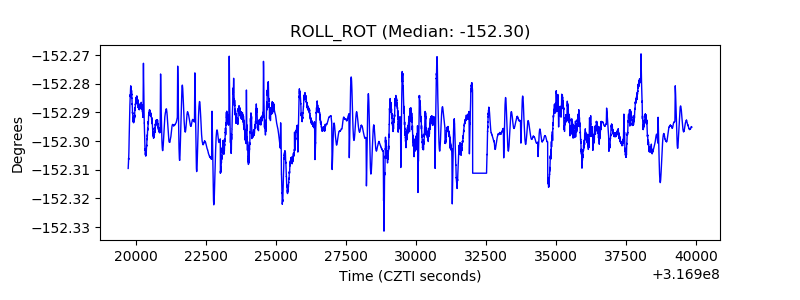 |
| _Roll_DEC | 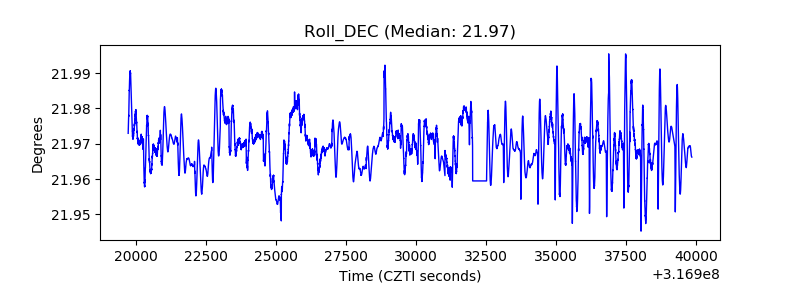 |
| _Roll_RA | 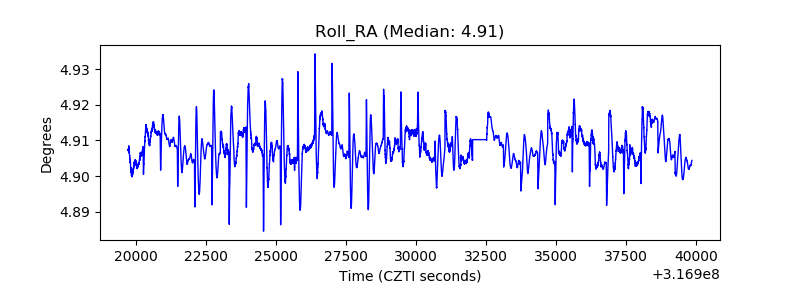 |
| Veto Counter | 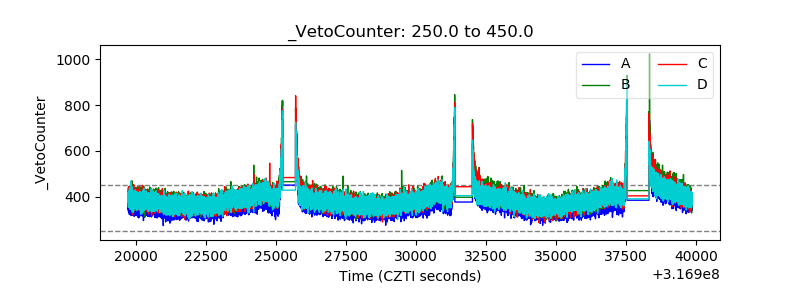 |