| Param | Original file | Final file |
|---|---|---|
| Filename | modeM0/AS1A08_004T03_9000003438_23272cztM0_level2.evt | modeM0/AS1A08_004T03_9000003438_23272cztM0_level2_quad_clean.evt |
| Size (bytes) | 180,904,320 | 48,663,360 |
| Size | 172.5 MB | 46.4 MB |
| Events in quadrant A | 1,170,315 | 331,251 |
| Events in quadrant B | 1,178,994 | 335,297 |
| Events in quadrant C | 1,742,660 | 310,579 |
| Events in quadrant D | 1,211,559 | 313,733 |
| Mode M0 | |||
|---|---|---|---|
| Quadrant | BADHDUFLAG | Total packets | Discarded packets |
| A | 0 | 5132 | 0 |
| B | 0 | 5188 | 0 |
| C | 0 | 6896 | 0 |
| D | 0 | 5301 | 0 |
| Mode SS | |||
|---|---|---|---|
| Quadrant | BADHDUFLAG | Total packets | Discarded packets |
| A | 0 | 52 | 0 |
| B | 0 | 52 | 0 |
| C | 0 | 52 | 0 |
| D | 0 | 52 | 0 |
| Quadrant | Total seconds | Saturated seconds | Saturation percentage |
|---|---|---|---|
| A | 2541 | 1 | 0.039355% |
| B | 2541 | 2 | 0.078709% |
| C | 2541 | 44 | 1.731602% |
| D | 2542 | 6 | 0.236035% |
Noise dominated data is calculated using 1-second bins in cleaned event files. If a bin has >2000 counts, and if more than 50% of those come from <1% of pixels, then it is considered to be noise-dominated and hence unusable.
| Quadrant | # 1 sec bins | Bins with >0 counts | Bins with >2000 counts | High rate bins dominated by noise | Noise dominated (total time) | Noise dominated (detector-on time) | Marked lightcurve |
|---|---|---|---|---|---|---|---|
| A | 2541 | 2541 | 0 | 0 | 0.00% | 0.00% | 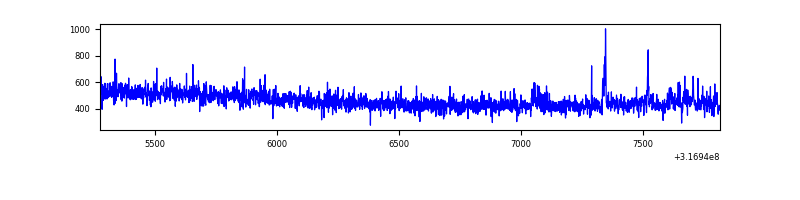 |
| B | 2541 | 2541 | 1 | 1 | 0.04% | 0.04% | 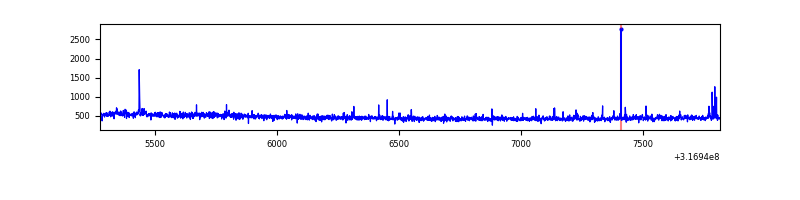 |
| C | 2541 | 2541 | 24 | 24 | 0.94% | 0.94% | 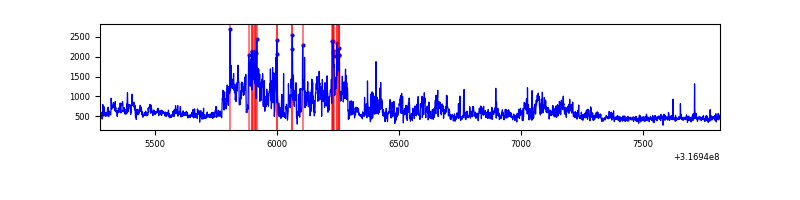 |
| D | 2542 | 2542 | 6 | 6 | 0.24% | 0.24% | 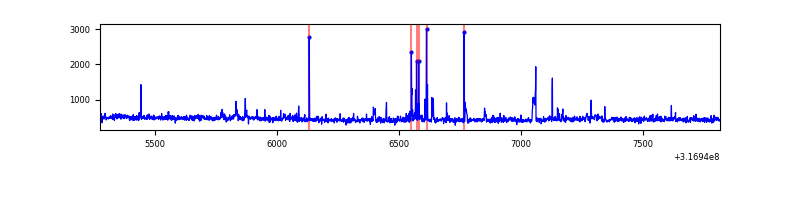 |
Top three noisy pixels from each quadrant. If the there are fewer than three noisy pixels in the level2.evt file, extra rows are filled as -1
| Pixel properties | Quadrant properties | ||||||
|---|---|---|---|---|---|---|---|
| Quadrant | DetID | PixID | Counts | Sigma | Mean | Median | Sigma |
| A | 2 | 79 | 15287 | 242.28 | 299 | 294 | 61.9 |
| A | 13 | 254 | 3474 | 51.39 | 299 | 294 | 61.9 |
| A | 0 | 226 | 2682 | 38.59 | 299 | 294 | 61.9 |
| B | 3 | 64 | 15717 | 263.48 | 294 | 286 | 58.6 |
| B | 5 | 172 | 6815 | 111.48 | 294 | 286 | 58.6 |
| B | 12 | 111 | 6671 | 109.02 | 294 | 286 | 58.6 |
| C | 10 | 9 | 559326 | 8492.01 | 277 | 280 | 65.8 |
| C | 0 | 207 | 55996 | 846.34 | 277 | 280 | 65.8 |
| C | 14 | 238 | 44683 | 674.49 | 277 | 280 | 65.8 |
| D | 1 | 52 | 33386 | 467.64 | 287 | 279 | 70.8 |
| D | 13 | 104 | 27157 | 379.65 | 287 | 279 | 70.8 |
| D | 1 | 239 | 21064 | 293.59 | 287 | 279 | 70.8 |
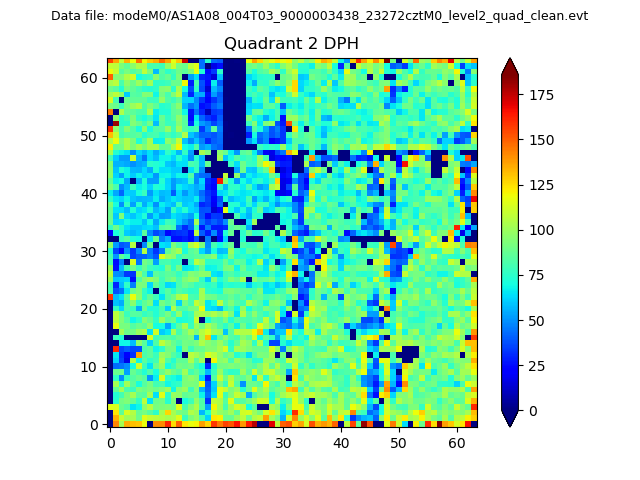
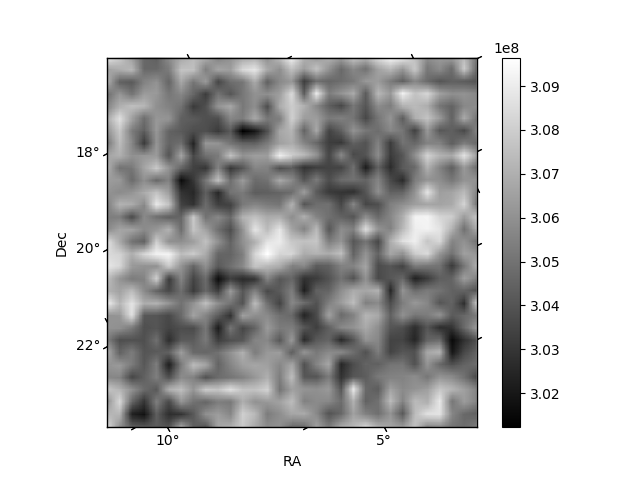
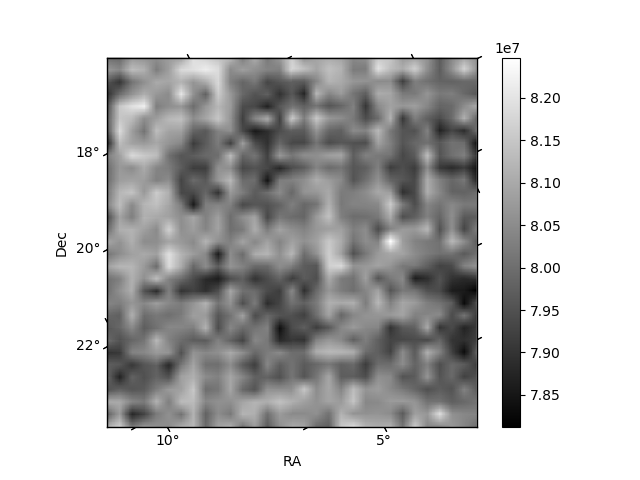
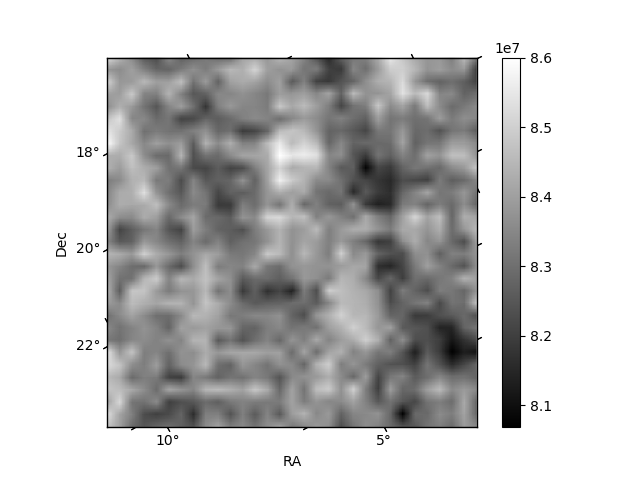
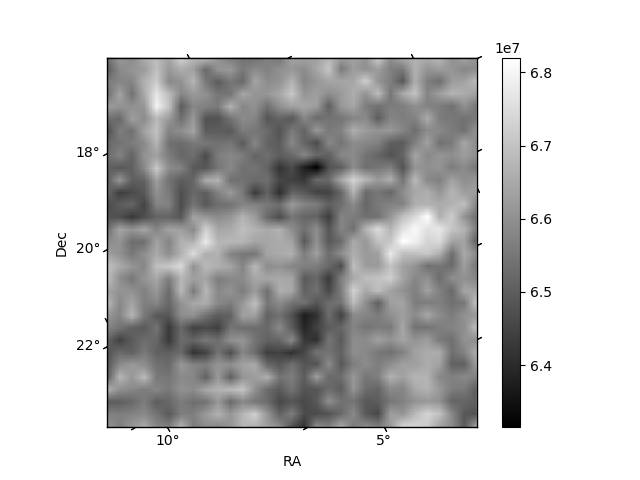
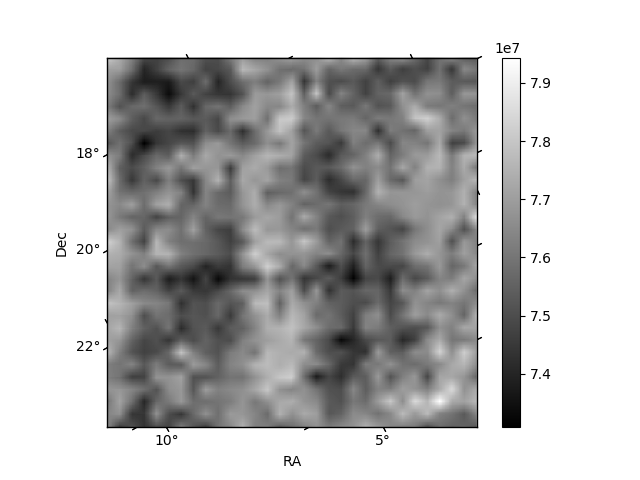
Histogram calculated using DETX and DETY for each event in the final _common_clean file
| Quadrant A | 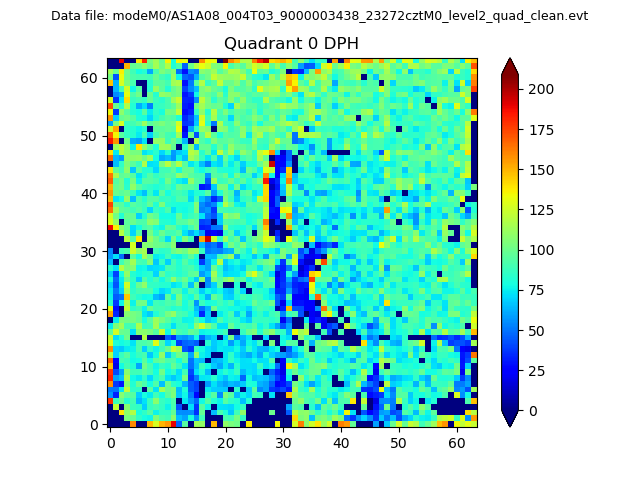 |
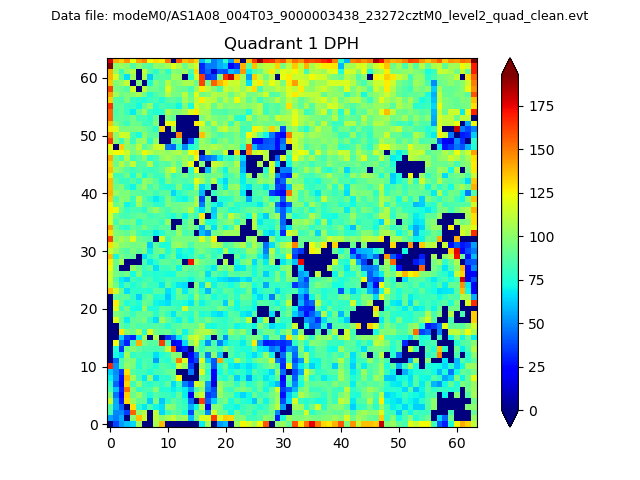 |
Quadrant B |
|---|---|---|---|
| Quadrant D | 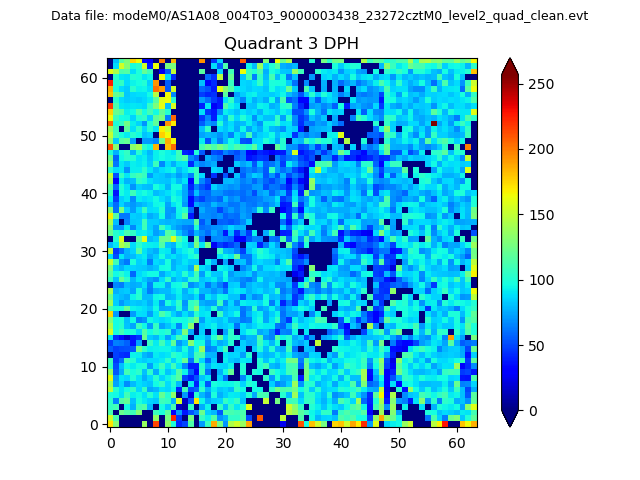 |
 |
Quadrant C |
| Plot type | Count rate plots | Images |
|---|---|---|
| Comparison with Poisson distribution Blue bars denote a histogram of data divided into 1 sec bins. Red curve is a Poisson curve with rate = median count rate of data. |
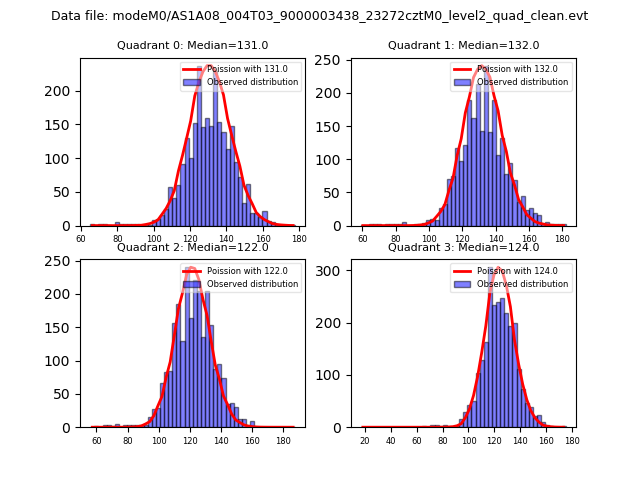 |
 |
| Quadrant-wise count rates Data is divided into 100 sec bins |
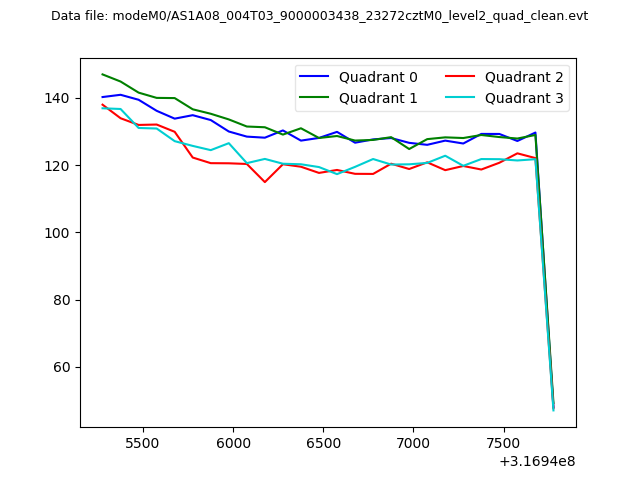 |
|
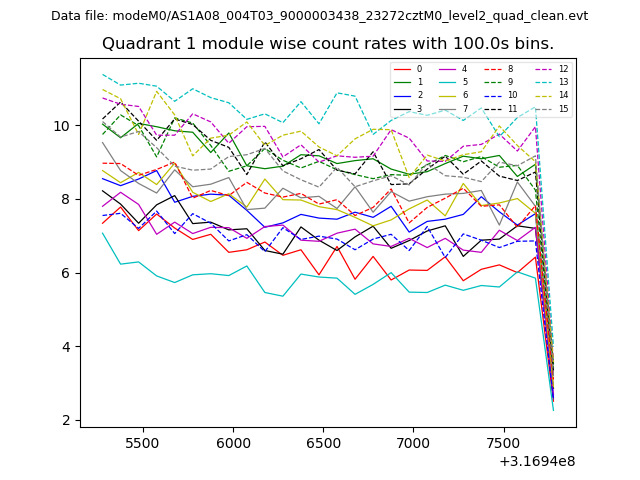
| Module-wise count rates for Quadrant A Data is divided into 100 sec bins |
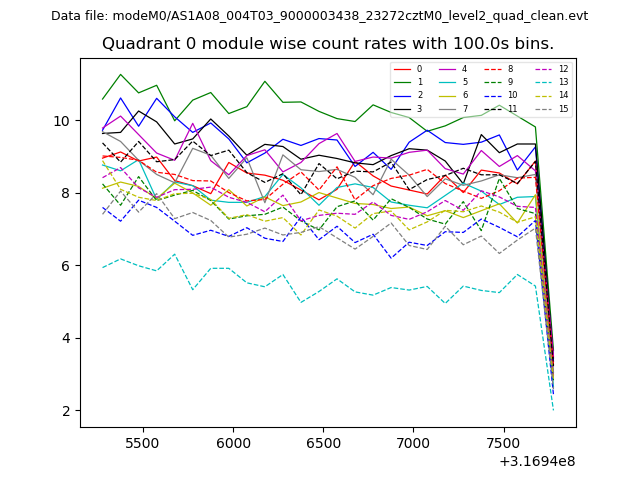 |
 |
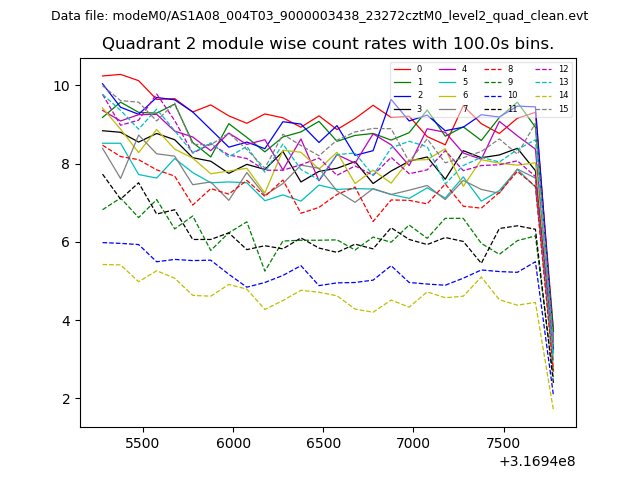
| Module-wise count rates for Quadrant B Data is divided into 100 sec bins |
 |
 |
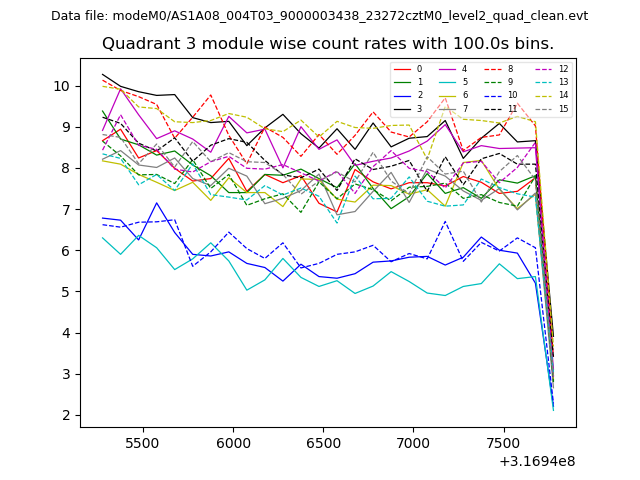
| Module-wise count rates for Quadrant C Data is divided into 100 sec bins |
 |
 |
| Module-wise count rates for Quadrant D Data is divided into 100 sec bins |
 |
 |
| Parameter | Plot |
|---|---|
| CZT HV Monitor | 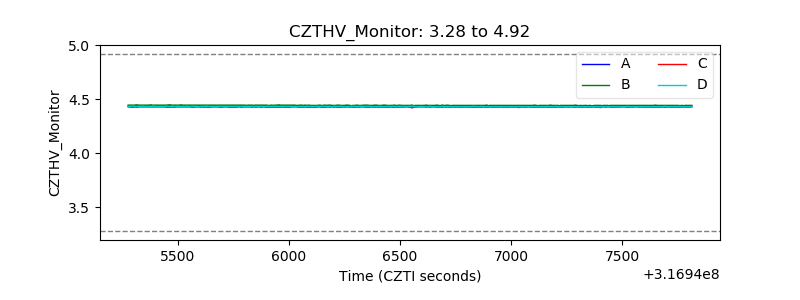 |
| D_VDD | 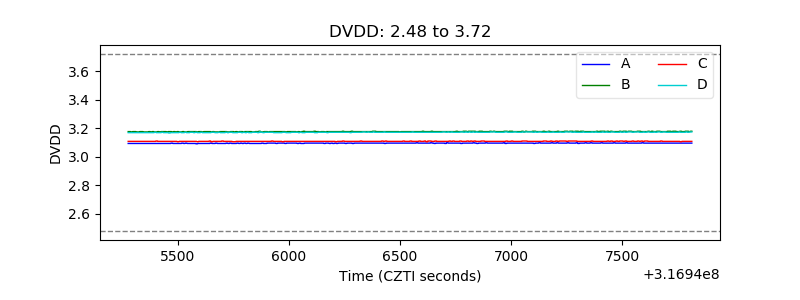 |
| Temperature 1 | 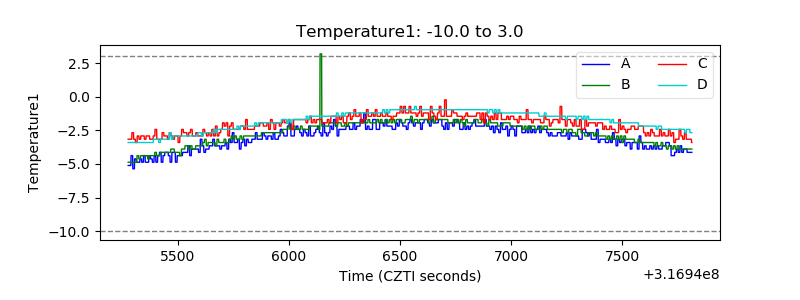 |
| Veto HV Monitor |  |
| Veto LLD | 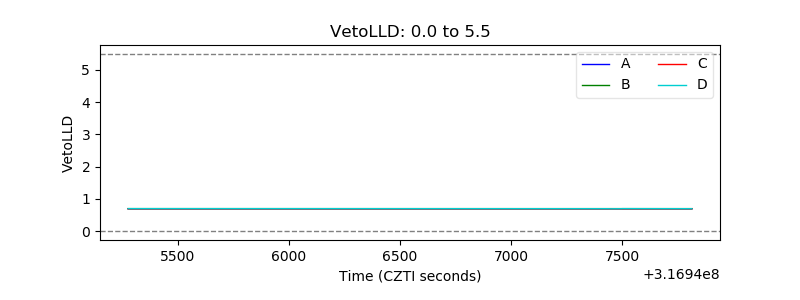 |
| Alpha Counter |  |
| _CPM_Rate | 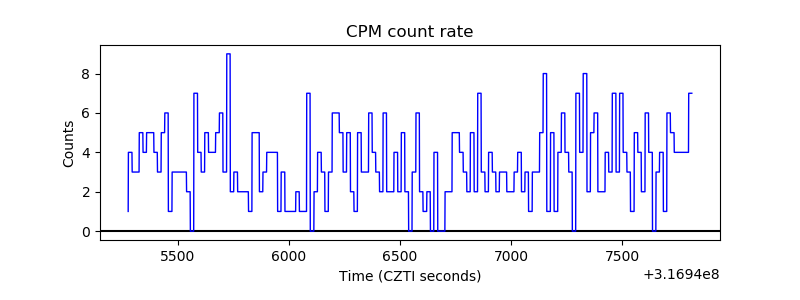 |
| CZT Counter | 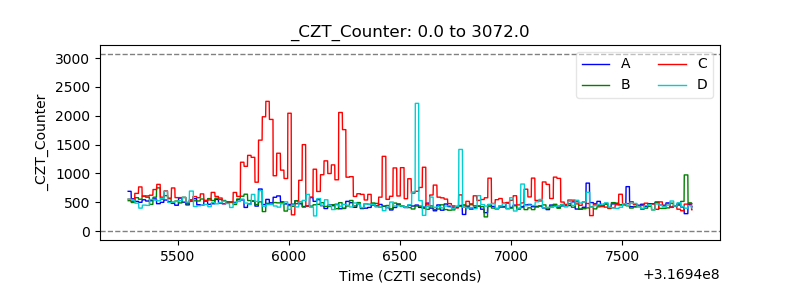 |
| +2.5 Volts monitor |  |
| +5 Volts monitor |  |
| _ROLL_ROT | 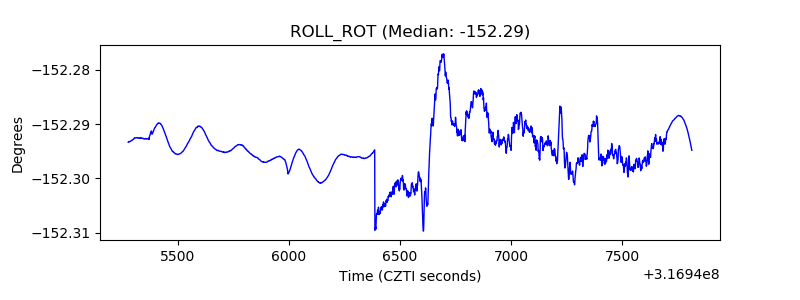 |
| _Roll_DEC | 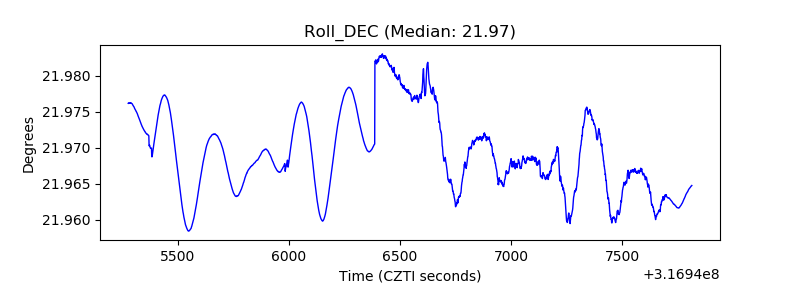 |
| _Roll_RA | 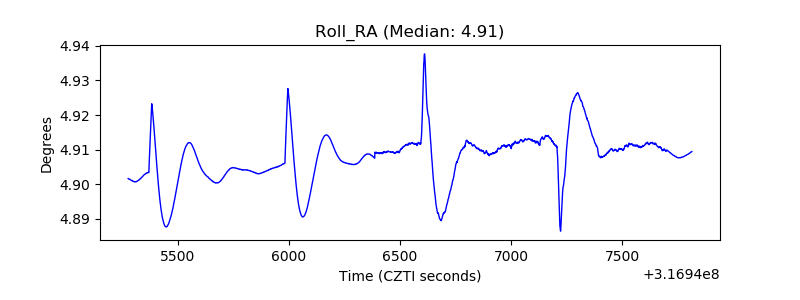 |
| Veto Counter | 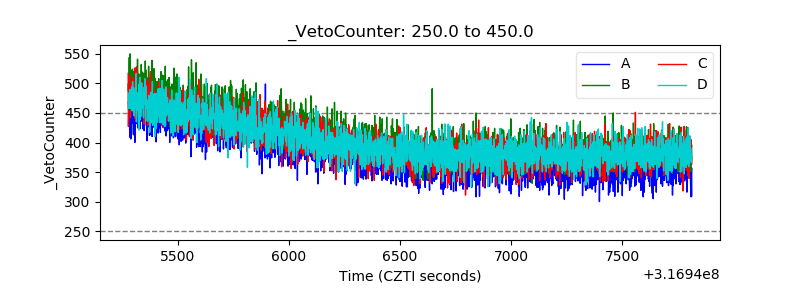 |