| Param | Original file | Final file |
|---|---|---|
| Filename | modeM0/AS1A08_004T03_9000003438_23450cztM0_level2.evt | modeM0/AS1A08_004T03_9000003438_23450cztM0_level2_quad_clean.evt |
| Size (bytes) | 561,672,000 | 55,990,080 |
| Size | 535.7 MB | 53.4 MB |
| Events in quadrant A | 2,950,113 | 363,376 |
| Events in quadrant B | 3,145,773 | 363,560 |
| Events in quadrant C | 2,975,704 | 353,533 |
| Events in quadrant D | 7,554,954 | 218,399 |
| Mode M9 | |||
|---|---|---|---|
| Quadrant | BADHDUFLAG | Total packets | Discarded packets |
| A | 0 | 12 | 0 |
| B | 0 | 13 | 1 |
| C | 0 | 12 | 0 |
| D | 0 | 12 | 0 |
| Mode M0 | |||
|---|---|---|---|
| Quadrant | BADHDUFLAG | Total packets | Discarded packets |
| A | 0 | 12783 | 809 |
| B | 0 | 13368 | 824 |
| C | 0 | 12956 | 885 |
| D | 0 | 27978 | 1554 |
| Mode SS | |||
|---|---|---|---|
| Quadrant | BADHDUFLAG | Total packets | Discarded packets |
| A | 0 | 124 | 6 |
| B | 0 | 124 | 6 |
| C | 0 | 123 | 7 |
| D | 0 | 124 | 6 |
| Quadrant | Total seconds | Saturated seconds | Saturation percentage |
|---|---|---|---|
| A | 5668 | 88 | 1.552576% |
| B | 5652 | 161 | 2.848549% |
| C | 5667 | 124 | 2.188107% |
| D | 5608 | 1635 | 29.154779% |
Noise dominated data is calculated using 1-second bins in cleaned event files. If a bin has >2000 counts, and if more than 50% of those come from <1% of pixels, then it is considered to be noise-dominated and hence unusable.
| Quadrant | # 1 sec bins | Bins with >0 counts | Bins with >2000 counts | High rate bins dominated by noise | Noise dominated (total time) | Noise dominated (detector-on time) | Marked lightcurve |
|---|---|---|---|---|---|---|---|
| A | 7297 | 5724 | 8 | 8 | 0.11% | 0.14% | 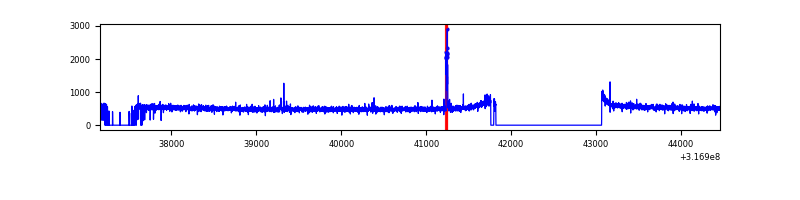 |
| B | 7297 | 5722 | 15 | 15 | 0.21% | 0.26% | 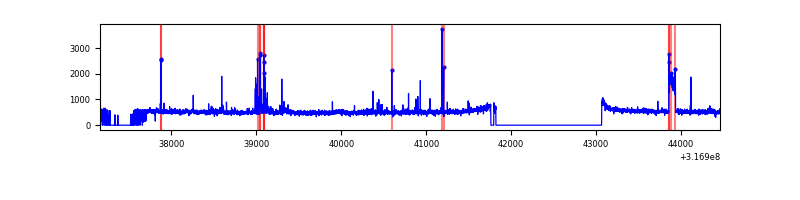 |
| C | 7297 | 5722 | 0 | 0 | 0.00% | 0.00% | 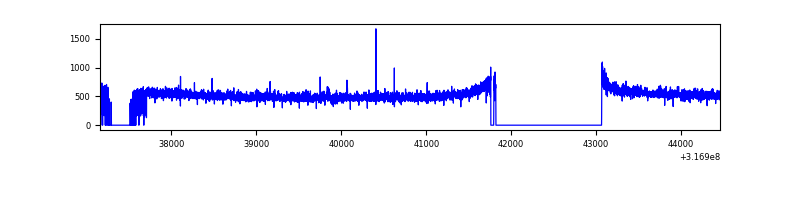 |
| D | 7296 | 5677 | 1433 | 1433 | 19.64% | 25.24% | 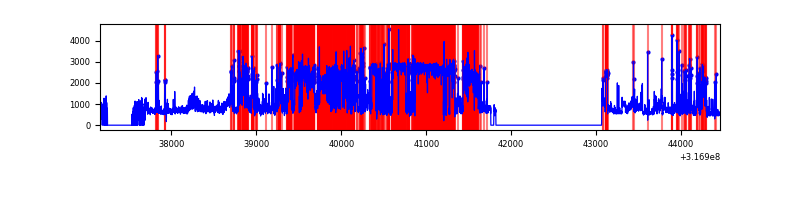 |
Top three noisy pixels from each quadrant. If the there are fewer than three noisy pixels in the level2.evt file, extra rows are filled as -1
| Pixel properties | Quadrant properties | ||||||
|---|---|---|---|---|---|---|---|
| Quadrant | DetID | PixID | Counts | Sigma | Mean | Median | Sigma |
| A | 15 | 174 | 30334 | 198.01 | 757 | 743 | 149.4 |
| A | 13 | 254 | 8554 | 52.27 | 757 | 743 | 149.4 |
| A | 0 | 226 | 6735 | 40.1 | 757 | 743 | 149.4 |
| B | 5 | 172 | 48970 | 356.63 | 736 | 719 | 135.3 |
| B | 7 | 202 | 40841 | 296.55 | 736 | 719 | 135.3 |
| B | 7 | 187 | 31360 | 226.47 | 736 | 719 | 135.3 |
| C | 14 | 238 | 115800 | 692.82 | 725 | 731 | 166.1 |
| C | 7 | 247 | 19978 | 115.88 | 725 | 731 | 166.1 |
| C | 1 | 16 | 7898 | 43.15 | 725 | 731 | 166.1 |
| D | 1 | 52 | 3989113 | 26524.23 | 624 | 609 | 150.4 |
| D | 7 | 238 | 985674 | 6550.85 | 624 | 609 | 150.4 |
| D | 12 | 233 | 134445 | 890.03 | 624 | 609 | 150.4 |
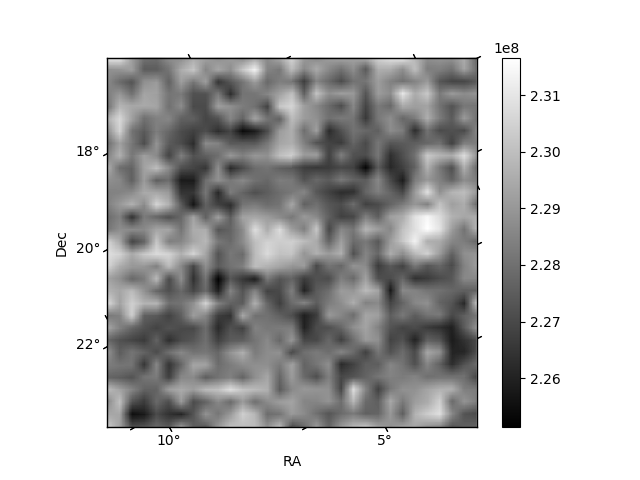
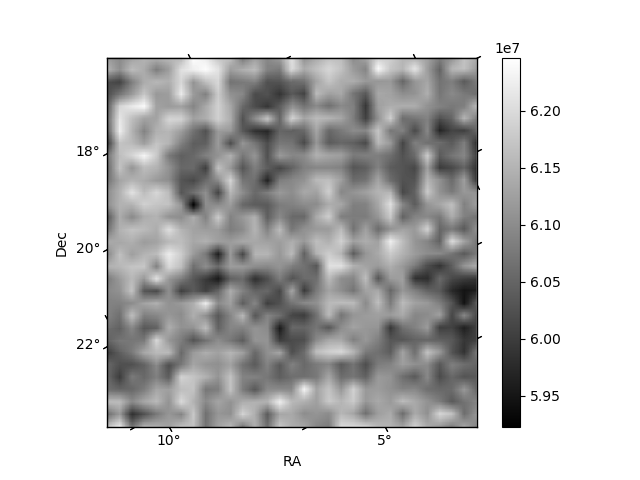
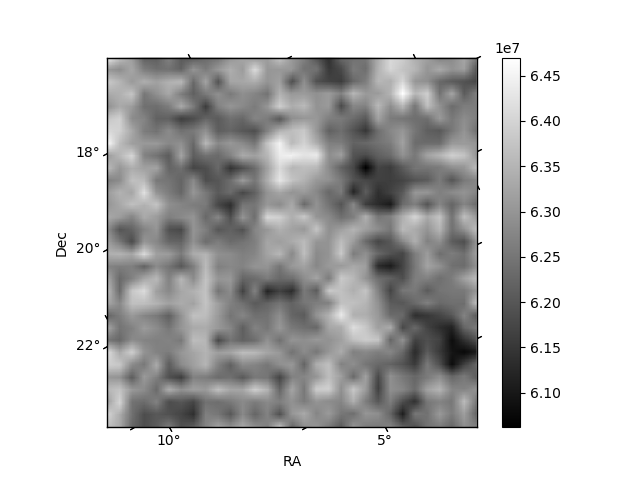
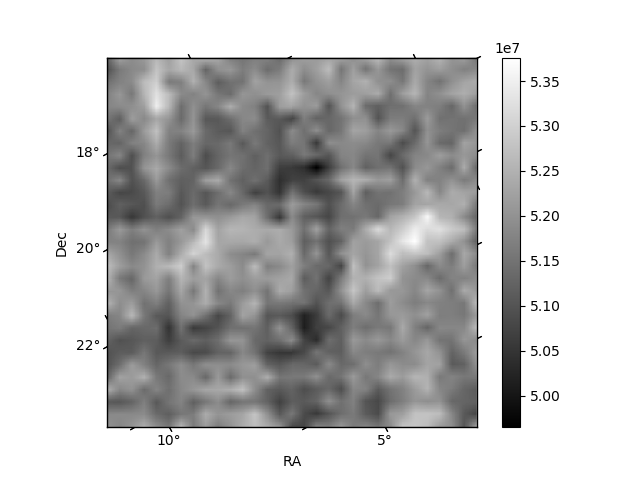
Histogram calculated using DETX and DETY for each event in the final _common_clean file
| Quadrant A | 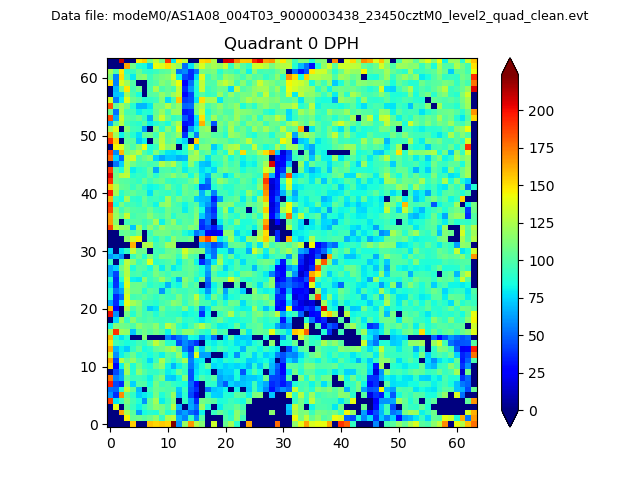 |
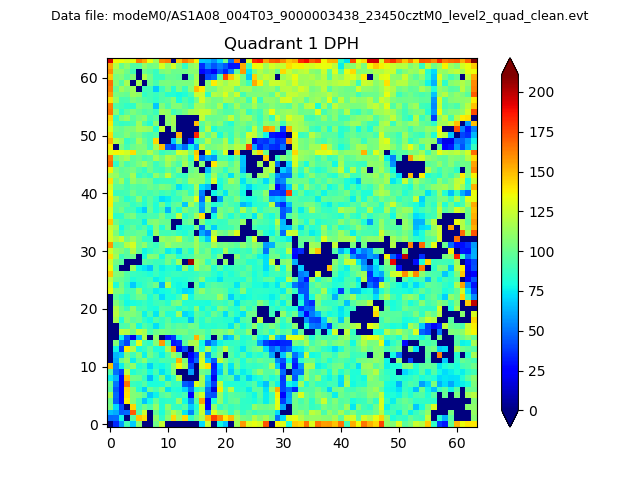 |
Quadrant B |
|---|---|---|---|
| Quadrant D | 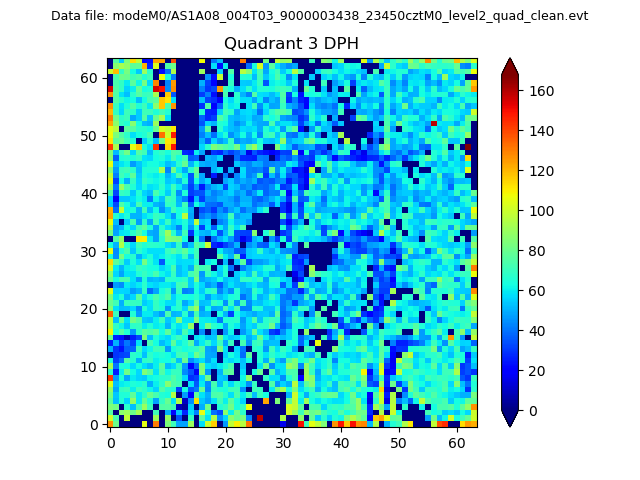 |
 |
Quadrant C |
| Plot type | Count rate plots | Images |
|---|---|---|
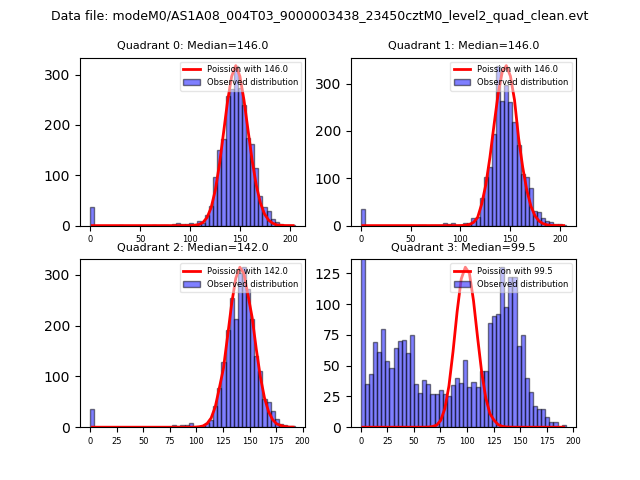
| Comparison with Poisson distribution Blue bars denote a histogram of data divided into 1 sec bins. Red curve is a Poisson curve with rate = median count rate of data. |
 |
 |
| Quadrant-wise count rates Data is divided into 100 sec bins |
 |
|
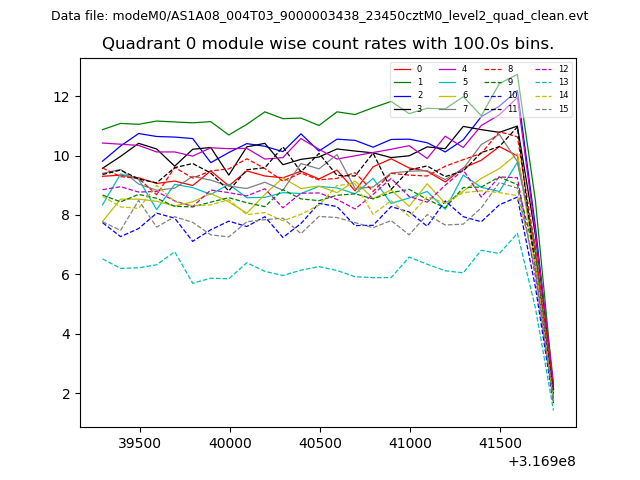
| Module-wise count rates for Quadrant A Data is divided into 100 sec bins |
 |
 |
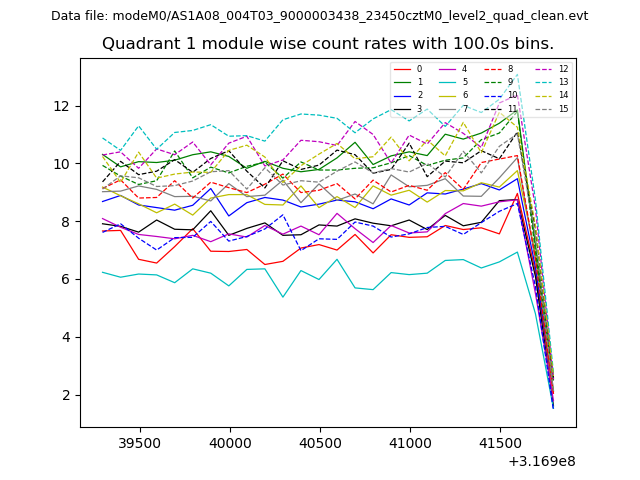
| Module-wise count rates for Quadrant B Data is divided into 100 sec bins |
 |
 |
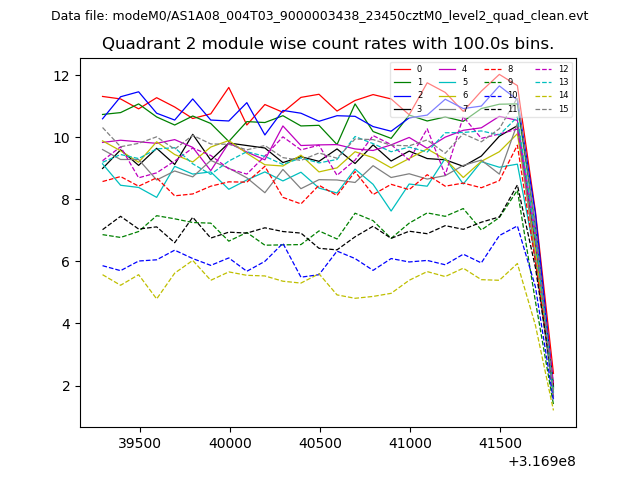
| Module-wise count rates for Quadrant C Data is divided into 100 sec bins |
 |
 |
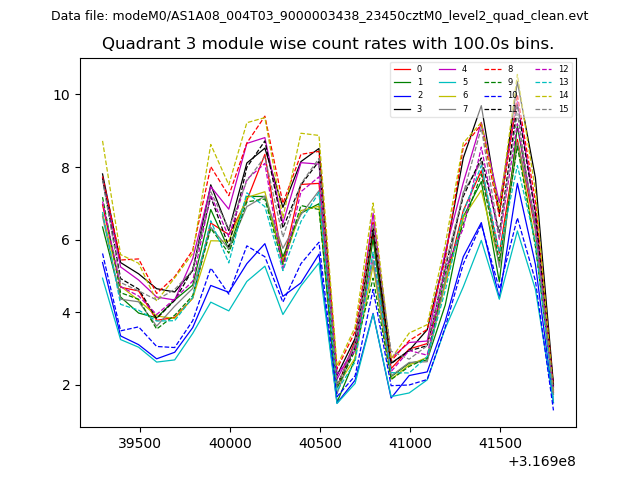
| Module-wise count rates for Quadrant D Data is divided into 100 sec bins |
 |
 |
| Parameter | Plot |
|---|---|
| CZT HV Monitor | 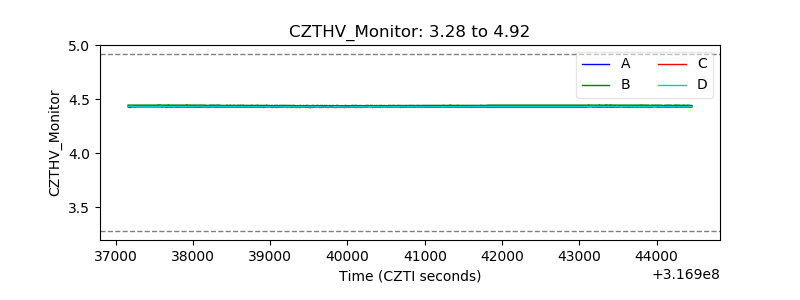 |
| D_VDD | 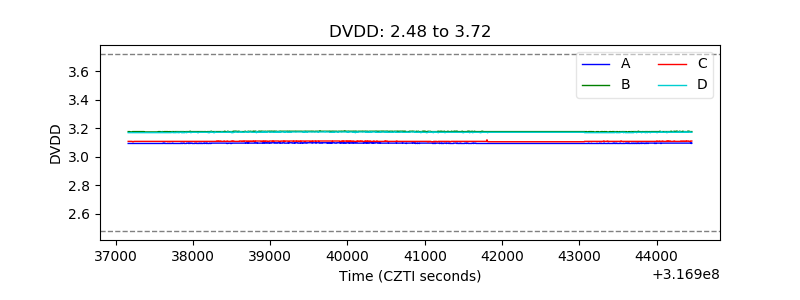 |
| Temperature 1 |  |
| Veto HV Monitor | 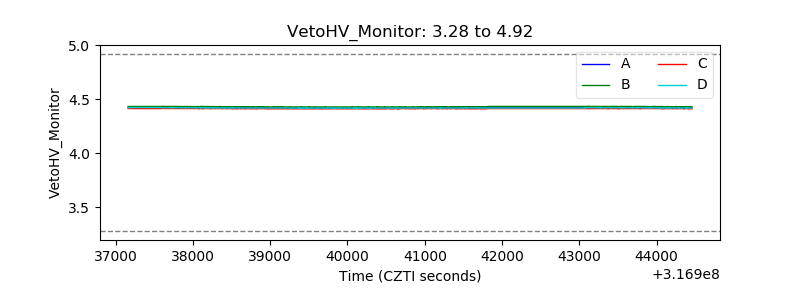 |
| Veto LLD | 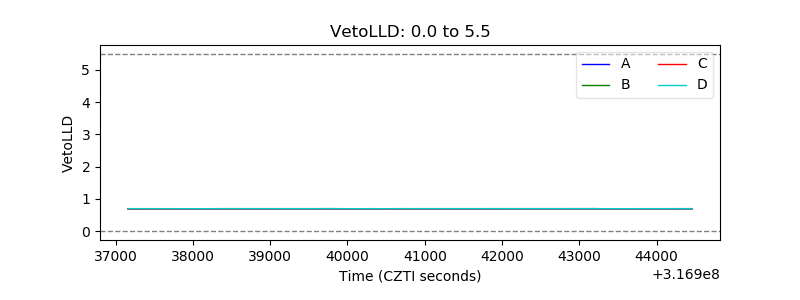 |
| Alpha Counter | 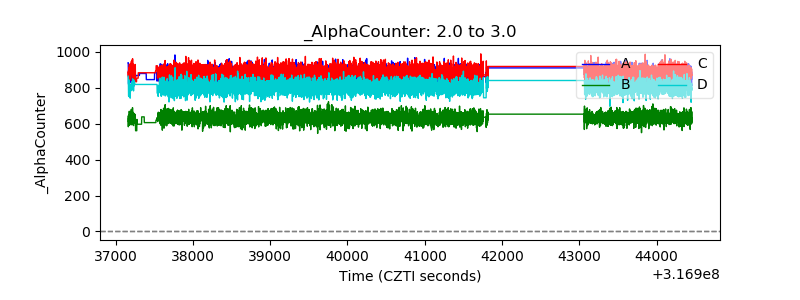 |
| _CPM_Rate | 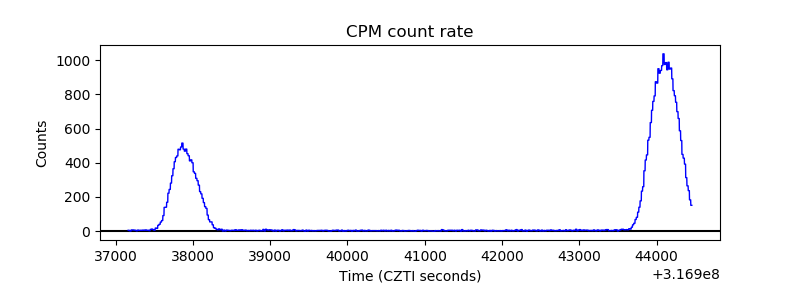 |
| CZT Counter |  |
| +2.5 Volts monitor |  |
| +5 Volts monitor |  |
| _ROLL_ROT | 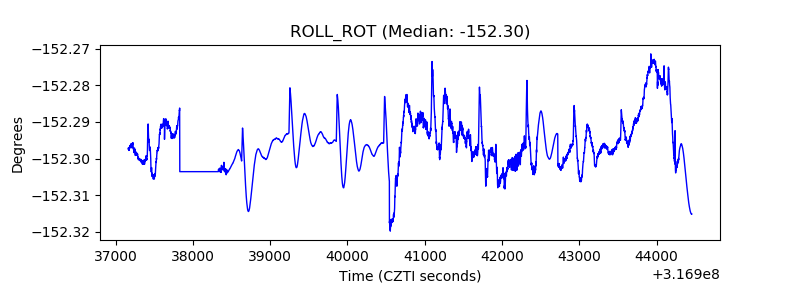 |
| _Roll_DEC | 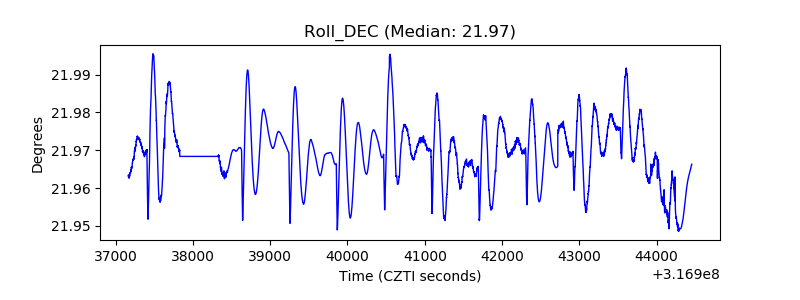 |
| _Roll_RA |  |
| Veto Counter | 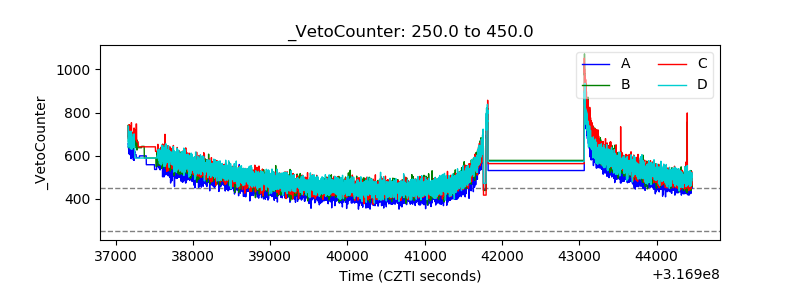 |