| Param | Original file | Final file |
|---|---|---|
| Filename | modeM0/AS1C05_005T01_9000003440cztM0_level2.fits | modeM0/AS1C05_005T01_9000003440cztM0_level2_quad_clean.evt |
| Size (bytes) | 597,251,520 | 575,112,960 |
| Size | 569.6 MB | 548.5 MB |
| Events in quadrant A | 3,711,602 | 3,479,253 |
| Events in quadrant B | 3,547,536 | 3,503,697 |
| Events in quadrant C | 3,630,288 | 3,340,983 |
| Events in quadrant D | 3,131,512 | 3,026,453 |
| Mode SS | |||
|---|---|---|---|
| Quadrant | BADHDUFLAG | Total packets | Discarded packets |
| A | 0 | 1206 | 0 |
| B | 0 | 1208 | 0 |
| C | 0 | 1208 | 0 |
| D | 0 | 1208 | 0 |
| Mode M9 | |||
|---|---|---|---|
| Quadrant | BADHDUFLAG | Total packets | Discarded packets |
| A | 0 | 99 | 0 |
| B | 0 | 99 | 0 |
| C | 0 | 99 | 0 |
| D | 0 | 99 | 0 |
| Mode M0 | |||
|---|---|---|---|
| Quadrant | BADHDUFLAG | Total packets | Discarded packets |
| A | 0 | 124070 | 0 |
| B | 0 | 126409 | 0 |
| C | 0 | 127135 | 0 |
| D | 0 | 154851 | 0 |
| Quadrant | Total seconds | Saturated seconds | Saturation percentage |
|---|---|---|---|
| A | 59290 | 559 | 0.942823% |
| B | 59283 | 701 | 1.182464% |
| C | 59289 | 1036 | 1.747373% |
| D | 59287 | 2245 | 3.786665% |
Noise dominated data is calculated using 1-second bins in cleaned event files. If a bin has >2000 counts, and if more than 50% of those come from <1% of pixels, then it is considered to be noise-dominated and hence unusable.
| Quadrant | # 1 sec bins | Bins with >0 counts | Bins with >2000 counts | High rate bins dominated by noise | Noise dominated (total time) | Noise dominated (detector-on time) | Marked lightcurve |
|---|---|---|---|---|---|---|---|
| A | 69307 | 59323 | 0 | 0 | 0.00% | 0.00% |  |
| B | 69307 | 59316 | 0 | 0 | 0.00% | 0.00% |  |
| C | 69307 | 59325 | 0 | 0 | 0.00% | 0.00% |  |
| D | 69307 | 59281 | 0 | 0 | 0.00% | 0.00% |  |
Top three noisy pixels from each quadrant. If the there are fewer than three noisy pixels in the level2.evt file, extra rows are filled as -1
| Pixel properties | Quadrant properties | ||||||
|---|---|---|---|---|---|---|---|
| Quadrant | DetID | PixID | Counts | Sigma | Mean | Median | Sigma |
| A | 0 | 29 | 3560 | 11.17 | 965 | 905 | 237.6 |
| A | 7 | 110 | 2942 | 8.57 | 965 | 905 | 237.6 |
| A | 9 | 19 | 2768 | 7.84 | 965 | 905 | 237.6 |
| B | 2 | 9 | 2859 | 10.47 | 940 | 898 | 187.3 |
| B | 2 | 8 | 2477 | 8.43 | 940 | 898 | 187.3 |
| B | 5 | 255 | 2382 | 7.92 | 940 | 898 | 187.3 |
| C | 1 | 80 | 2757 | 7.65 | 958 | 903 | 242.4 |
| C | 1 | 81 | 2736 | 7.56 | 958 | 903 | 242.4 |
| C | 9 | 209 | 2473 | 6.48 | 958 | 903 | 242.4 |
| D | 3 | 14 | 2326 | 6.4 | 895 | 819 | 235.6 |
| D | 6 | 38 | 2236 | 6.02 | 895 | 819 | 235.6 |
| D | 7 | 3 | 2229 | 5.99 | 895 | 819 | 235.6 |
Histogram calculated using DETX and DETY for each event in the final _common_clean file
| Quadrant A | 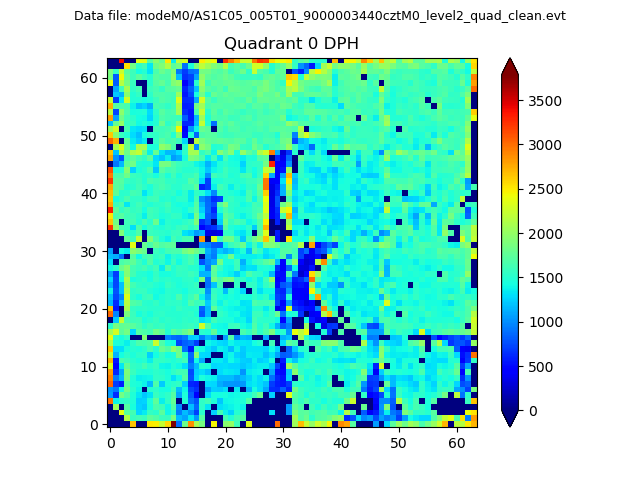 |
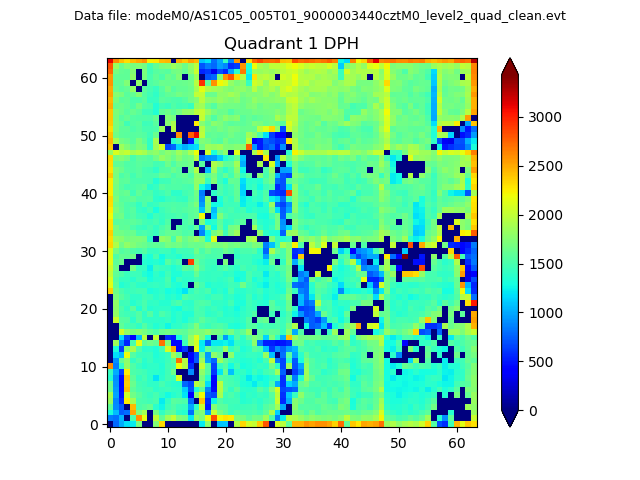 |
Quadrant B |
|---|---|---|---|
| Quadrant D |  |
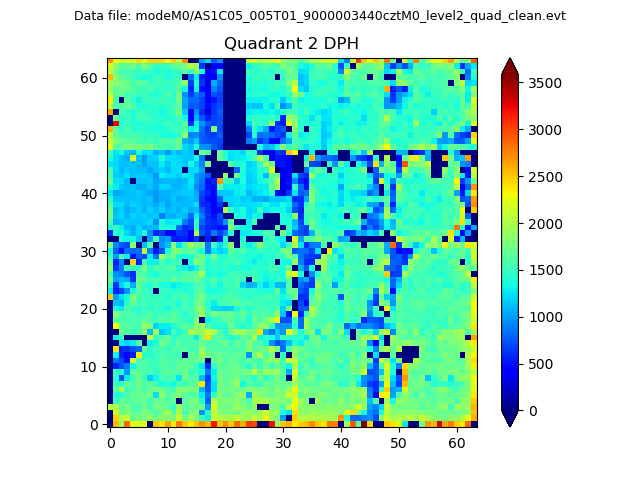 |
Quadrant C |
| Plot type | Count rate plots | Images |
|---|---|---|
| Comparison with Poisson distribution Blue bars denote a histogram of data divided into 1 sec bins. Red curve is a Poisson curve with rate = median count rate of data. |
 |
 |
| Quadrant-wise count rates Data is divided into 100 sec bins |
 |
|
| Module-wise count rates for Quadrant A Data is divided into 100 sec bins |
 |
 |
| Module-wise count rates for Quadrant B Data is divided into 100 sec bins |
 |
 |
| Module-wise count rates for Quadrant C Data is divided into 100 sec bins |
 |
 |
| Module-wise count rates for Quadrant D Data is divided into 100 sec bins |
 |
 |
| Parameter | Plot |
|---|---|
| CZT HV Monitor |  |
| D_VDD |  |
| Temperature 1 |  |
| Veto HV Monitor |  |
| Veto LLD |  |
| Alpha Counter |  |
| _CPM_Rate |  |
| CZT Counter |  |
| +2.5 Volts monitor |  |
| +5 Volts monitor |  |
| _ROLL_ROT |  |
| _Roll_DEC |  |
| _Roll_RA |  |
| Veto Counter |  |