| Param | Original file | Final file |
|---|---|---|
| Filename | modeM0/AS1C05_005T01_9000003440_23273cztM0_level2.evt | modeM0/AS1C05_005T01_9000003440_23273cztM0_level2_quad_clean.evt |
| Size (bytes) | 539,256,960 | 75,507,840 |
| Size | 514.3 MB | 72.0 MB |
| Events in quadrant A | 3,325,726 | 482,300 |
| Events in quadrant B | 3,354,776 | 487,488 |
| Events in quadrant C | 3,332,191 | 461,363 |
| Events in quadrant D | 5,885,143 | 408,757 |
| Mode SS | |||
|---|---|---|---|
| Quadrant | BADHDUFLAG | Total packets | Discarded packets |
| A | 0 | 130 | 0 |
| B | 0 | 130 | 0 |
| C | 0 | 130 | 0 |
| D | 0 | 130 | 0 |
| Mode M9 | |||
|---|---|---|---|
| Quadrant | BADHDUFLAG | Total packets | Discarded packets |
| A | 0 | 12 | 0 |
| B | 0 | 12 | 0 |
| C | 0 | 12 | 0 |
| D | 0 | 12 | 0 |
| Mode M0 | |||
|---|---|---|---|
| Quadrant | BADHDUFLAG | Total packets | Discarded packets |
| A | 0 | 13962 | 2 |
| B | 0 | 14036 | 2 |
| C | 0 | 13835 | 2 |
| D | 0 | 21946 | 5 |
| Quadrant | Total seconds | Saturated seconds | Saturation percentage |
|---|---|---|---|
| A | 6394 | 91 | 1.423209% |
| B | 6395 | 79 | 1.235340% |
| C | 6395 | 95 | 1.485536% |
| D | 6394 | 723 | 11.307476% |
Noise dominated data is calculated using 1-second bins in cleaned event files. If a bin has >2000 counts, and if more than 50% of those come from <1% of pixels, then it is considered to be noise-dominated and hence unusable.
| Quadrant | # 1 sec bins | Bins with >0 counts | Bins with >2000 counts | High rate bins dominated by noise | Noise dominated (total time) | Noise dominated (detector-on time) | Marked lightcurve |
|---|---|---|---|---|---|---|---|
| A | 7569 | 6394 | 10 | 10 | 0.13% | 0.16% | 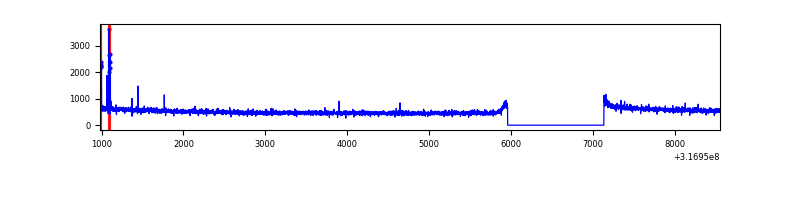 |
| B | 7570 | 6395 | 3 | 3 | 0.04% | 0.05% | 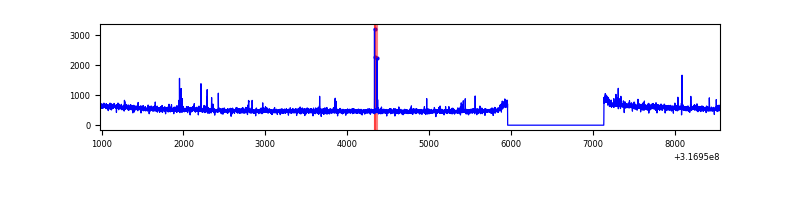 |
| C | 7570 | 6395 | 0 | 0 | 0.00% | 0.00% | 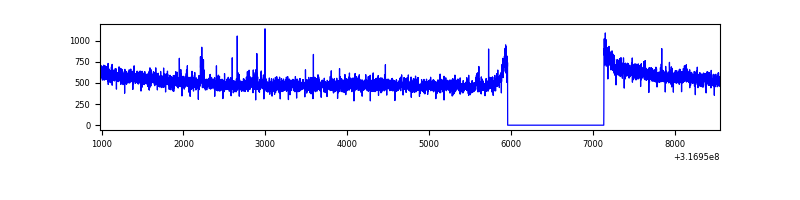 |
| D | 7569 | 6394 | 625 | 625 | 8.26% | 9.77% | 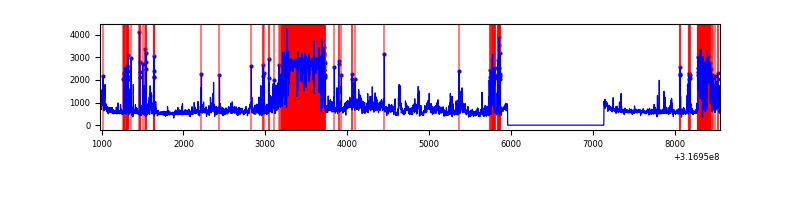 |
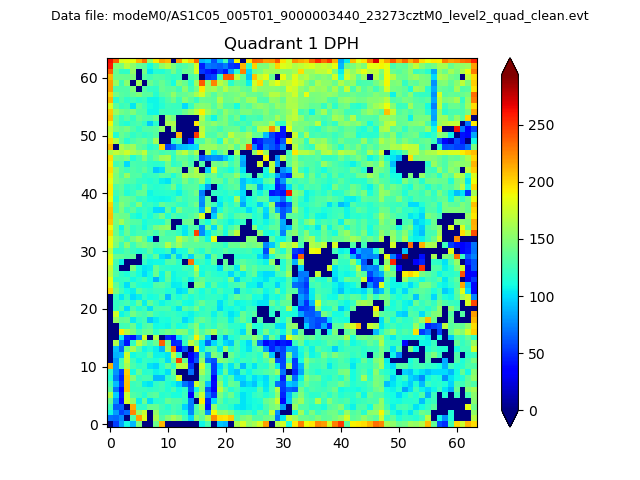
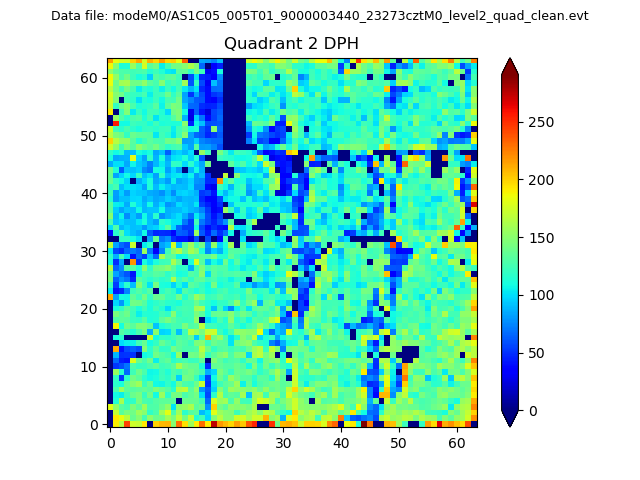
Top three noisy pixels from each quadrant. If the there are fewer than three noisy pixels in the level2.evt file, extra rows are filled as -1
| Pixel properties | Quadrant properties | ||||||
|---|---|---|---|---|---|---|---|
| Quadrant | DetID | PixID | Counts | Sigma | Mean | Median | Sigma |
| A | 6 | 16 | 34116 | 196.87 | 854 | 837 | 169.0 |
| A | 13 | 254 | 10744 | 58.61 | 854 | 837 | 169.0 |
| A | 0 | 226 | 7545 | 39.68 | 854 | 837 | 169.0 |
| B | 12 | 111 | 18530 | 113.03 | 843 | 825 | 156.6 |
| B | 11 | 111 | 16293 | 98.75 | 843 | 825 | 156.6 |
| B | 0 | 190 | 15704 | 94.99 | 843 | 825 | 156.6 |
| C | 14 | 238 | 131048 | 702.77 | 808 | 814 | 185.3 |
| C | 0 | 207 | 18476 | 95.31 | 808 | 814 | 185.3 |
| C | 7 | 247 | 16702 | 85.74 | 808 | 814 | 185.3 |
| D | 1 | 52 | 1284382 | 6730.07 | 784 | 759 | 190.7 |
| D | 12 | 233 | 1232706 | 6459.13 | 784 | 759 | 190.7 |
| D | 7 | 238 | 268127 | 1401.82 | 784 | 759 | 190.7 |
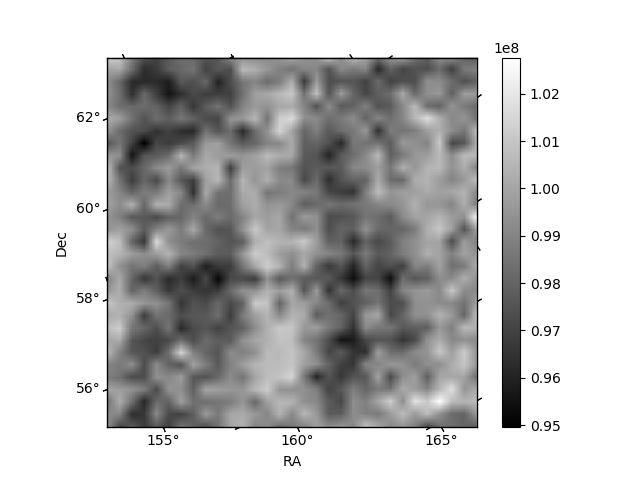
Histogram calculated using DETX and DETY for each event in the final _common_clean file
| Quadrant A | 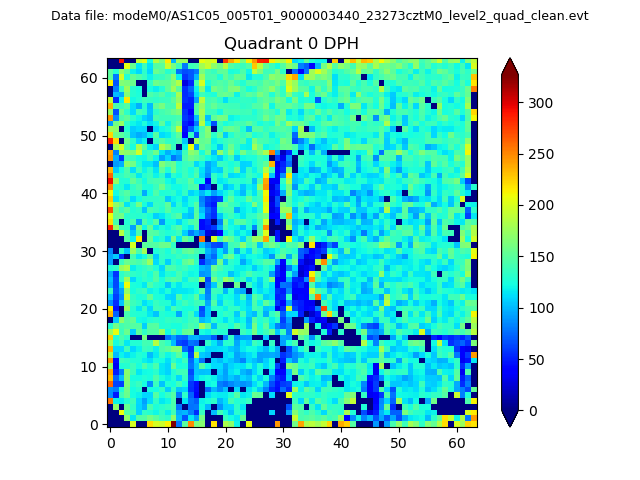 |
 |
Quadrant B |
|---|---|---|---|
| Quadrant D | 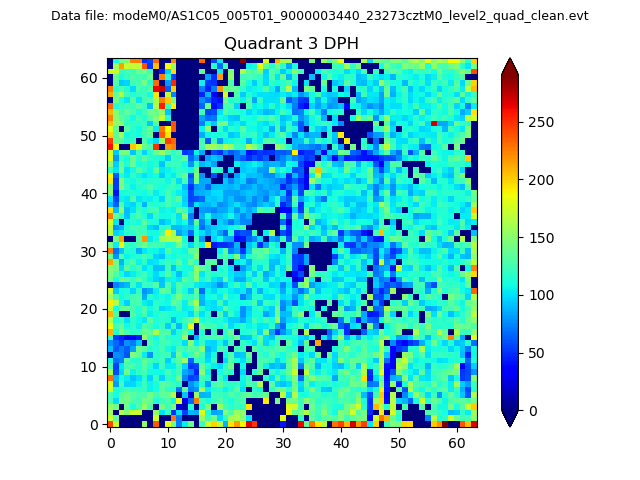 |
 |
Quadrant C |
| Plot type | Count rate plots | Images |
|---|---|---|
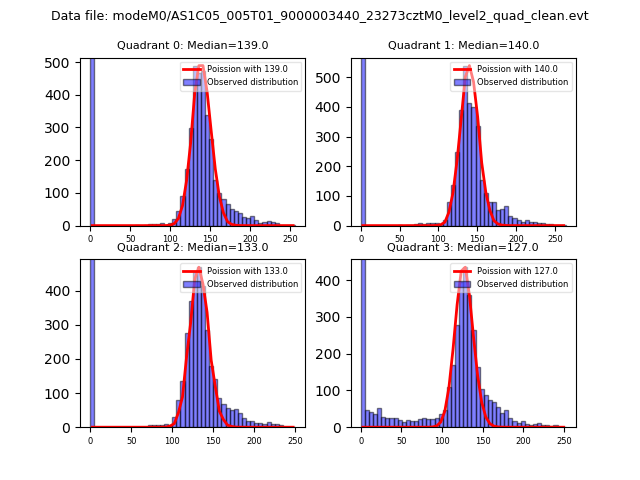
| Comparison with Poisson distribution Blue bars denote a histogram of data divided into 1 sec bins. Red curve is a Poisson curve with rate = median count rate of data. |
 |
 |
| Quadrant-wise count rates Data is divided into 100 sec bins |
 |
|
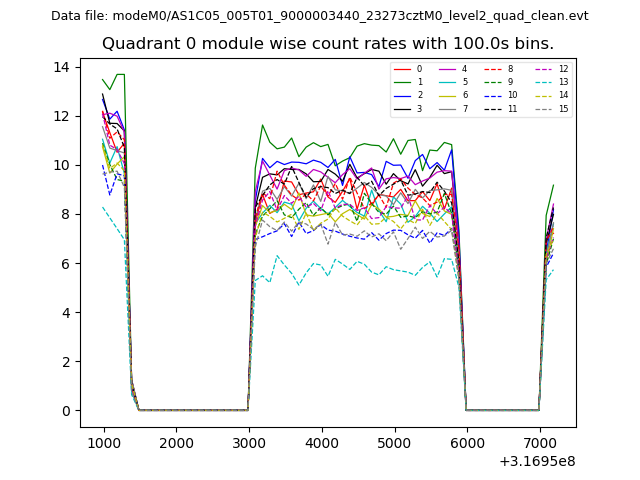
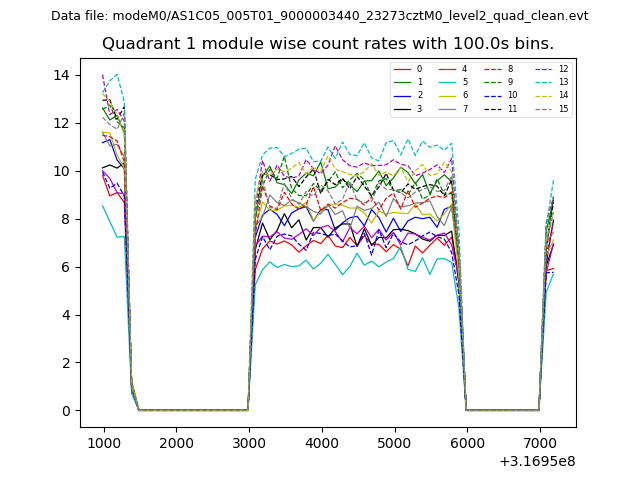
| Module-wise count rates for Quadrant A Data is divided into 100 sec bins |
 |
 |
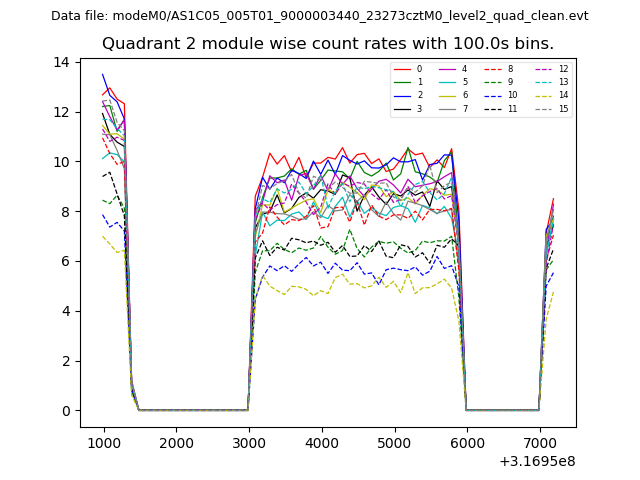
| Module-wise count rates for Quadrant B Data is divided into 100 sec bins |
 |
 |
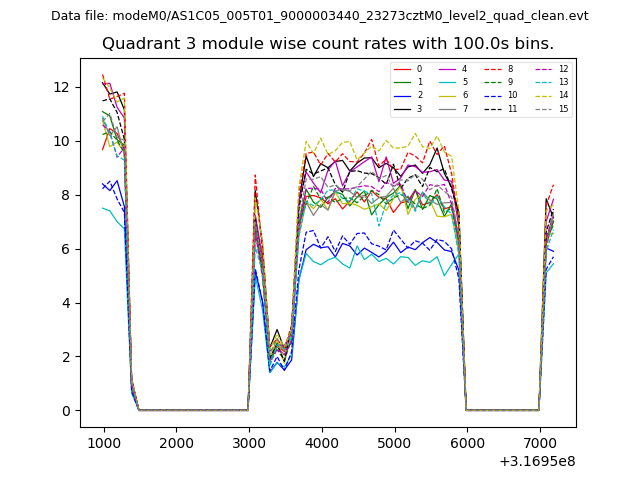
| Module-wise count rates for Quadrant C Data is divided into 100 sec bins |
 |
 |
| Module-wise count rates for Quadrant D Data is divided into 100 sec bins |
 |
 |
| Parameter | Plot |
|---|---|
| CZT HV Monitor | 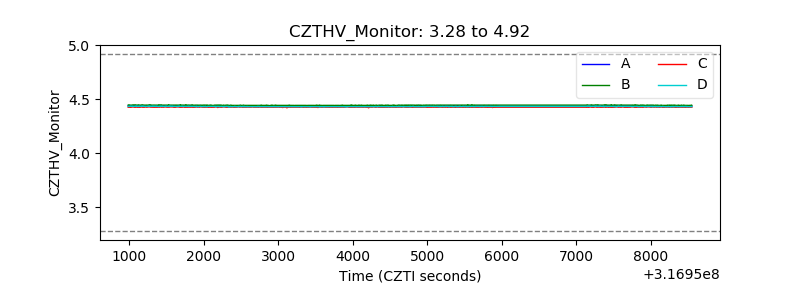 |
| D_VDD | 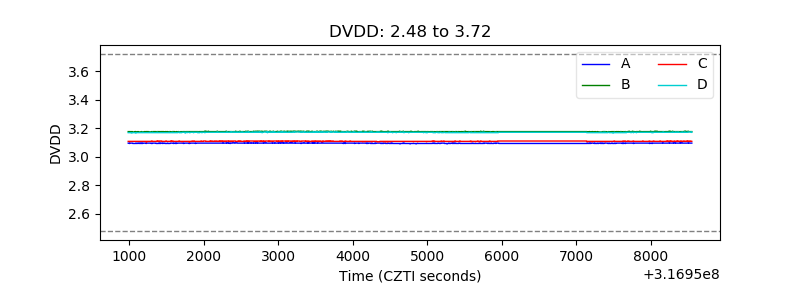 |
| Temperature 1 | 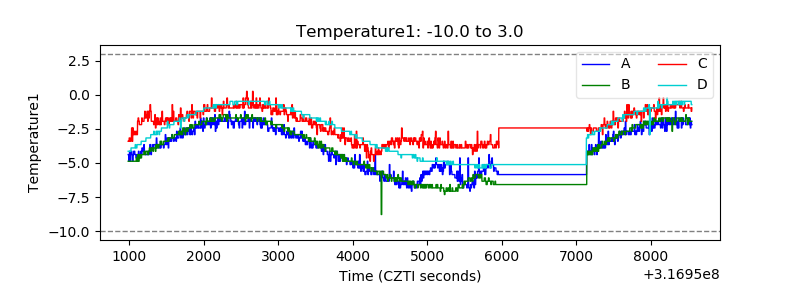 |
| Veto HV Monitor | 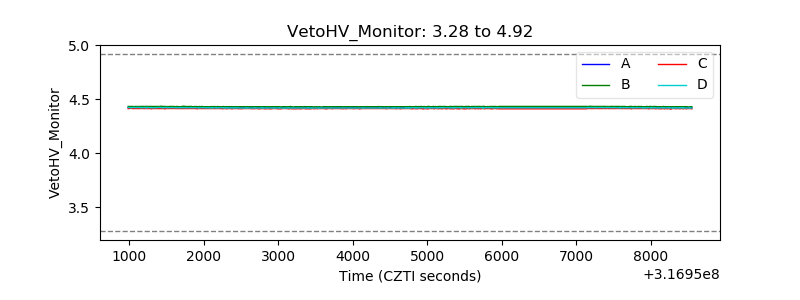 |
| Veto LLD | 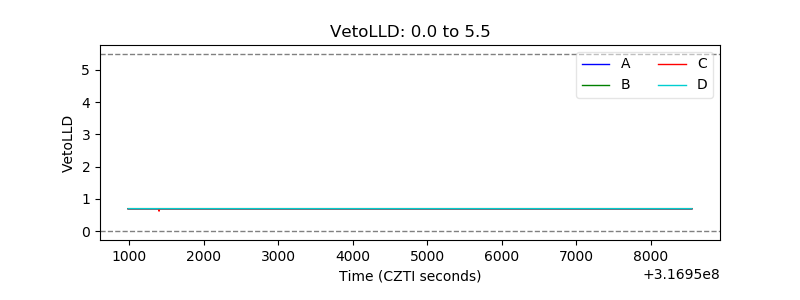 |
| Alpha Counter | 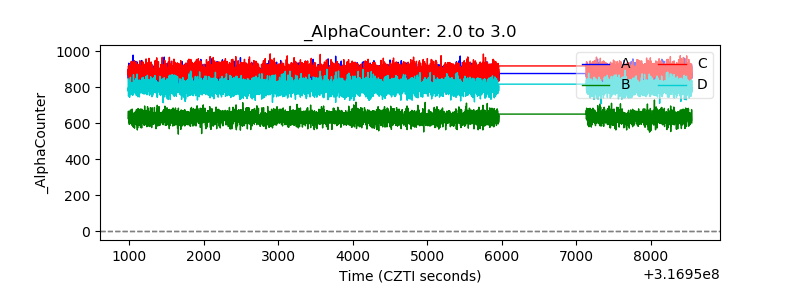 |
| _CPM_Rate |  |
| CZT Counter | 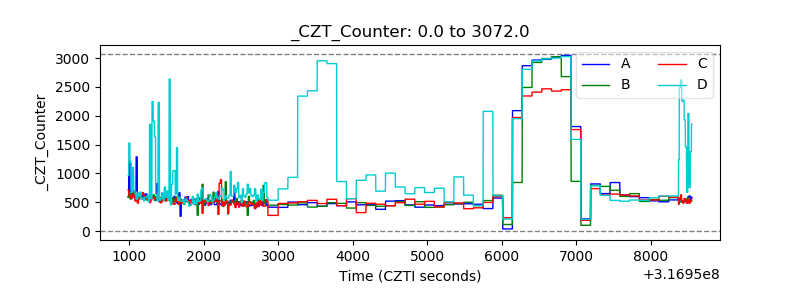 |
| +2.5 Volts monitor |  |
| +5 Volts monitor |  |
| _ROLL_ROT | 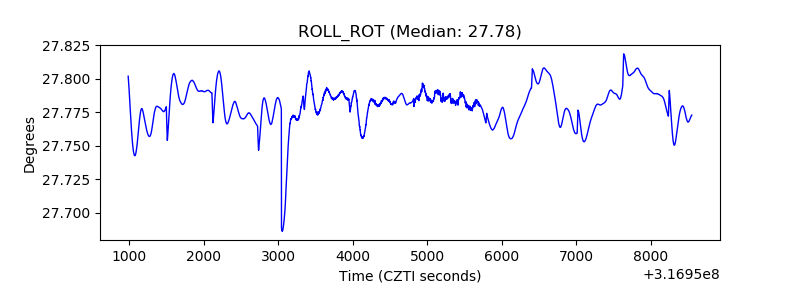 |
| _Roll_DEC | 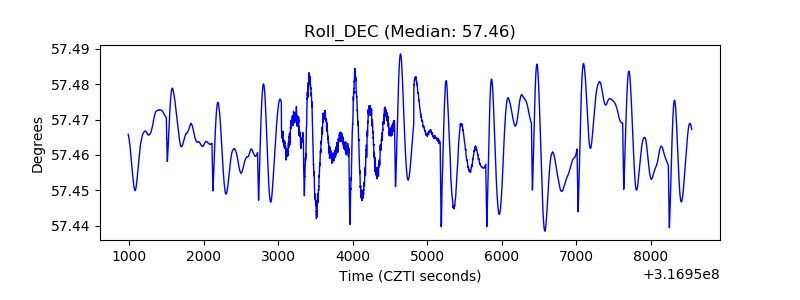 |
| _Roll_RA | 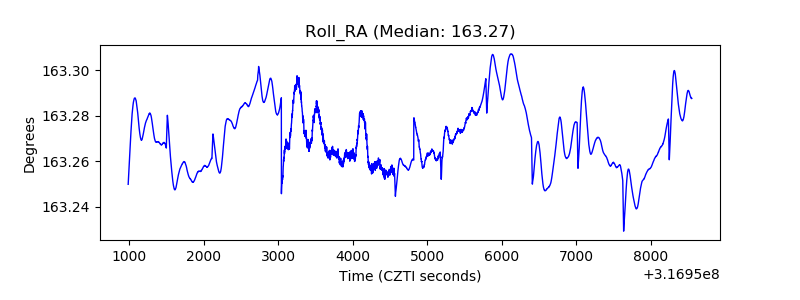 |
| Veto Counter | 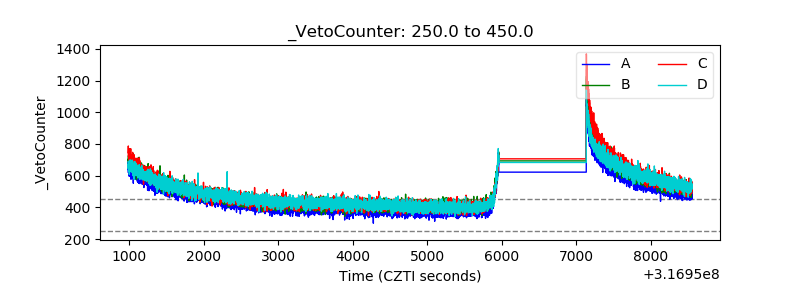 |