| Param | Original file | Final file |
|---|---|---|
| Filename | modeM0/AS1C05_005T01_9000003440_23274cztM0_level2.evt | modeM0/AS1C05_005T01_9000003440_23274cztM0_level2_quad_clean.evt |
| Size (bytes) | 534,245,760 | 75,510,720 |
| Size | 509.5 MB | 72.0 MB |
| Events in quadrant A | 3,390,258 | 473,509 |
| Events in quadrant B | 3,471,110 | 477,971 |
| Events in quadrant C | 3,502,607 | 455,820 |
| Events in quadrant D | 5,385,493 | 436,218 |
| Mode SS | |||
|---|---|---|---|
| Quadrant | BADHDUFLAG | Total packets | Discarded packets |
| A | 0 | 130 | 0 |
| B | 0 | 130 | 0 |
| C | 0 | 130 | 0 |
| D | 0 | 130 | 0 |
| Mode M9 | |||
|---|---|---|---|
| Quadrant | BADHDUFLAG | Total packets | Discarded packets |
| A | 0 | 13 | 0 |
| B | 0 | 13 | 0 |
| C | 0 | 13 | 0 |
| D | 0 | 13 | 0 |
| Mode M0 | |||
|---|---|---|---|
| Quadrant | BADHDUFLAG | Total packets | Discarded packets |
| A | 0 | 14254 | 2 |
| B | 0 | 14424 | 2 |
| C | 0 | 14432 | 2 |
| D | 0 | 20419 | 2 |
| Quadrant | Total seconds | Saturated seconds | Saturation percentage |
|---|---|---|---|
| A | 6343 | 49 | 0.772505% |
| B | 6343 | 53 | 0.835567% |
| C | 6344 | 85 | 1.339849% |
| D | 6344 | 566 | 8.921816% |
Noise dominated data is calculated using 1-second bins in cleaned event files. If a bin has >2000 counts, and if more than 50% of those come from <1% of pixels, then it is considered to be noise-dominated and hence unusable.
| Quadrant | # 1 sec bins | Bins with >0 counts | Bins with >2000 counts | High rate bins dominated by noise | Noise dominated (total time) | Noise dominated (detector-on time) | Marked lightcurve |
|---|---|---|---|---|---|---|---|
| A | 7658 | 6343 | 0 | 0 | 0.00% | 0.00% | 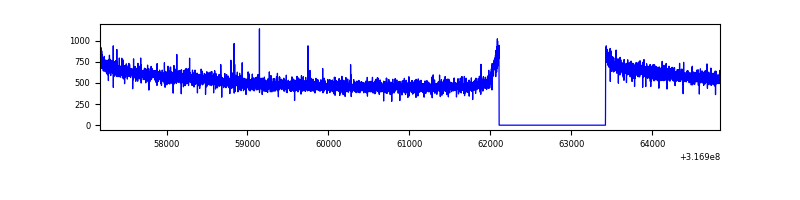 |
| B | 7658 | 6344 | 3 | 3 | 0.04% | 0.05% | 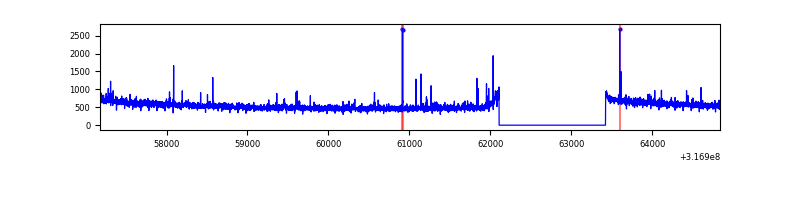 |
| C | 7659 | 6344 | 0 | 0 | 0.00% | 0.00% | 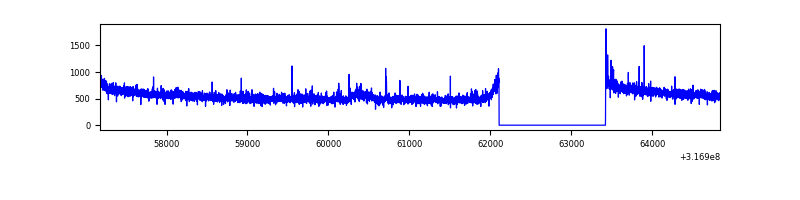 |
| D | 7659 | 6345 | 470 | 470 | 6.14% | 7.41% | 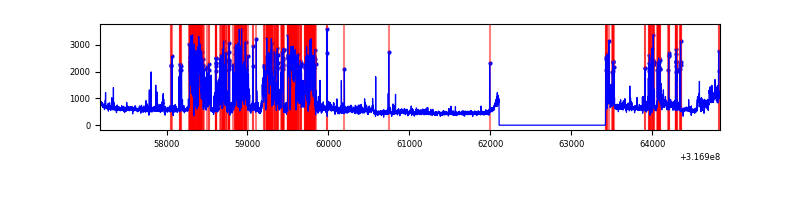 |
Top three noisy pixels from each quadrant. If the there are fewer than three noisy pixels in the level2.evt file, extra rows are filled as -1
| Pixel properties | Quadrant properties | ||||||
|---|---|---|---|---|---|---|---|
| Quadrant | DetID | PixID | Counts | Sigma | Mean | Median | Sigma |
| A | 13 | 254 | 10557 | 56.26 | 879 | 864 | 172.3 |
| A | 0 | 226 | 7637 | 39.31 | 879 | 864 | 172.3 |
| A | 3 | 137 | 6855 | 34.78 | 879 | 864 | 172.3 |
| B | 3 | 64 | 25058 | 149.65 | 871 | 852 | 161.7 |
| B | 12 | 111 | 18240 | 107.5 | 871 | 852 | 161.7 |
| B | 0 | 229 | 17370 | 102.12 | 871 | 852 | 161.7 |
| C | 14 | 238 | 137238 | 708.73 | 841 | 849 | 192.4 |
| C | 0 | 207 | 39595 | 201.34 | 841 | 849 | 192.4 |
| C | 8 | 208 | 24270 | 121.71 | 841 | 849 | 192.4 |
| D | 1 | 52 | 1686425 | 8447.66 | 833 | 809 | 199.5 |
| D | 7 | 238 | 287144 | 1435.0 | 833 | 809 | 199.5 |
| D | 7 | 38 | 135297 | 674.0 | 833 | 809 | 199.5 |
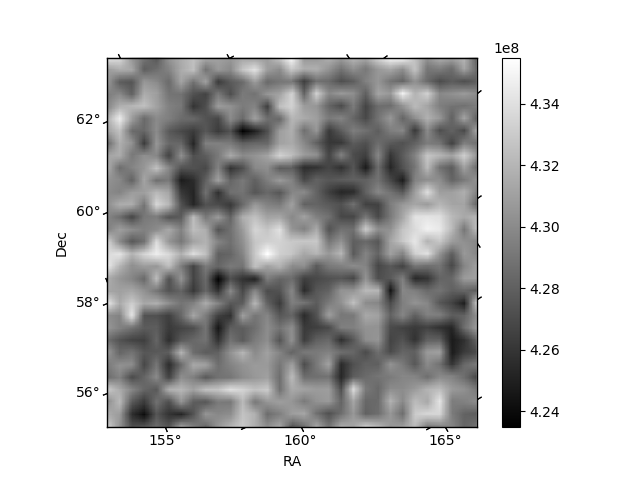
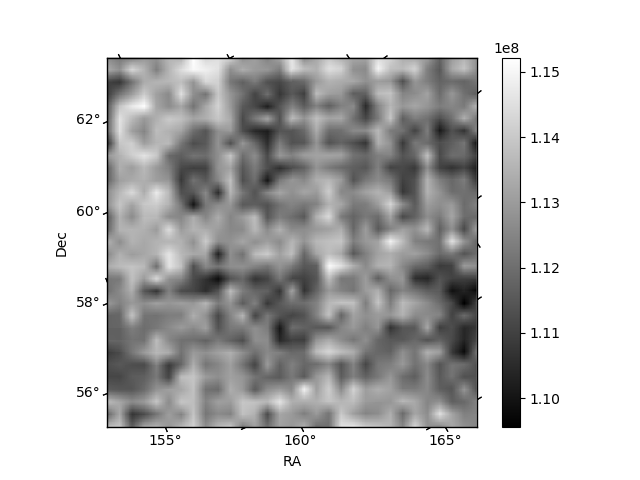
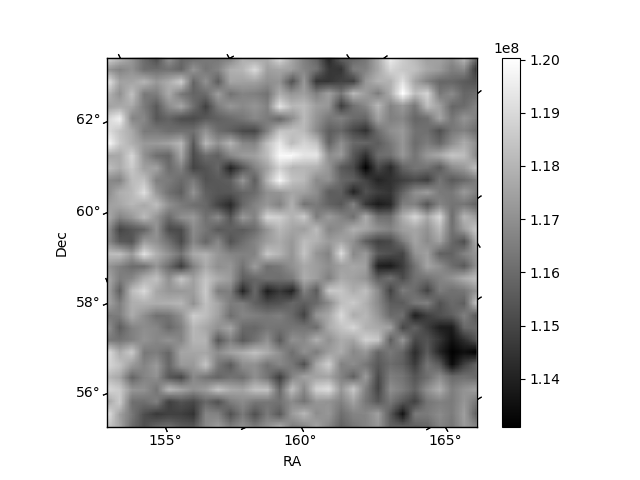
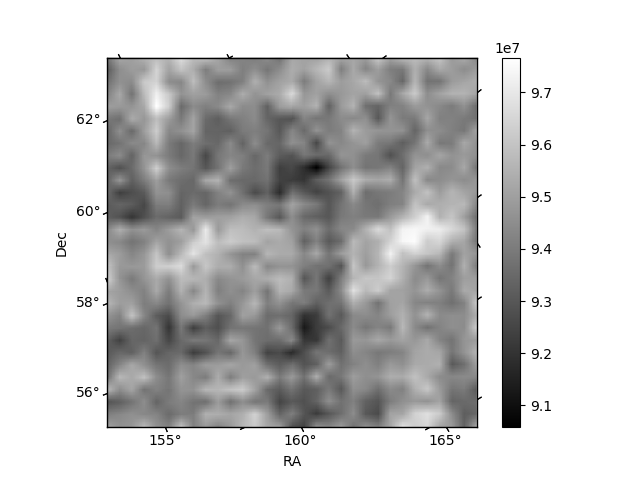
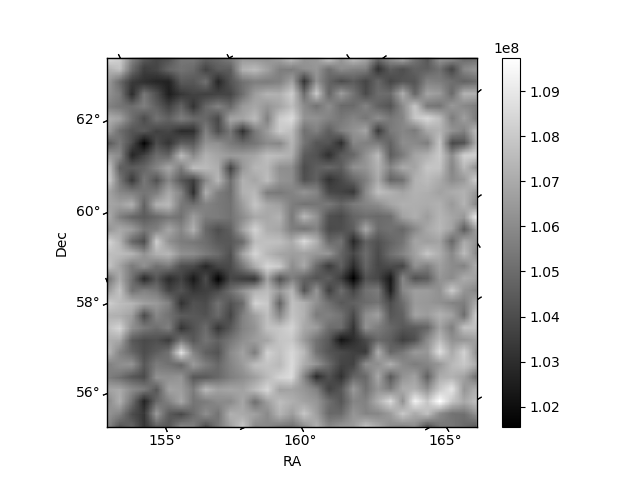
Histogram calculated using DETX and DETY for each event in the final _common_clean file
| Quadrant A | 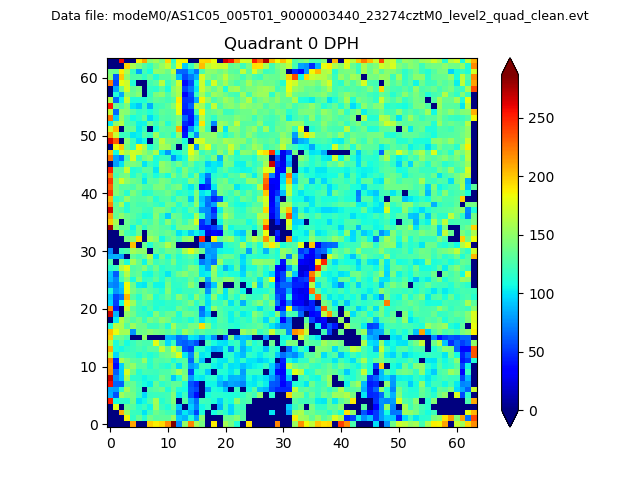 |
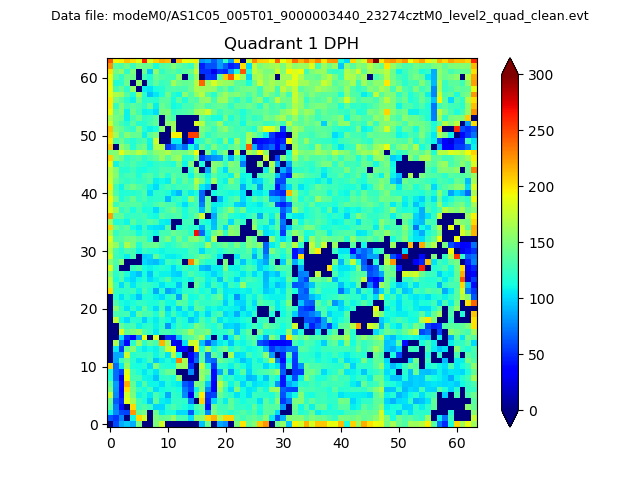 |
Quadrant B |
|---|---|---|---|
| Quadrant D | 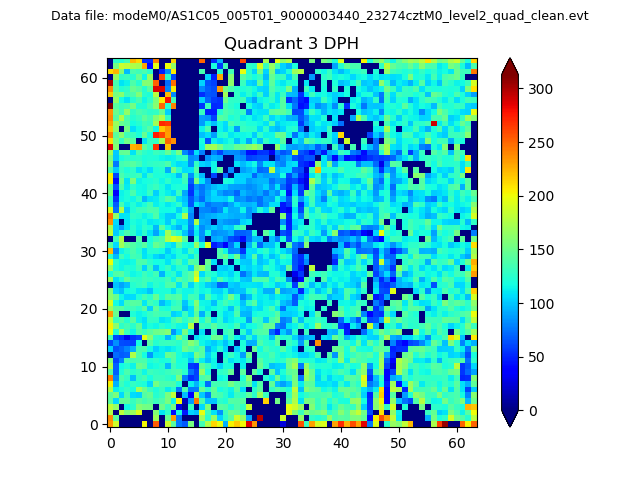 |
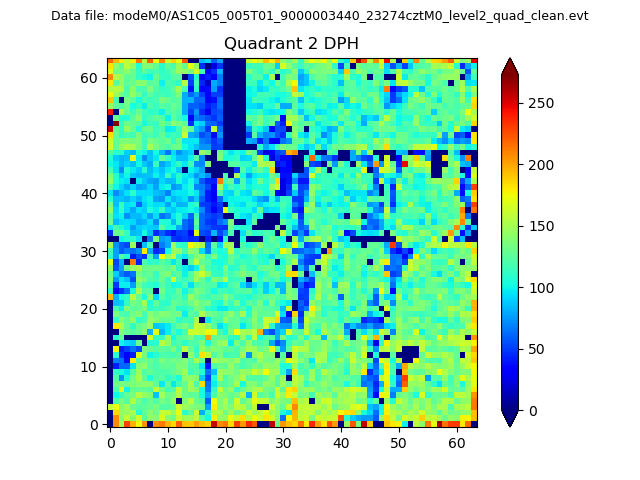 |
Quadrant C |
| Plot type | Count rate plots | Images |
|---|---|---|
| Comparison with Poisson distribution Blue bars denote a histogram of data divided into 1 sec bins. Red curve is a Poisson curve with rate = median count rate of data. |
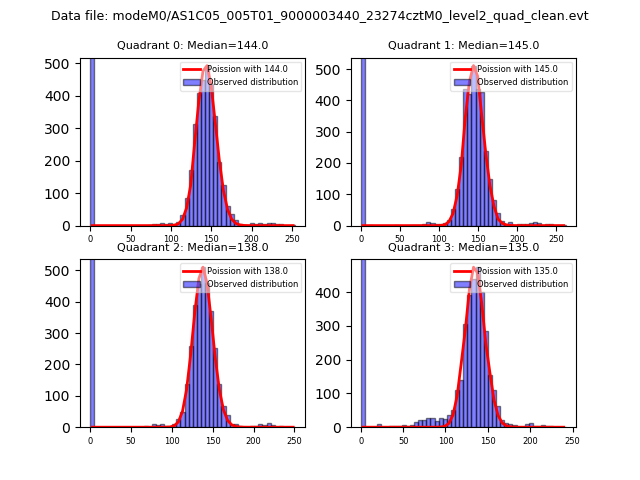 |
 |
| Quadrant-wise count rates Data is divided into 100 sec bins |
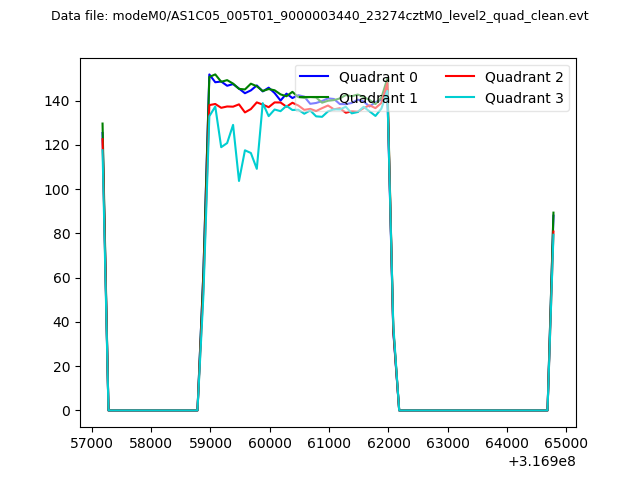 |
|
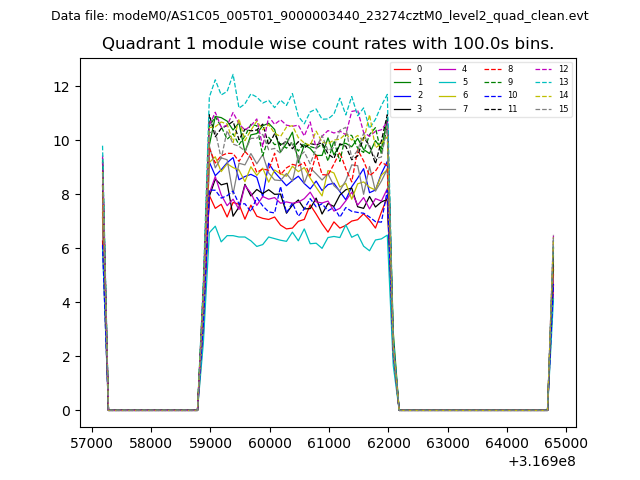
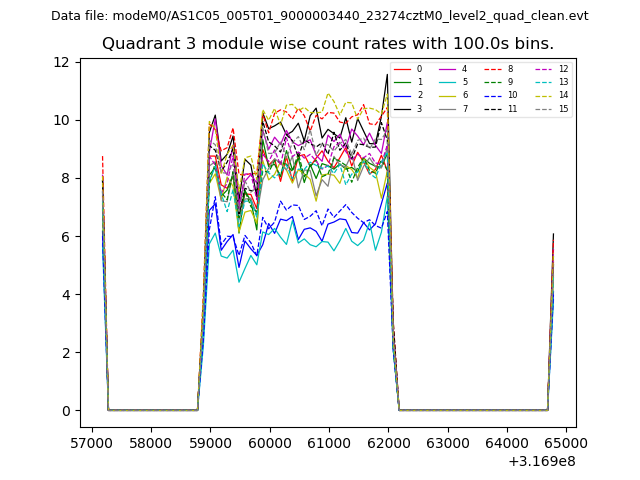
| Module-wise count rates for Quadrant A Data is divided into 100 sec bins |
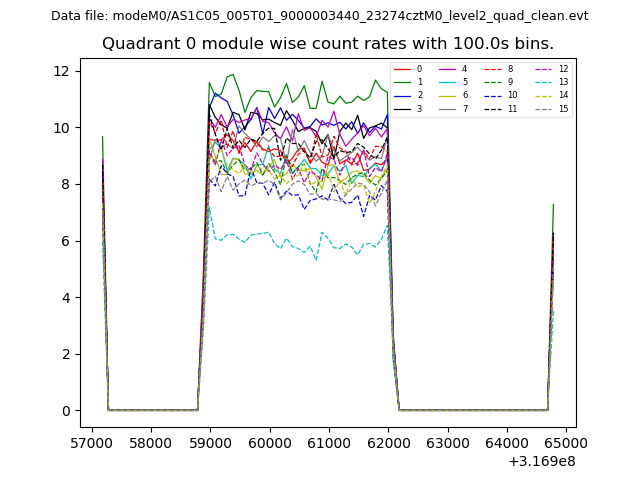 |
 |
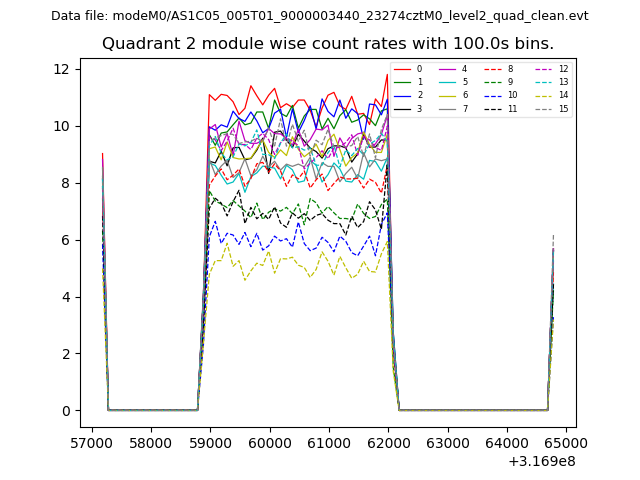
| Module-wise count rates for Quadrant B Data is divided into 100 sec bins |
 |
 |
| Module-wise count rates for Quadrant C Data is divided into 100 sec bins |
 |
 |
| Module-wise count rates for Quadrant D Data is divided into 100 sec bins |
 |
 |
| Parameter | Plot |
|---|---|
| CZT HV Monitor | 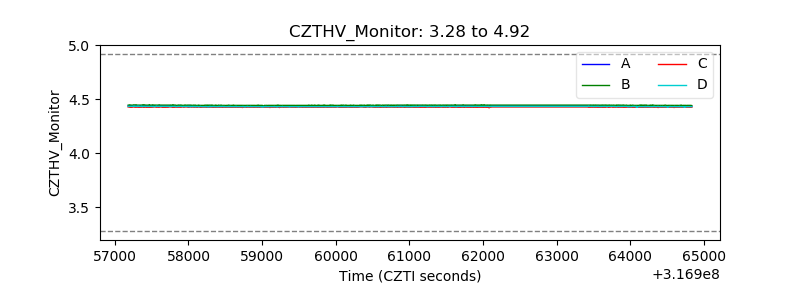 |
| D_VDD | 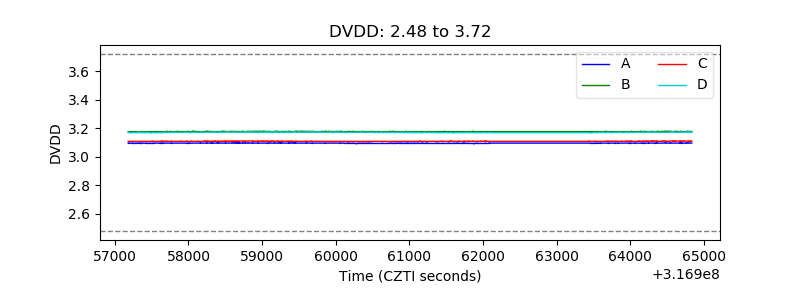 |
| Temperature 1 | 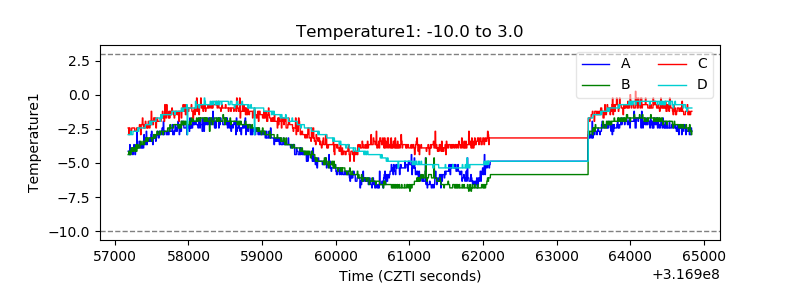 |
| Veto HV Monitor | 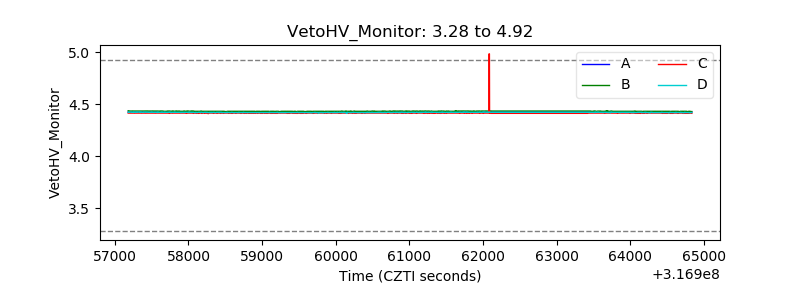 |
| Veto LLD | 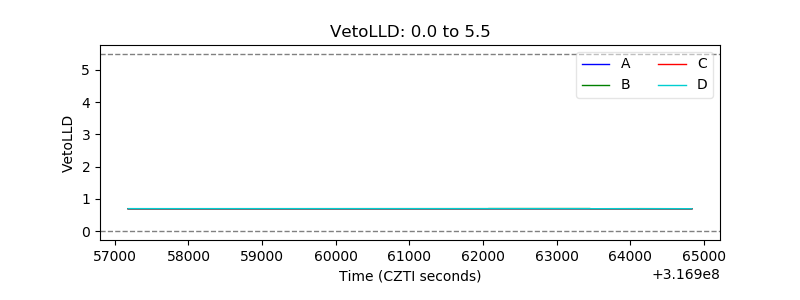 |
| Alpha Counter | 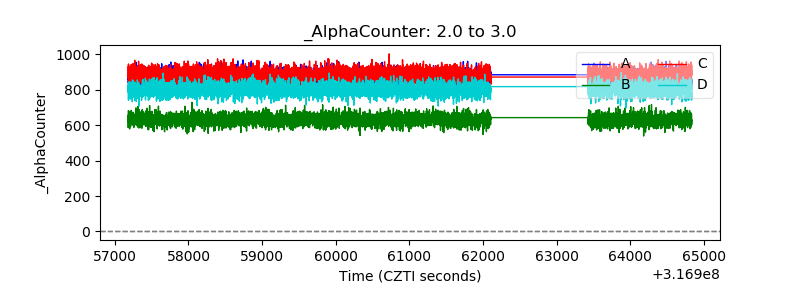 |
| _CPM_Rate | 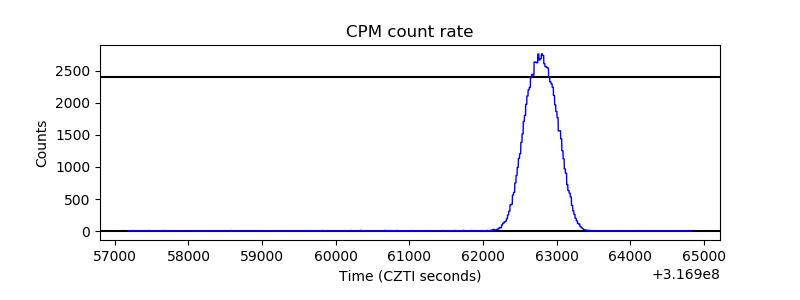 |
| CZT Counter |  |
| +2.5 Volts monitor |  |
| +5 Volts monitor |  |
| _ROLL_ROT | 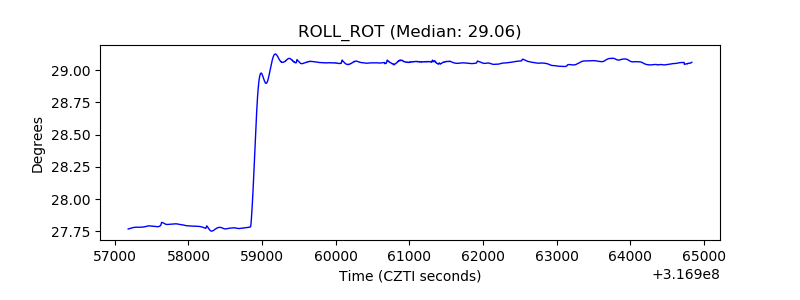 |
| _Roll_DEC | 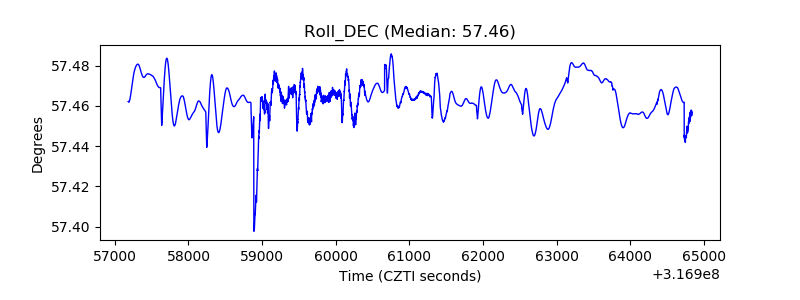 |
| _Roll_RA |  |
| Veto Counter | 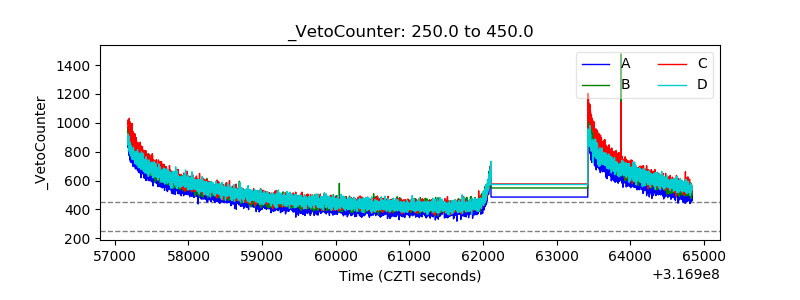 |