| Param | Original file | Final file |
|---|---|---|
| Filename | modeM0/AS1C05_005T01_9000003440_23275cztM0_level2.evt | modeM0/AS1C05_005T01_9000003440_23275cztM0_level2_quad_clean.evt |
| Size (bytes) | 520,655,040 | 88,490,880 |
| Size | 496.5 MB | 84.4 MB |
| Events in quadrant A | 3,352,036 | 573,234 |
| Events in quadrant B | 3,505,850 | 581,110 |
| Events in quadrant C | 3,461,087 | 555,784 |
| Events in quadrant D | 5,029,565 | 537,607 |
| Mode SS | |||
|---|---|---|---|
| Quadrant | BADHDUFLAG | Total packets | Discarded packets |
| A | 0 | 126 | 0 |
| B | 0 | 126 | 0 |
| C | 0 | 126 | 0 |
| D | 0 | 126 | 0 |
| Mode M9 | |||
|---|---|---|---|
| Quadrant | BADHDUFLAG | Total packets | Discarded packets |
| A | 0 | 22 | 0 |
| B | 0 | 23 | 0 |
| C | 0 | 23 | 0 |
| D | 0 | 23 | 0 |
| Mode M0 | |||
|---|---|---|---|
| Quadrant | BADHDUFLAG | Total packets | Discarded packets |
| A | 0 | 14034 | 2 |
| B | 0 | 14445 | 3 |
| C | 0 | 14324 | 2 |
| D | 0 | 19237 | 2 |
| Quadrant | Total seconds | Saturated seconds | Saturation percentage |
|---|---|---|---|
| A | 6188 | 98 | 1.583710% |
| B | 6187 | 141 | 2.278972% |
| C | 6187 | 145 | 2.343624% |
| D | 6187 | 424 | 6.853079% |
Noise dominated data is calculated using 1-second bins in cleaned event files. If a bin has >2000 counts, and if more than 50% of those come from <1% of pixels, then it is considered to be noise-dominated and hence unusable.
| Quadrant | # 1 sec bins | Bins with >0 counts | Bins with >2000 counts | High rate bins dominated by noise | Noise dominated (total time) | Noise dominated (detector-on time) | Marked lightcurve |
|---|---|---|---|---|---|---|---|
| A | 7488 | 6188 | 0 | 0 | 0.00% | 0.00% | 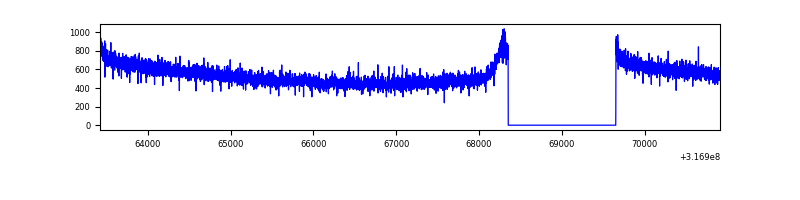 |
| B | 7487 | 6187 | 25 | 25 | 0.33% | 0.40% | 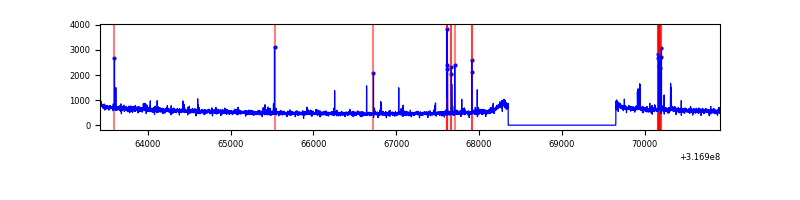 |
| C | 7487 | 6187 | 0 | 0 | 0.00% | 0.00% | 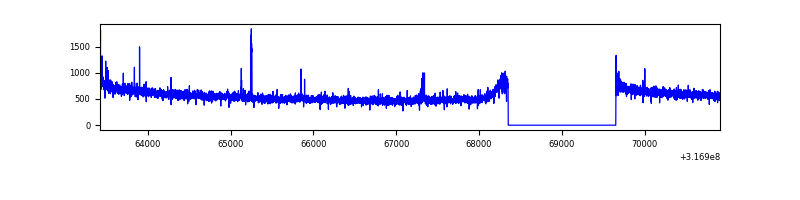 |
| D | 7487 | 6187 | 301 | 301 | 4.02% | 4.87% | 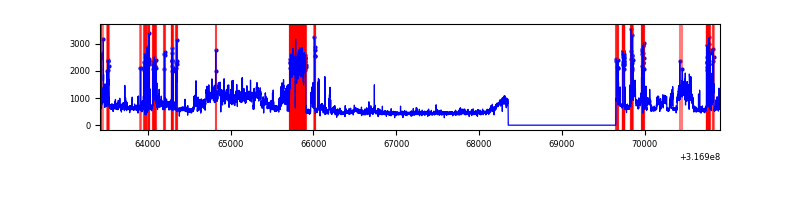 |
Top three noisy pixels from each quadrant. If the there are fewer than three noisy pixels in the level2.evt file, extra rows are filled as -1
| Pixel properties | Quadrant properties | ||||||
|---|---|---|---|---|---|---|---|
| Quadrant | DetID | PixID | Counts | Sigma | Mean | Median | Sigma |
| A | 13 | 254 | 10701 | 57.44 | 869 | 854 | 171.4 |
| A | 0 | 226 | 7500 | 38.77 | 869 | 854 | 171.4 |
| A | 3 | 137 | 6754 | 34.42 | 869 | 854 | 171.4 |
| B | 4 | 200 | 62687 | 389.11 | 862 | 844 | 158.9 |
| B | 5 | 172 | 43574 | 268.85 | 862 | 844 | 158.9 |
| B | 12 | 111 | 17967 | 107.74 | 862 | 844 | 158.9 |
| C | 14 | 238 | 136234 | 711.29 | 838 | 845 | 190.3 |
| C | 7 | 247 | 20791 | 104.79 | 838 | 845 | 190.3 |
| C | 3 | 233 | 14083 | 69.55 | 838 | 845 | 190.3 |
| D | 1 | 52 | 976292 | 4806.71 | 841 | 819 | 202.9 |
| D | 7 | 238 | 530054 | 2607.84 | 841 | 819 | 202.9 |
| D | 12 | 233 | 198795 | 975.54 | 841 | 819 | 202.9 |
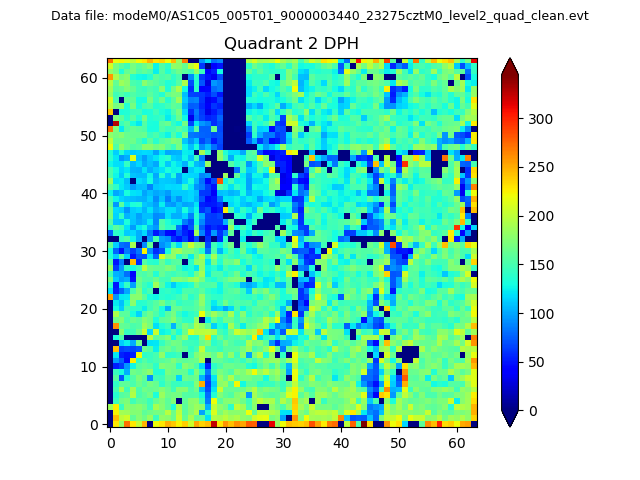
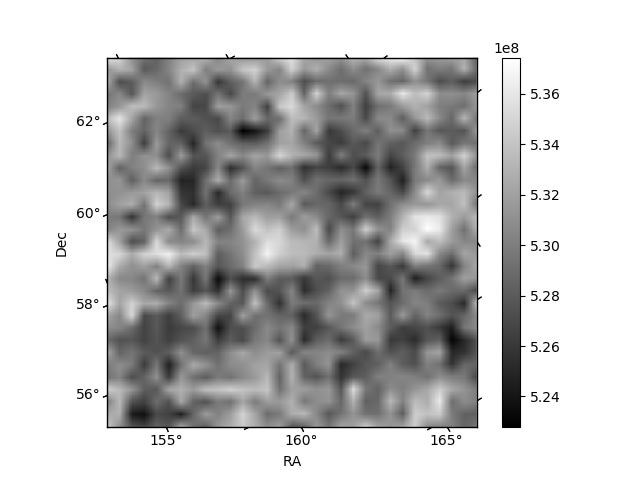
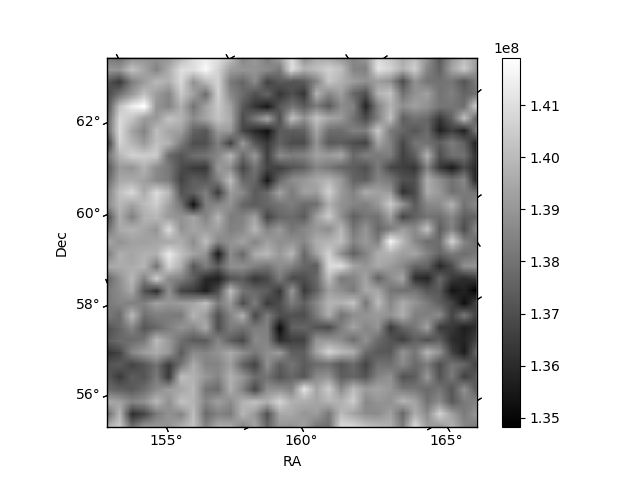
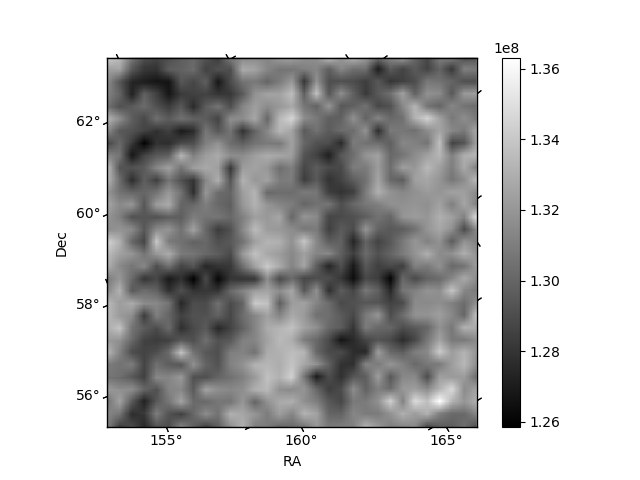
Histogram calculated using DETX and DETY for each event in the final _common_clean file
| Quadrant A | 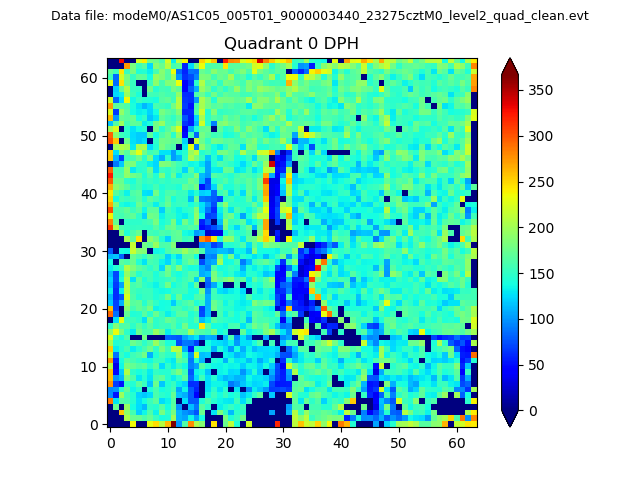 |
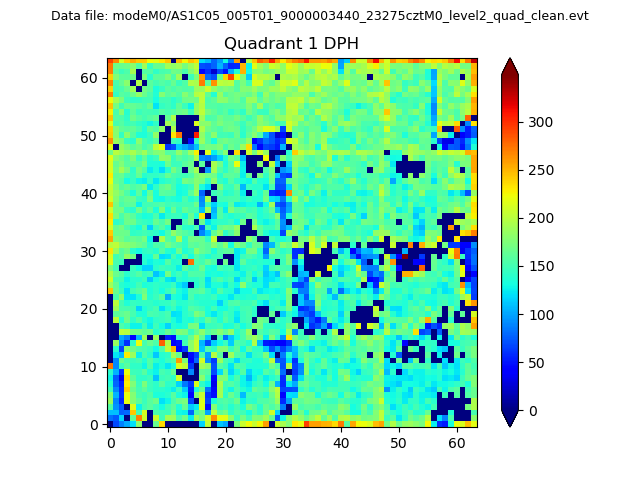 |
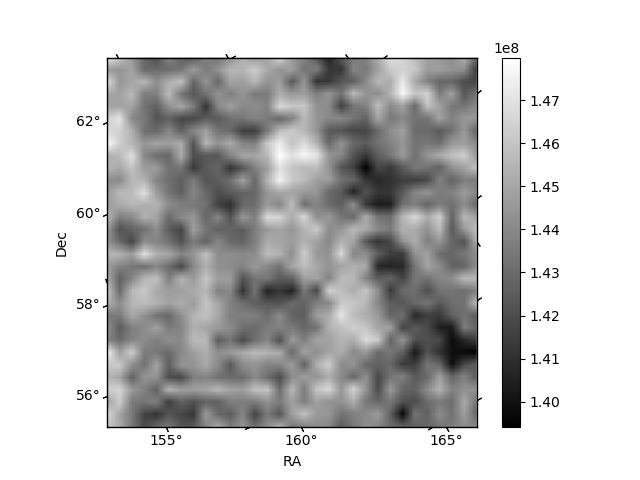
Quadrant B |
|---|---|---|---|
| Quadrant D | 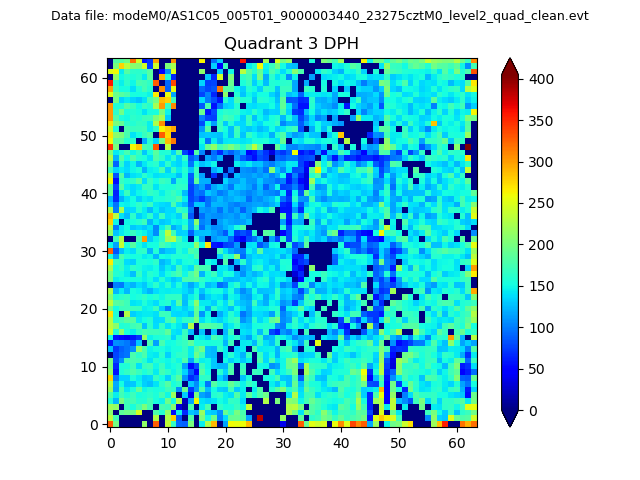 |
 |
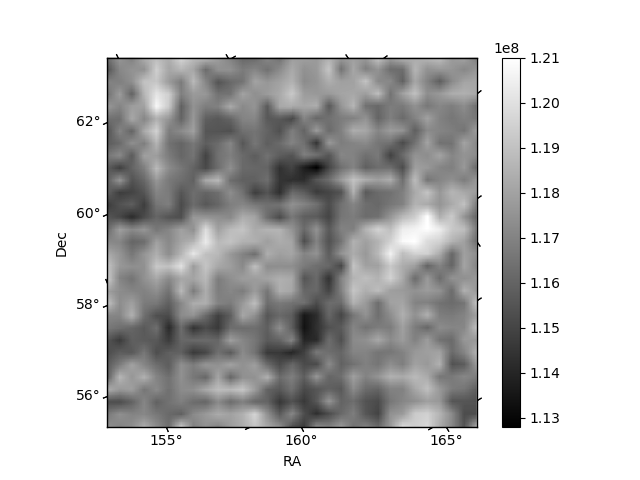
Quadrant C |
| Plot type | Count rate plots | Images |
|---|---|---|
| Comparison with Poisson distribution Blue bars denote a histogram of data divided into 1 sec bins. Red curve is a Poisson curve with rate = median count rate of data. |
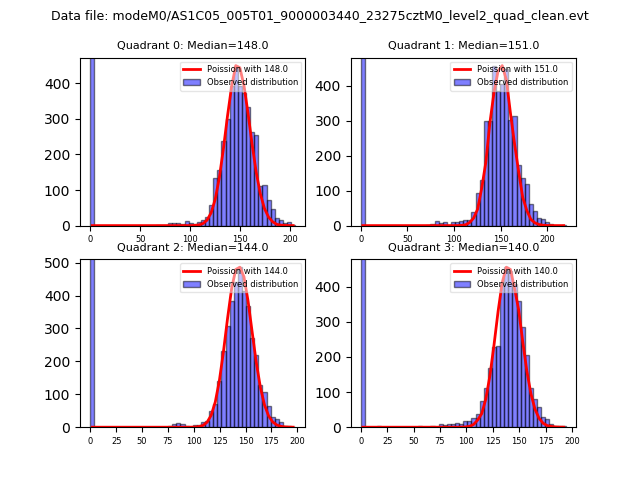 |
 |
| Quadrant-wise count rates Data is divided into 100 sec bins |
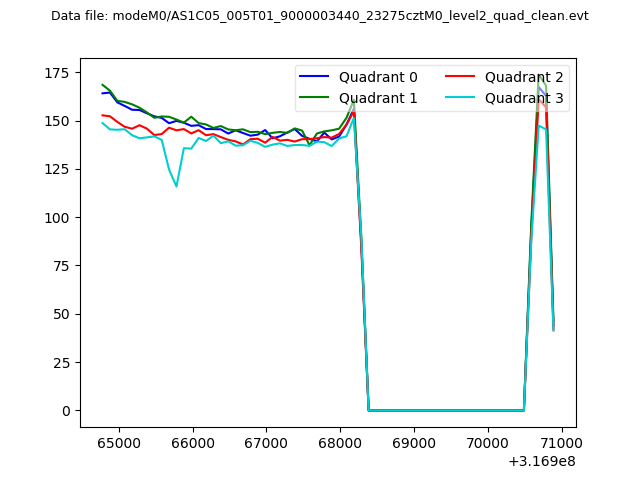 |
|
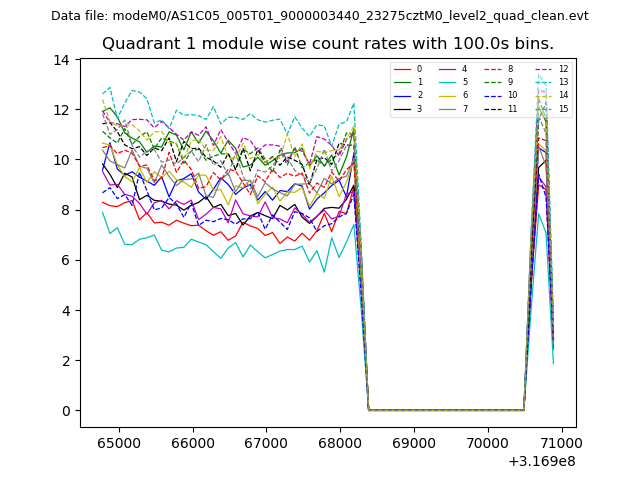
| Module-wise count rates for Quadrant A Data is divided into 100 sec bins |
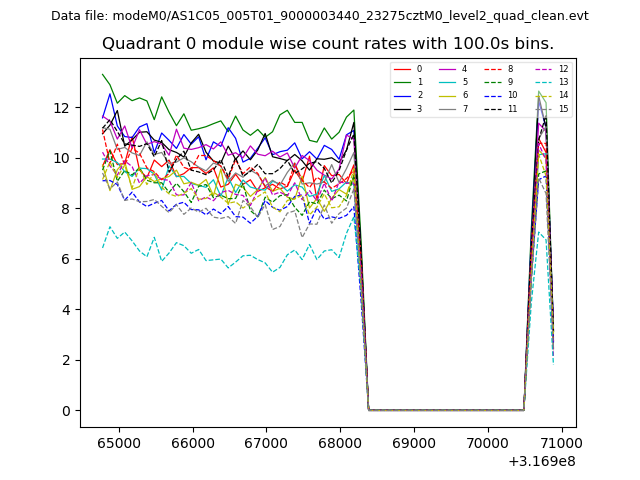 |
 |
| Module-wise count rates for Quadrant B Data is divided into 100 sec bins |
 |
 |
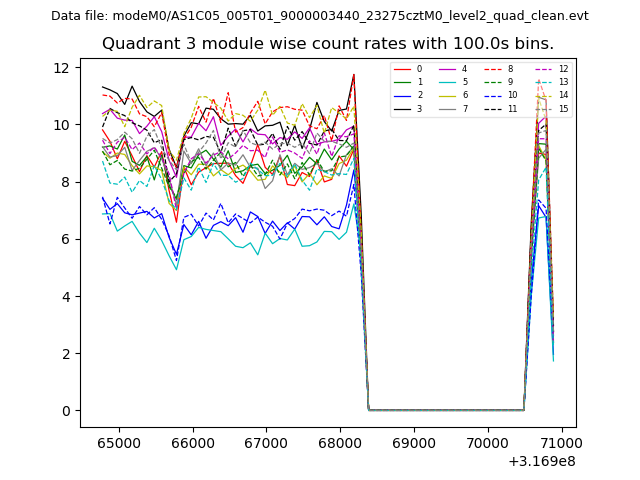
| Module-wise count rates for Quadrant C Data is divided into 100 sec bins |
 |
 |
| Module-wise count rates for Quadrant D Data is divided into 100 sec bins |
 |
 |
| Parameter | Plot |
|---|---|
| CZT HV Monitor | 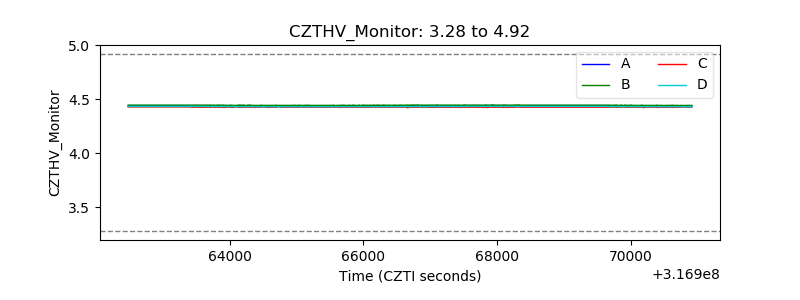 |
| D_VDD | 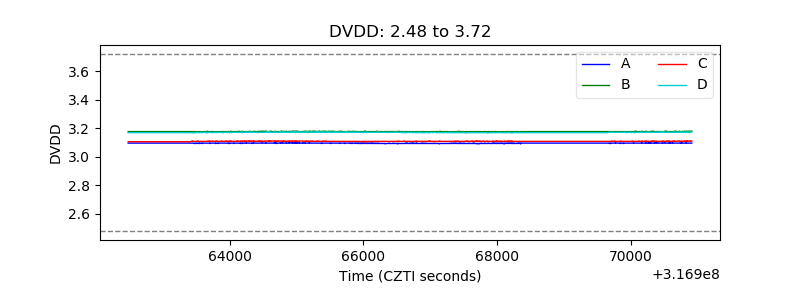 |
| Temperature 1 | 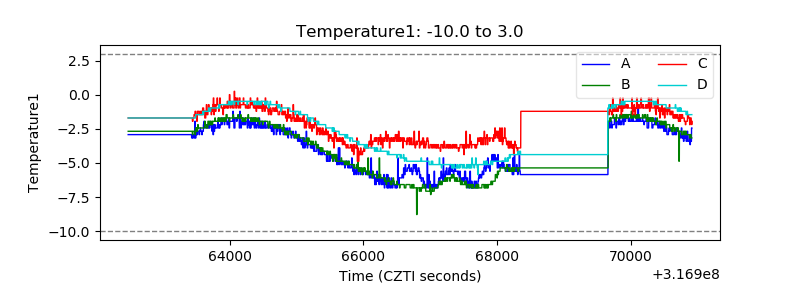 |
| Veto HV Monitor | 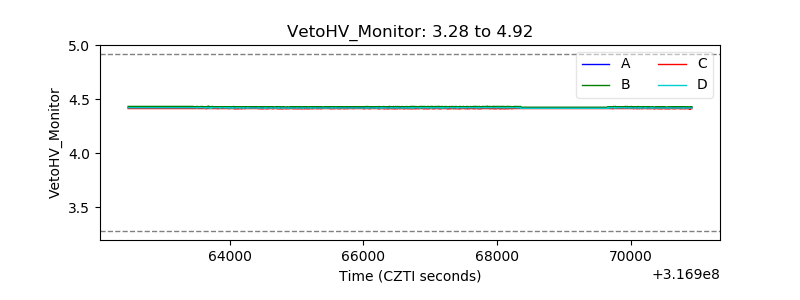 |
| Veto LLD | 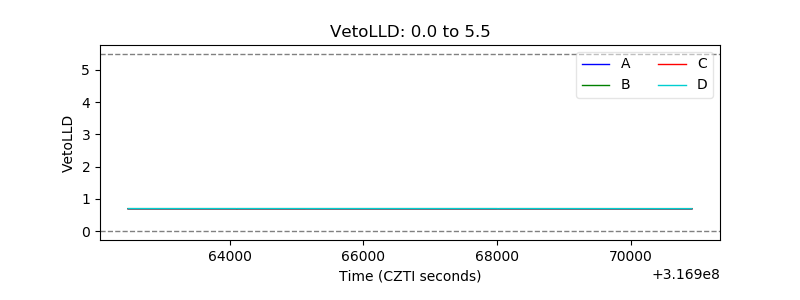 |
| Alpha Counter | 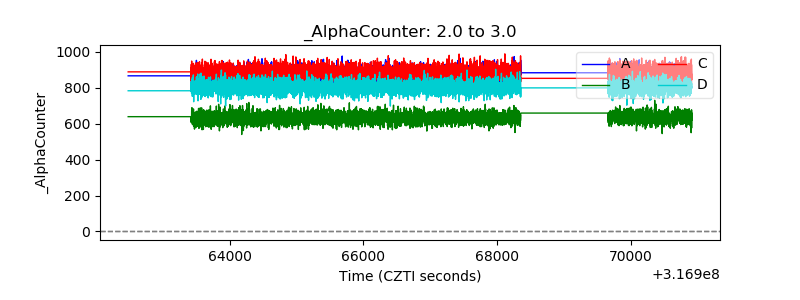 |
| _CPM_Rate | 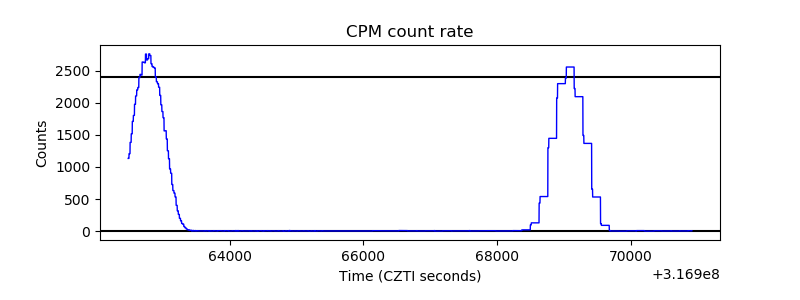 |
| CZT Counter |  |
| +2.5 Volts monitor | 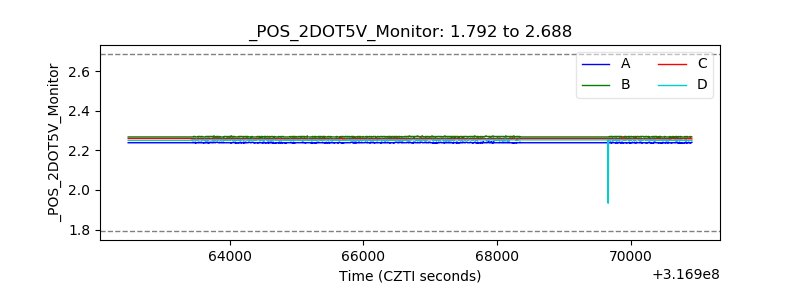 |
| +5 Volts monitor |  |
| _ROLL_ROT | 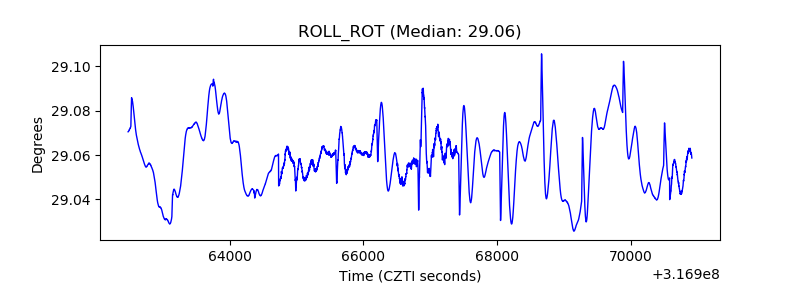 |
| _Roll_DEC | 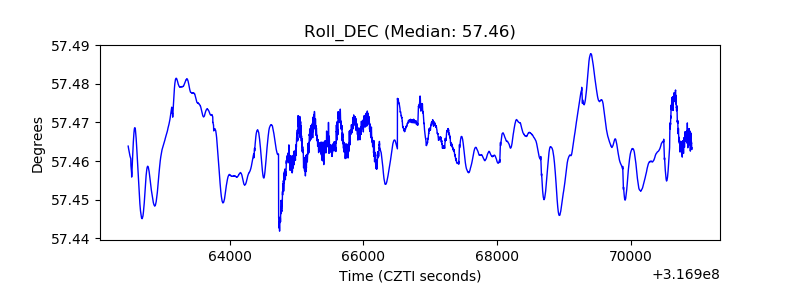 |
| _Roll_RA |  |
| Veto Counter | 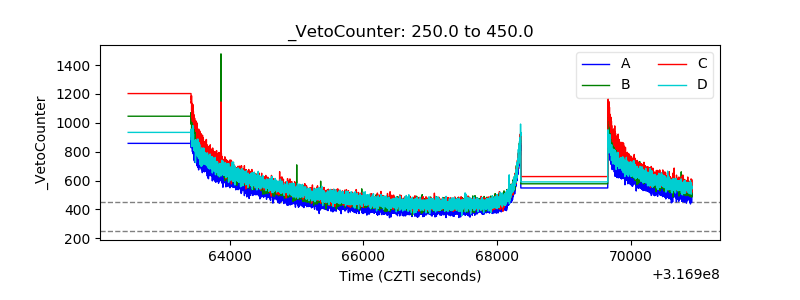 |