| Param | Original file | Final file |
|---|---|---|
| Filename | modeM0/AS1C05_005T01_9000003440_23276cztM0_level2.evt | modeM0/AS1C05_005T01_9000003440_23276cztM0_level2_quad_clean.evt |
| Size (bytes) | 475,626,240 | 102,893,760 |
| Size | 453.6 MB | 98.1 MB |
| Events in quadrant A | 3,199,477 | 679,787 |
| Events in quadrant B | 3,335,950 | 694,713 |
| Events in quadrant C | 3,324,622 | 665,336 |
| Events in quadrant D | 4,128,685 | 648,868 |
| Mode SS | |||
|---|---|---|---|
| Quadrant | BADHDUFLAG | Total packets | Discarded packets |
| A | 0 | 126 | 0 |
| B | 0 | 126 | 0 |
| C | 0 | 126 | 0 |
| D | 0 | 126 | 0 |
| Mode M9 | |||
|---|---|---|---|
| Quadrant | BADHDUFLAG | Total packets | Discarded packets |
| A | 0 | 21 | 0 |
| B | 0 | 22 | 0 |
| C | 0 | 22 | 0 |
| D | 0 | 22 | 0 |
| Mode M0 | |||
|---|---|---|---|
| Quadrant | BADHDUFLAG | Total packets | Discarded packets |
| A | 0 | 13446 | 2 |
| B | 0 | 13827 | 2 |
| C | 0 | 13786 | 2 |
| D | 0 | 16530 | 2 |
| Quadrant | Total seconds | Saturated seconds | Saturation percentage |
|---|---|---|---|
| A | 6119 | 78 | 1.274718% |
| B | 6119 | 115 | 1.879392% |
| C | 6119 | 119 | 1.944762% |
| D | 6119 | 196 | 3.203138% |
Noise dominated data is calculated using 1-second bins in cleaned event files. If a bin has >2000 counts, and if more than 50% of those come from <1% of pixels, then it is considered to be noise-dominated and hence unusable.
| Quadrant | # 1 sec bins | Bins with >0 counts | Bins with >2000 counts | High rate bins dominated by noise | Noise dominated (total time) | Noise dominated (detector-on time) | Marked lightcurve |
|---|---|---|---|---|---|---|---|
| A | 7439 | 6120 | 0 | 0 | 0.00% | 0.00% | 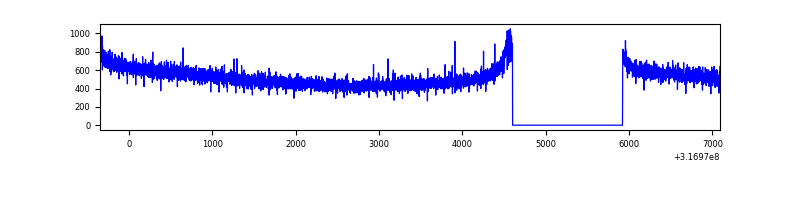 |
| B | 7439 | 6120 | 14 | 14 | 0.19% | 0.23% | 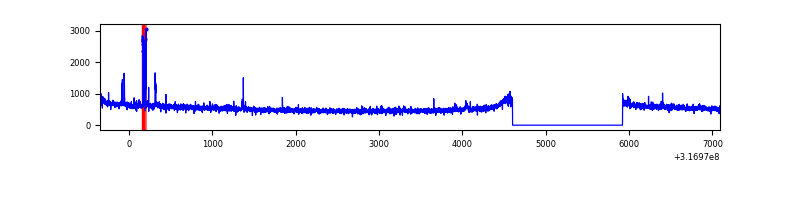 |
| C | 7439 | 6119 | 0 | 0 | 0.00% | 0.00% | 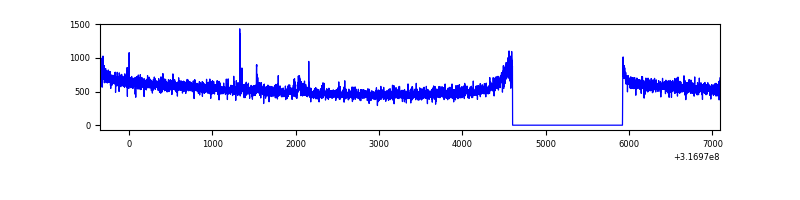 |
| D | 7439 | 6120 | 92 | 92 | 1.24% | 1.50% | 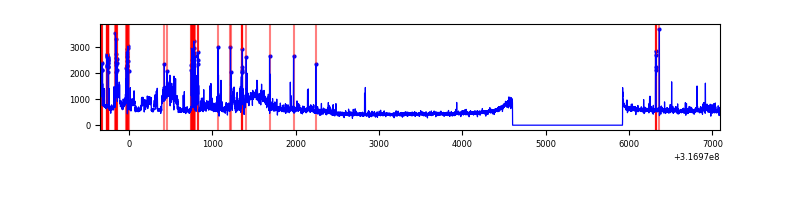 |
Top three noisy pixels from each quadrant. If the there are fewer than three noisy pixels in the level2.evt file, extra rows are filled as -1
| Pixel properties | Quadrant properties | ||||||
|---|---|---|---|---|---|---|---|
| Quadrant | DetID | PixID | Counts | Sigma | Mean | Median | Sigma |
| A | 13 | 254 | 10615 | 60.04 | 829 | 815 | 163.2 |
| A | 0 | 226 | 7206 | 39.15 | 829 | 815 | 163.2 |
| A | 3 | 137 | 6624 | 35.59 | 829 | 815 | 163.2 |
| B | 4 | 200 | 76938 | 494.59 | 830 | 811 | 153.9 |
| B | 12 | 111 | 17393 | 107.73 | 830 | 811 | 153.9 |
| B | 11 | 111 | 15160 | 93.22 | 830 | 811 | 153.9 |
| C | 14 | 238 | 128709 | 693.84 | 808 | 817 | 184.3 |
| C | 8 | 208 | 13219 | 67.28 | 808 | 817 | 184.3 |
| C | 3 | 233 | 13183 | 67.09 | 808 | 817 | 184.3 |
| D | 7 | 238 | 298552 | 1526.37 | 813 | 792 | 195.1 |
| D | 7 | 223 | 228667 | 1168.13 | 813 | 792 | 195.1 |
| D | 1 | 239 | 196477 | 1003.12 | 813 | 792 | 195.1 |
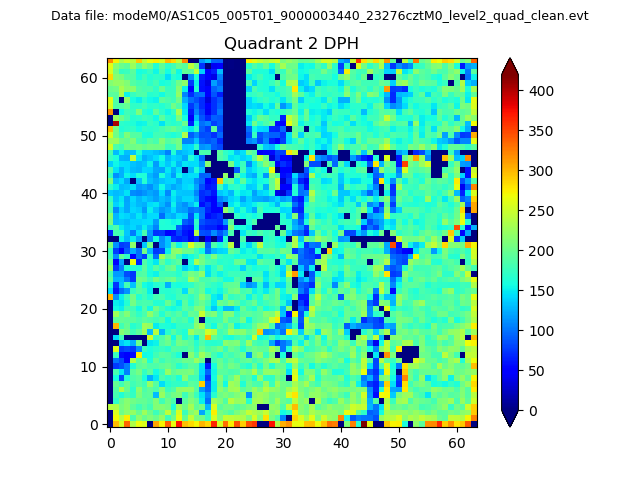
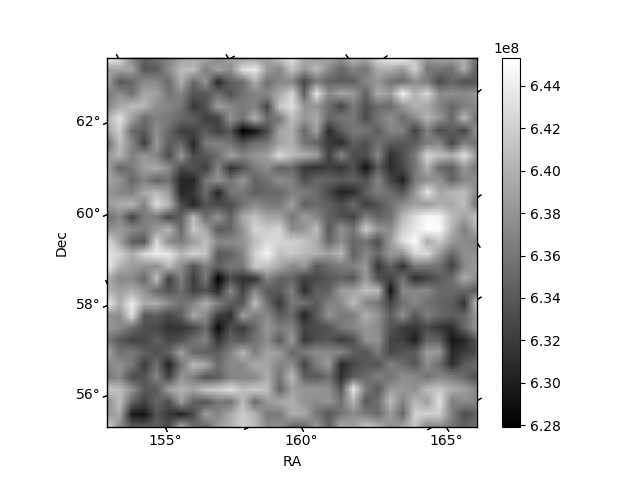
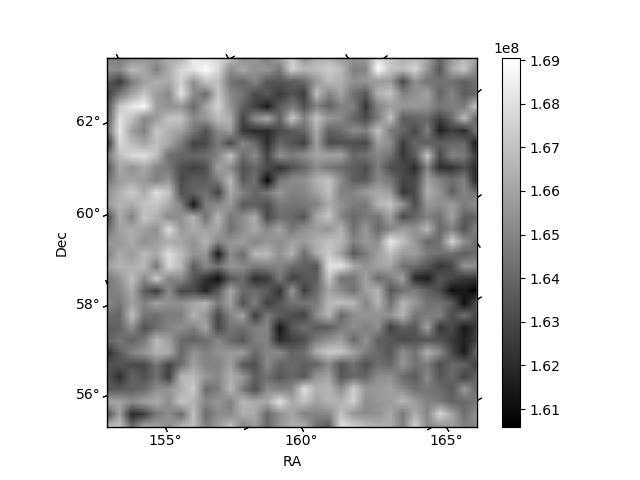
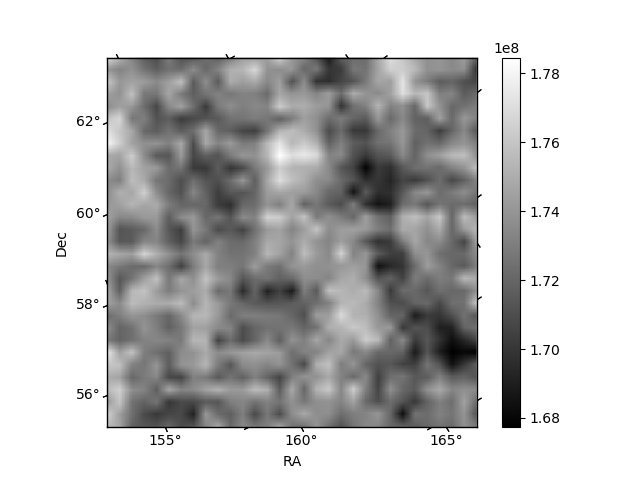
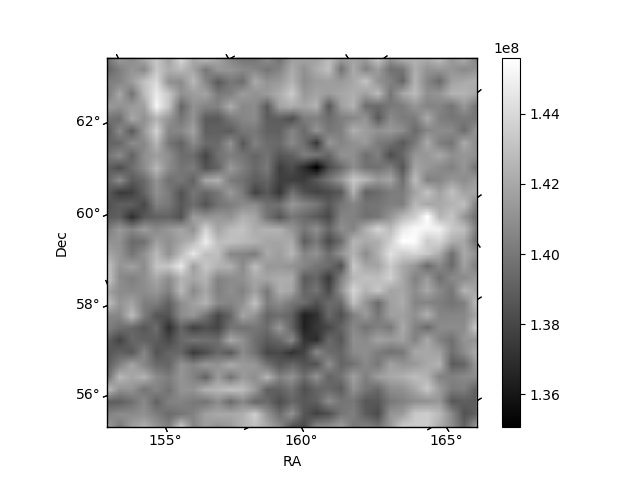
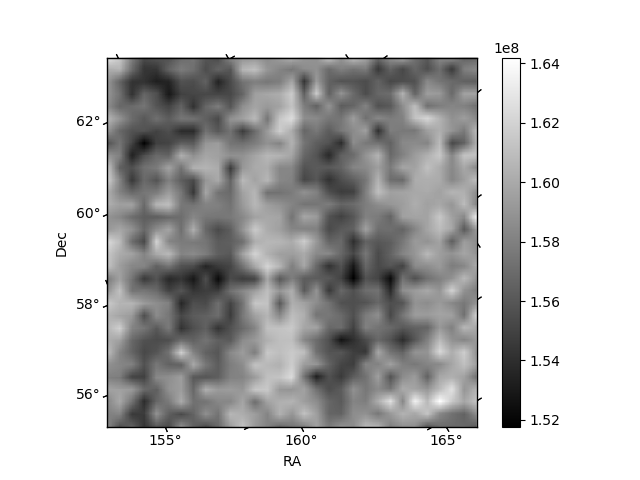
Histogram calculated using DETX and DETY for each event in the final _common_clean file
| Quadrant A | 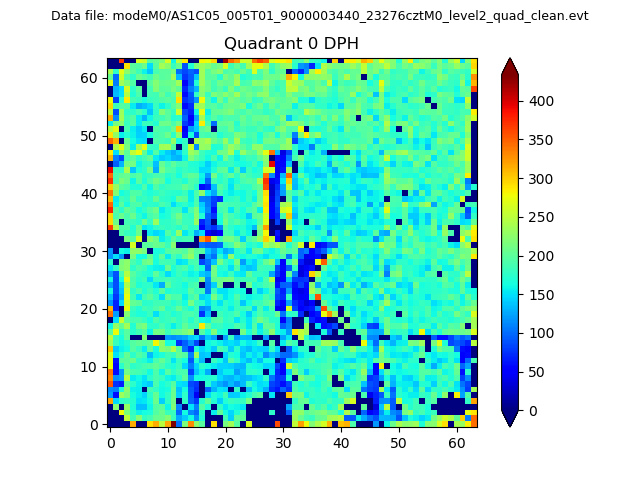 |
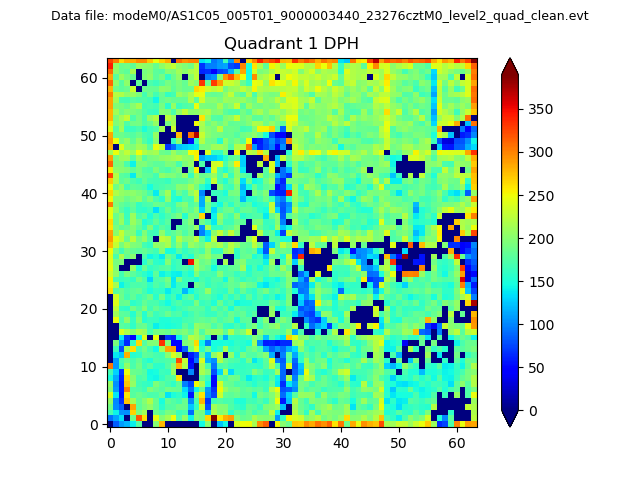 |
Quadrant B |
|---|---|---|---|
| Quadrant D | 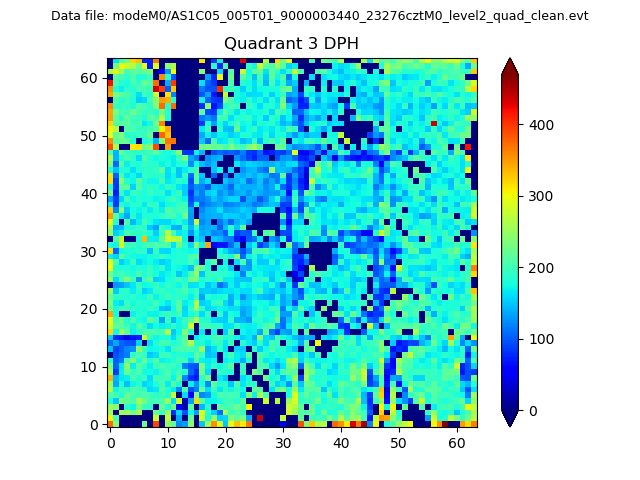 |
 |
Quadrant C |
| Plot type | Count rate plots | Images |
|---|---|---|
| Comparison with Poisson distribution Blue bars denote a histogram of data divided into 1 sec bins. Red curve is a Poisson curve with rate = median count rate of data. |
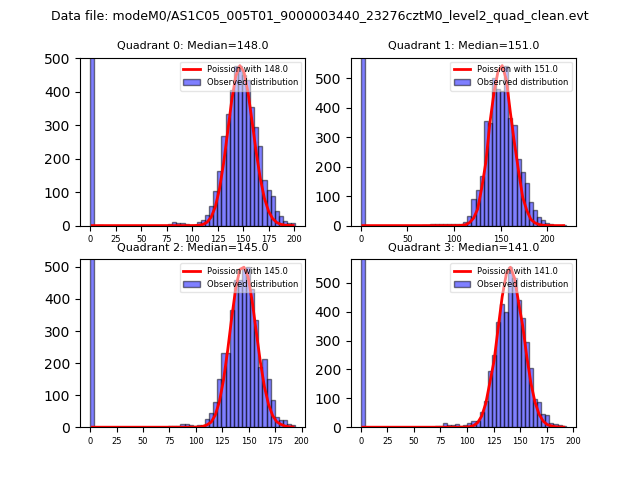 |
 |
| Quadrant-wise count rates Data is divided into 100 sec bins |
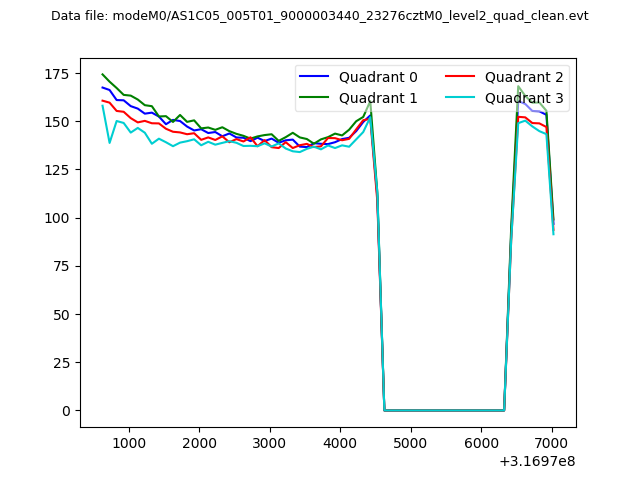 |
|
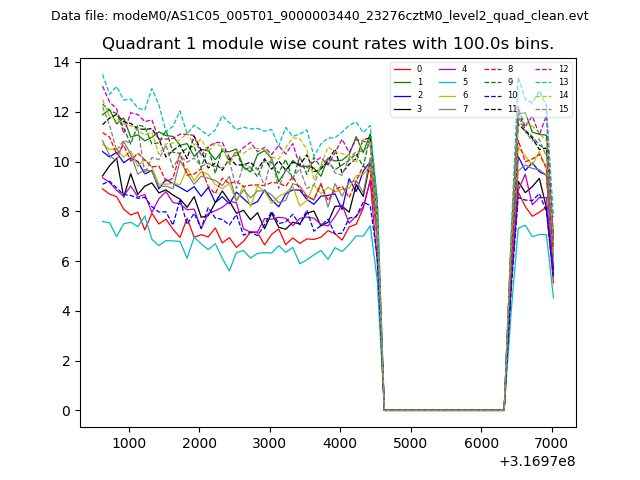
| Module-wise count rates for Quadrant A Data is divided into 100 sec bins |
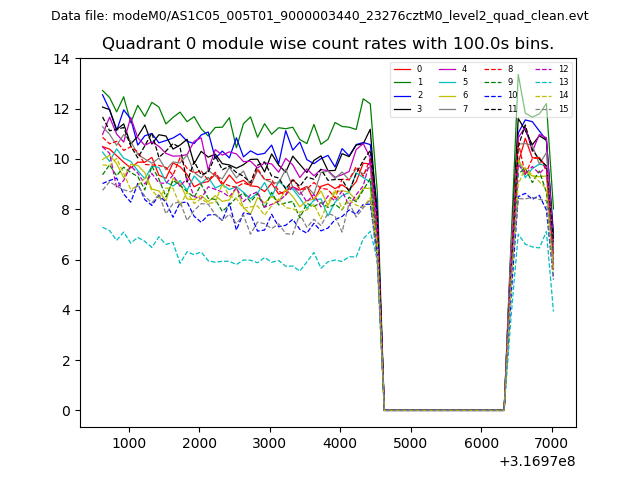 |
 |
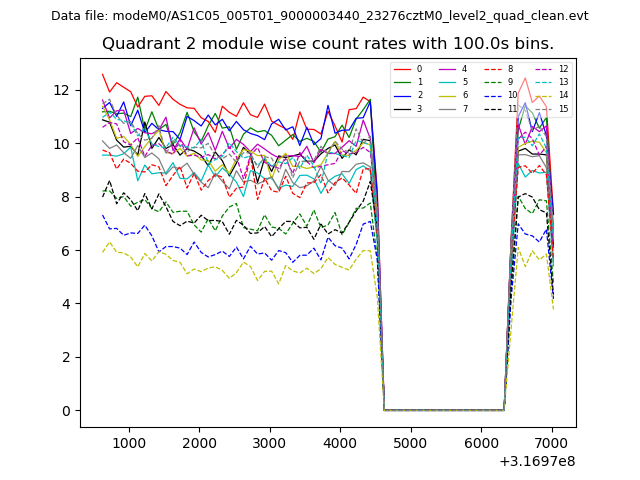
| Module-wise count rates for Quadrant B Data is divided into 100 sec bins |
 |
 |
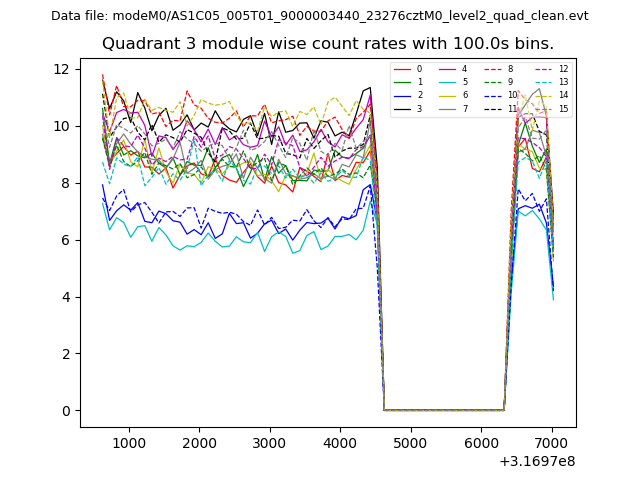
| Module-wise count rates for Quadrant C Data is divided into 100 sec bins |
 |
 |
| Module-wise count rates for Quadrant D Data is divided into 100 sec bins |
 |
 |
| Parameter | Plot |
|---|---|
| CZT HV Monitor | 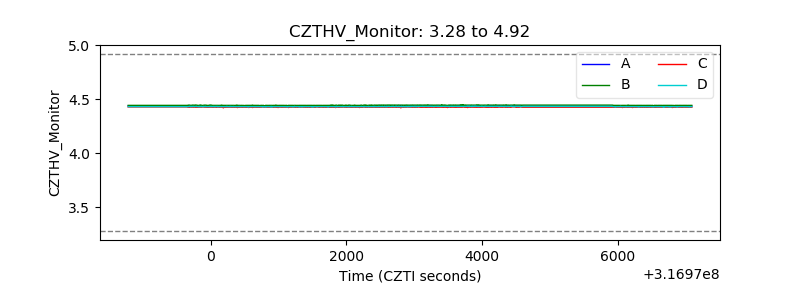 |
| D_VDD | 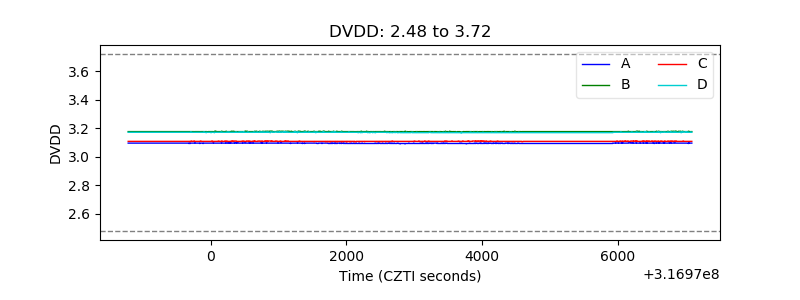 |
| Temperature 1 | 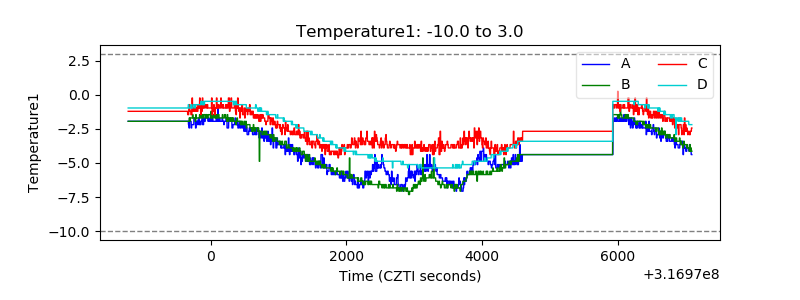 |
| Veto HV Monitor | 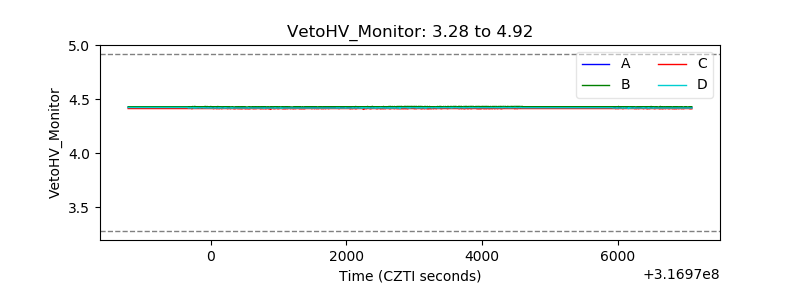 |
| Veto LLD |  |
| Alpha Counter |  |
| _CPM_Rate | 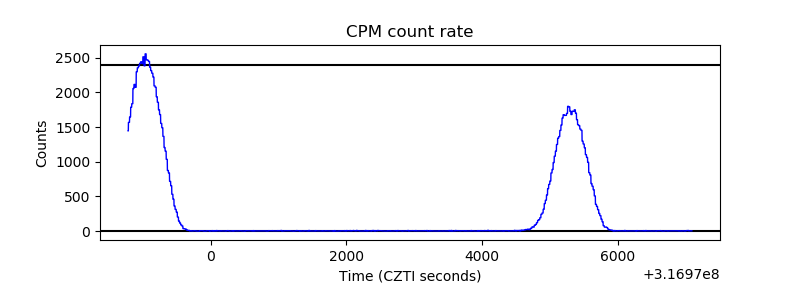 |
| CZT Counter | 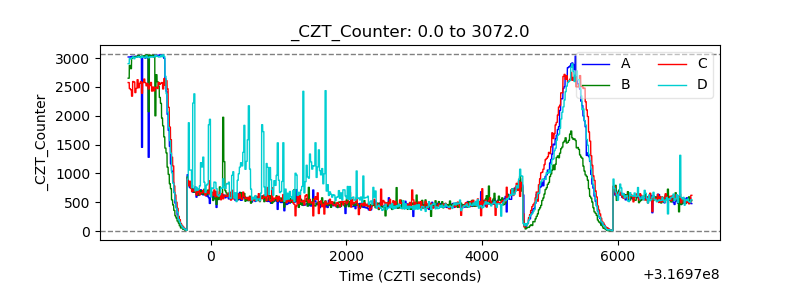 |
| +2.5 Volts monitor | 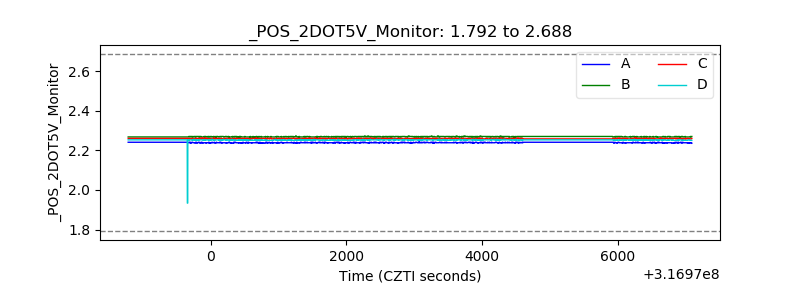 |
| +5 Volts monitor |  |
| _ROLL_ROT | 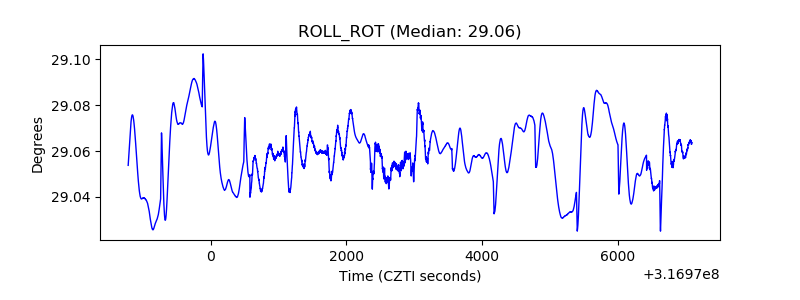 |
| _Roll_DEC | 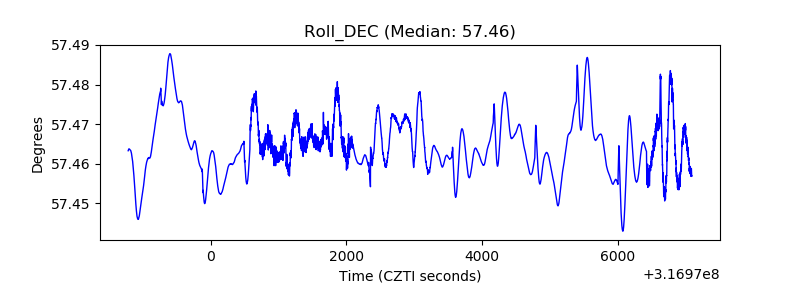 |
| _Roll_RA | 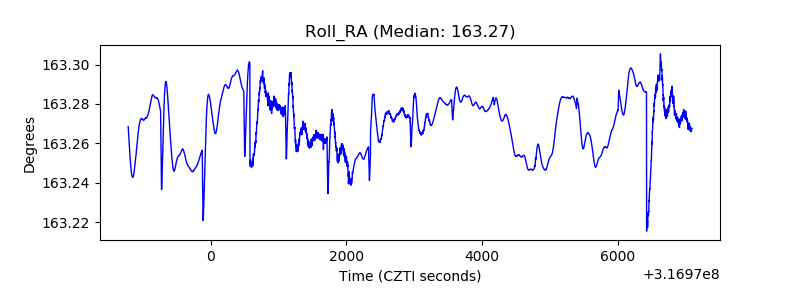 |
| Veto Counter | 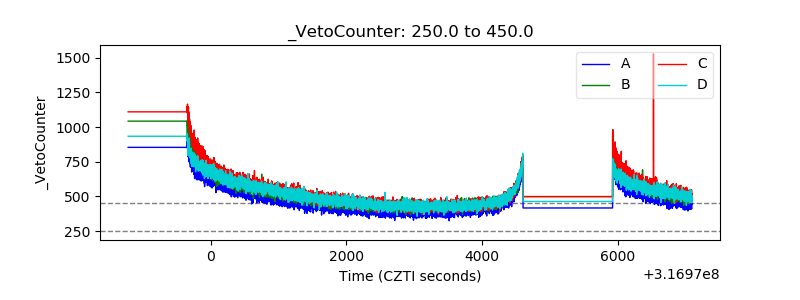 |