| Param | Original file | Final file |
|---|---|---|
| Filename | modeM0/AS1C05_005T01_9000003440_23277cztM0_level2.evt | modeM0/AS1C05_005T01_9000003440_23277cztM0_level2_quad_clean.evt |
| Size (bytes) | 451,244,160 | 111,689,280 |
| Size | 430.3 MB | 106.5 MB |
| Events in quadrant A | 3,143,535 | 741,149 |
| Events in quadrant B | 3,282,616 | 760,071 |
| Events in quadrant C | 3,434,460 | 725,272 |
| Events in quadrant D | 3,372,250 | 711,547 |
| Mode SS | |||
|---|---|---|---|
| Quadrant | BADHDUFLAG | Total packets | Discarded packets |
| A | 0 | 130 | 0 |
| B | 0 | 130 | 0 |
| C | 0 | 130 | 0 |
| D | 0 | 130 | 0 |
| Mode M9 | |||
|---|---|---|---|
| Quadrant | BADHDUFLAG | Total packets | Discarded packets |
| A | 0 | 12 | 0 |
| B | 0 | 13 | 0 |
| C | 0 | 13 | 0 |
| D | 0 | 13 | 0 |
| Mode M0 | |||
|---|---|---|---|
| Quadrant | BADHDUFLAG | Total packets | Discarded packets |
| A | 0 | 13460 | 2 |
| B | 0 | 13841 | 3 |
| C | 0 | 14129 | 2 |
| D | 0 | 14194 | 2 |
| Quadrant | Total seconds | Saturated seconds | Saturation percentage |
|---|---|---|---|
| A | 6371 | 76 | 1.192905% |
| B | 6370 | 87 | 1.365777% |
| C | 6370 | 134 | 2.103611% |
| D | 6370 | 95 | 1.491366% |
Noise dominated data is calculated using 1-second bins in cleaned event files. If a bin has >2000 counts, and if more than 50% of those come from <1% of pixels, then it is considered to be noise-dominated and hence unusable.
| Quadrant | # 1 sec bins | Bins with >0 counts | Bins with >2000 counts | High rate bins dominated by noise | Noise dominated (total time) | Noise dominated (detector-on time) | Marked lightcurve |
|---|---|---|---|---|---|---|---|
| A | 7506 | 6372 | 0 | 0 | 0.00% | 0.00% | 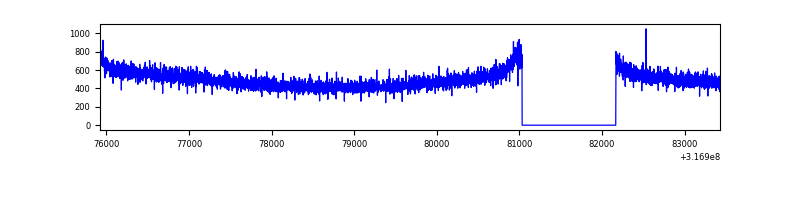 |
| B | 7505 | 6370 | 1 | 1 | 0.01% | 0.02% | 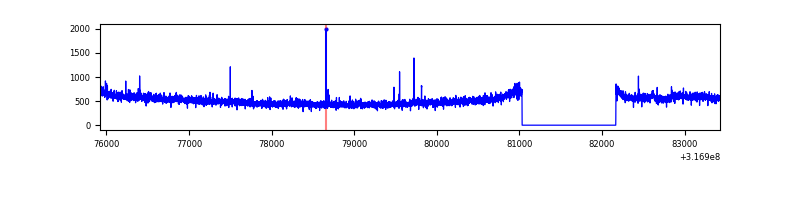 |
| C | 7505 | 6370 | 10 | 10 | 0.13% | 0.16% | 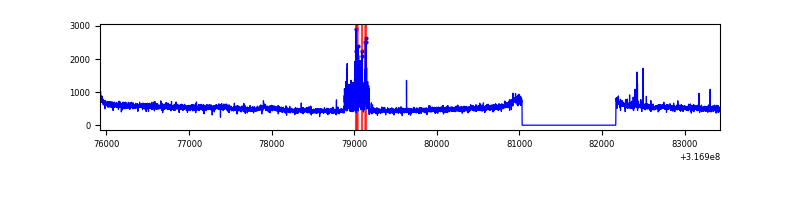 |
| D | 7505 | 6371 | 8 | 8 | 0.11% | 0.13% | 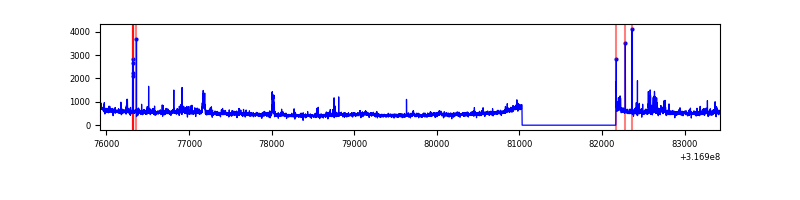 |
Top three noisy pixels from each quadrant. If the there are fewer than three noisy pixels in the level2.evt file, extra rows are filled as -1
| Pixel properties | Quadrant properties | ||||||
|---|---|---|---|---|---|---|---|
| Quadrant | DetID | PixID | Counts | Sigma | Mean | Median | Sigma |
| A | 13 | 254 | 11281 | 64.74 | 814 | 798 | 161.9 |
| A | 0 | 226 | 7103 | 38.94 | 814 | 798 | 161.9 |
| A | 3 | 137 | 6844 | 37.34 | 814 | 798 | 161.9 |
| B | 4 | 206 | 71118 | 458.23 | 816 | 796 | 153.5 |
| B | 12 | 111 | 17631 | 109.7 | 816 | 796 | 153.5 |
| B | 11 | 111 | 15518 | 95.93 | 816 | 796 | 153.5 |
| C | 10 | 9 | 165595 | 899.32 | 795 | 802 | 183.2 |
| C | 14 | 238 | 126653 | 686.8 | 795 | 802 | 183.2 |
| C | 8 | 208 | 17392 | 90.54 | 795 | 802 | 183.2 |
| D | 1 | 239 | 169805 | 879.78 | 804 | 785 | 192.1 |
| D | 7 | 238 | 58225 | 298.98 | 804 | 785 | 192.1 |
| D | 12 | 233 | 49863 | 255.46 | 804 | 785 | 192.1 |
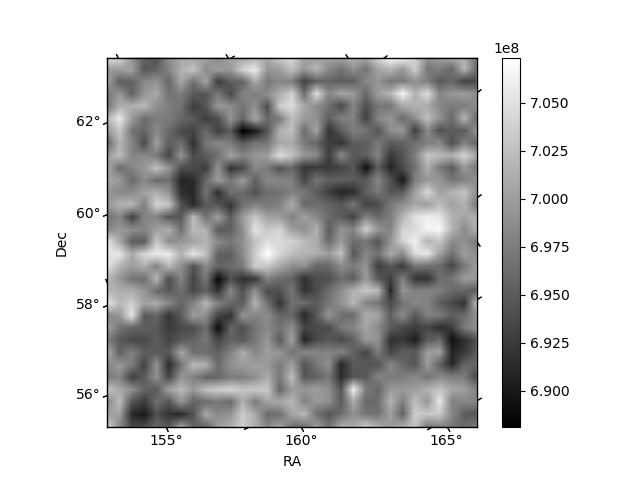
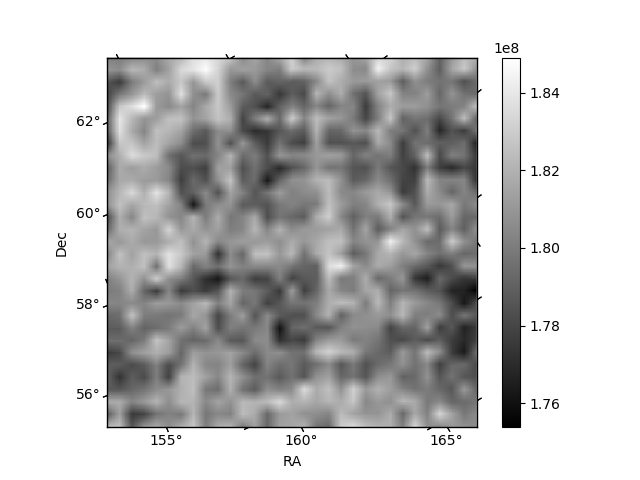
Histogram calculated using DETX and DETY for each event in the final _common_clean file
| Quadrant A |  |
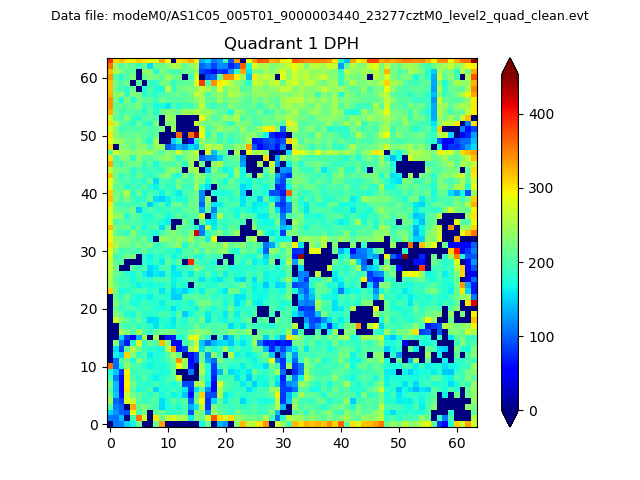 |
Quadrant B |
|---|---|---|---|
| Quadrant D | 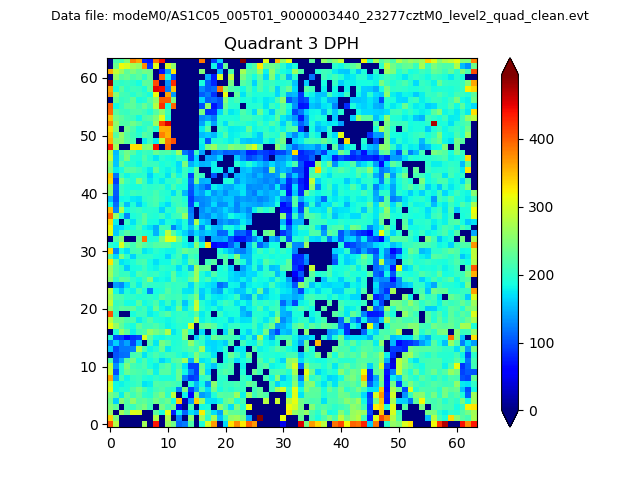 |
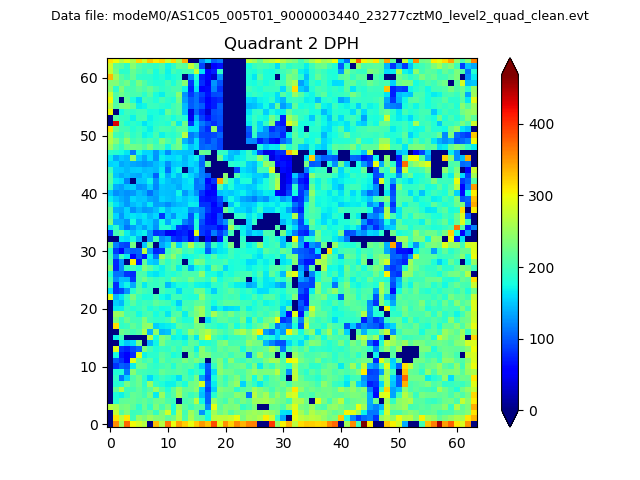 |
Quadrant C |
| Plot type | Count rate plots | Images |
|---|---|---|
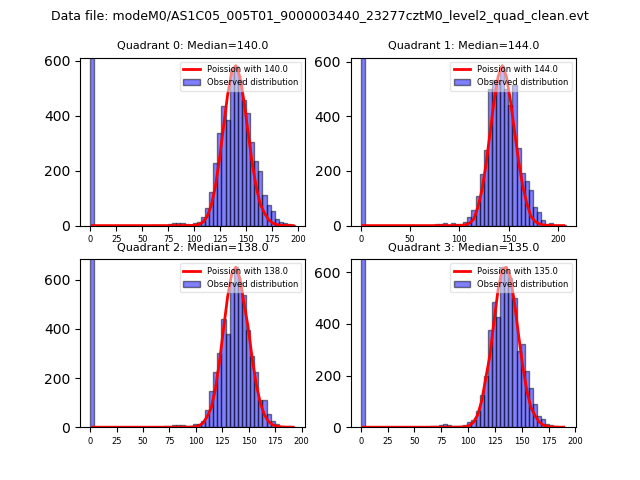
| Comparison with Poisson distribution Blue bars denote a histogram of data divided into 1 sec bins. Red curve is a Poisson curve with rate = median count rate of data. |
 |
 |
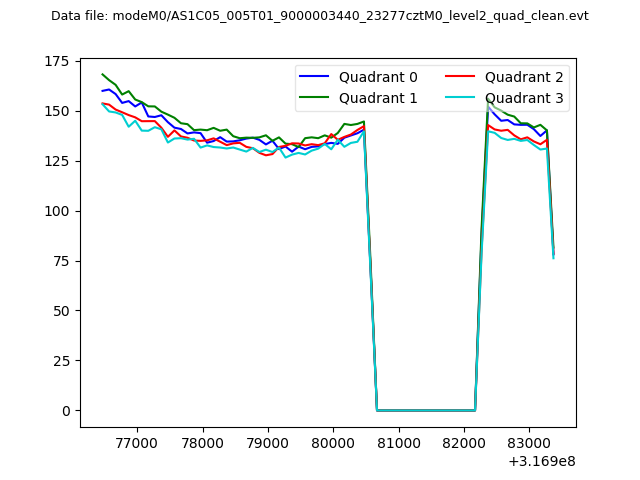
| Quadrant-wise count rates Data is divided into 100 sec bins |
 |
|
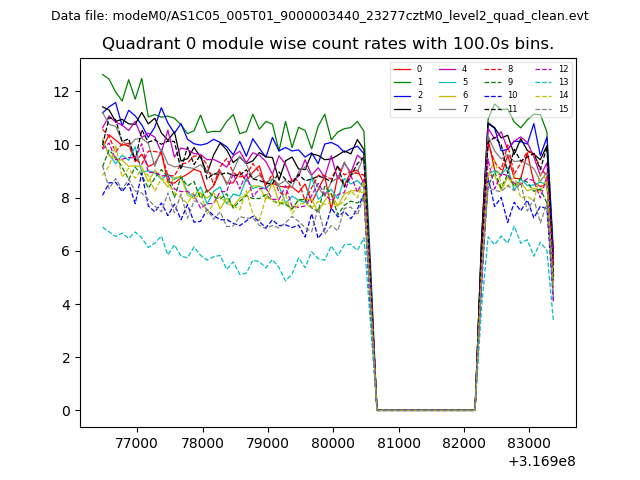
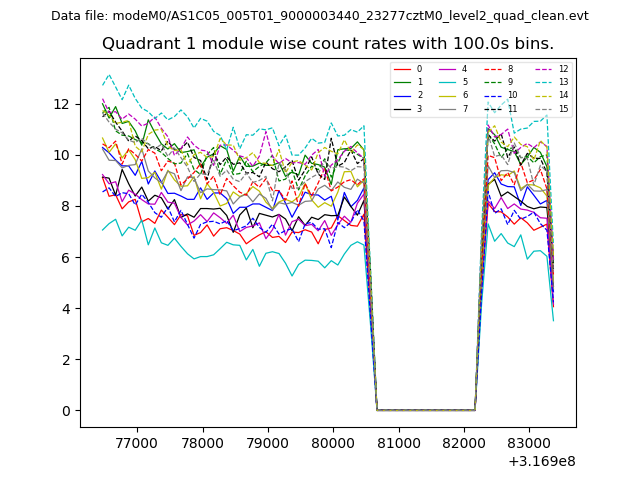
| Module-wise count rates for Quadrant A Data is divided into 100 sec bins |
 |
 |
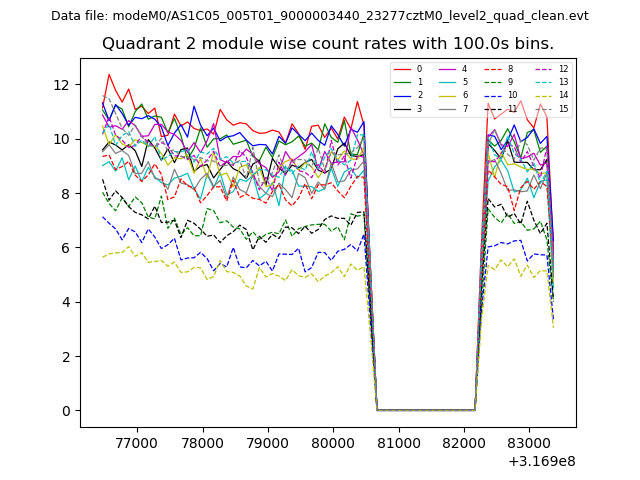
| Module-wise count rates for Quadrant B Data is divided into 100 sec bins |
 |
 |
| Module-wise count rates for Quadrant C Data is divided into 100 sec bins |
 |
 |
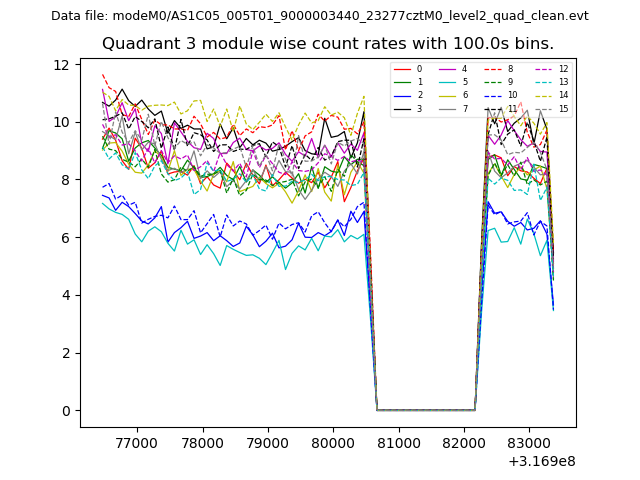
| Module-wise count rates for Quadrant D Data is divided into 100 sec bins |
 |
 |
| Parameter | Plot |
|---|---|
| CZT HV Monitor | 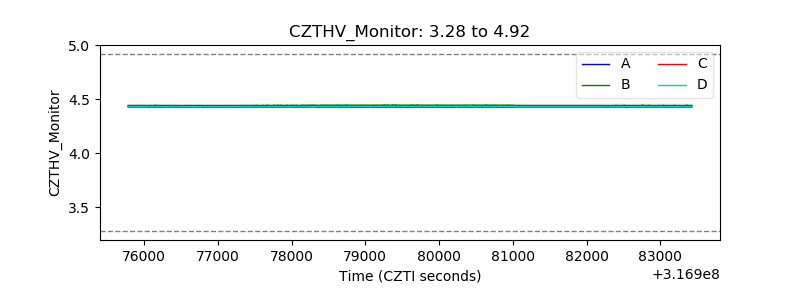 |
| D_VDD | 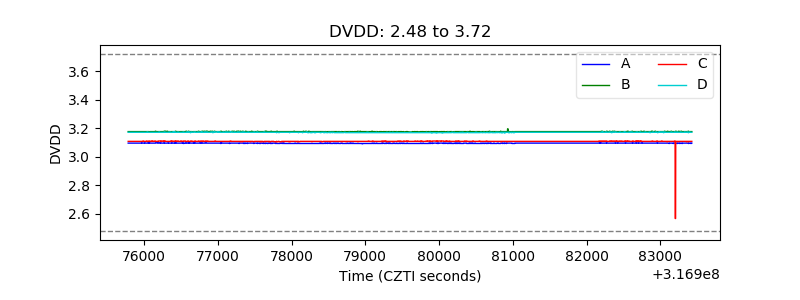 |
| Temperature 1 | 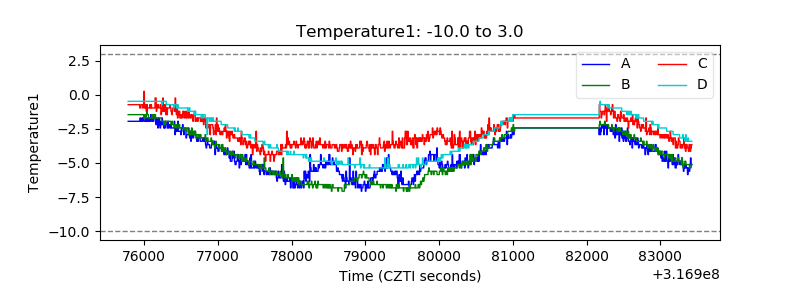 |
| Veto HV Monitor | 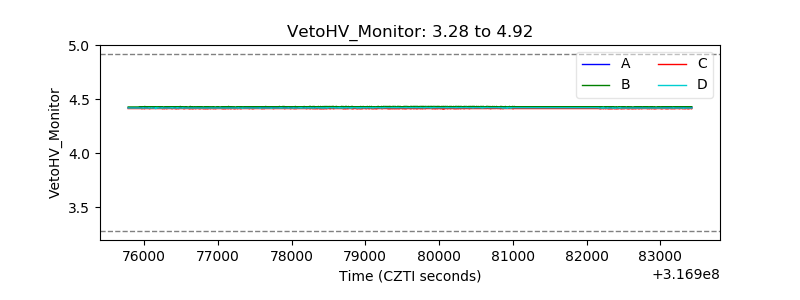 |
| Veto LLD | 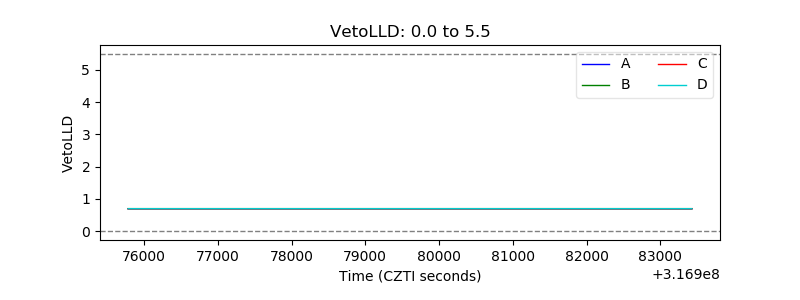 |
| Alpha Counter | 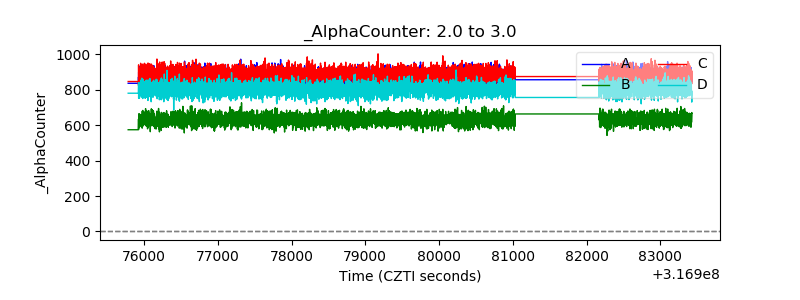 |
| _CPM_Rate | 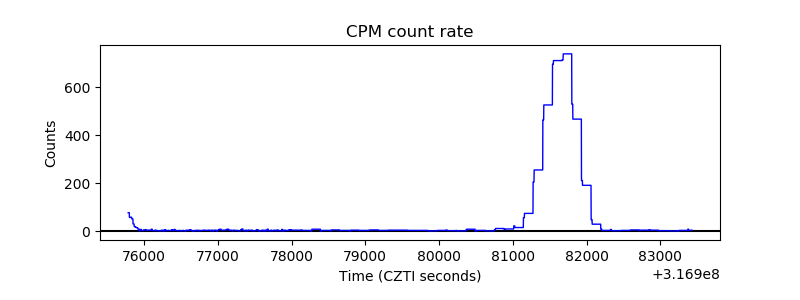 |
| CZT Counter | 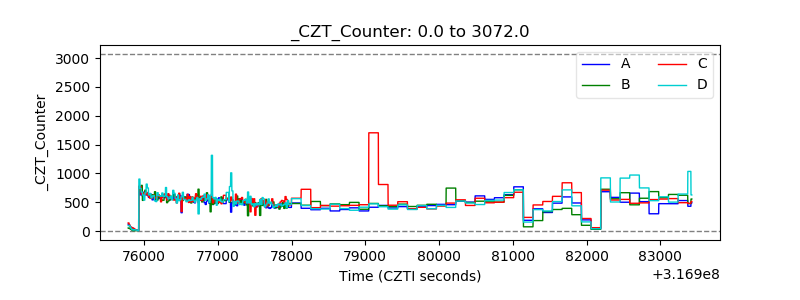 |
| +2.5 Volts monitor |  |
| +5 Volts monitor |  |
| _ROLL_ROT | 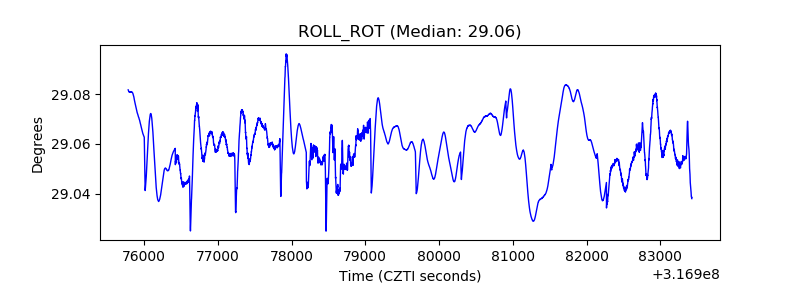 |
| _Roll_DEC | 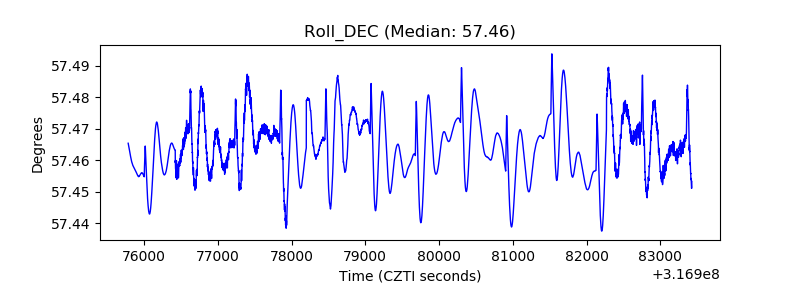 |
| _Roll_RA | 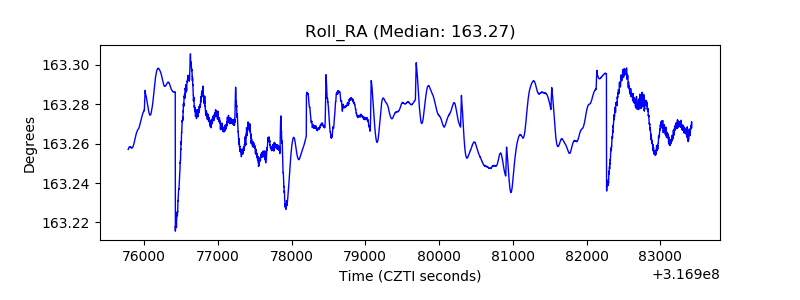 |
| Veto Counter | 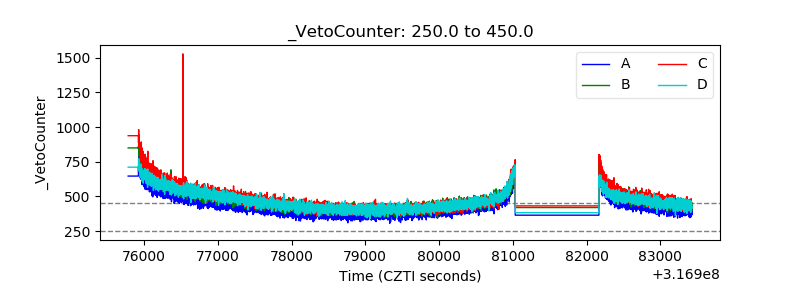 |