| Param | Original file | Final file |
|---|---|---|
| Filename | modeM0/AS1C05_005T01_9000003440_23279cztM0_level2.evt | modeM0/AS1C05_005T01_9000003440_23279cztM0_level2_quad_clean.evt |
| Size (bytes) | 547,476,480 | 109,382,400 |
| Size | 522.1 MB | 104.3 MB |
| Events in quadrant A | 3,431,162 | 710,293 |
| Events in quadrant B | 3,790,826 | 723,079 |
| Events in quadrant C | 3,899,550 | 691,760 |
| Events in quadrant D | 4,961,129 | 676,838 |
| Mode SS | |||
|---|---|---|---|
| Quadrant | BADHDUFLAG | Total packets | Discarded packets |
| A | 0 | 150 | 0 |
| B | 0 | 150 | 0 |
| C | 0 | 150 | 0 |
| D | 0 | 150 | 0 |
| Mode M9 | |||
|---|---|---|---|
| Quadrant | BADHDUFLAG | Total packets | Discarded packets |
| A | 0 | 13 | 0 |
| B | 0 | 13 | 0 |
| C | 0 | 13 | 0 |
| D | 0 | 13 | 0 |
| Mode M0 | |||
|---|---|---|---|
| Quadrant | BADHDUFLAG | Total packets | Discarded packets |
| A | 0 | 15223 | 2 |
| B | 0 | 15784 | 4 |
| C | 0 | 16452 | 4 |
| D | 0 | 19886 | 4 |
| Quadrant | Total seconds | Saturated seconds | Saturation percentage |
|---|---|---|---|
| A | 7340 | 27 | 0.367847% |
| B | 7340 | 84 | 1.144414% |
| C | 7340 | 205 | 2.792916% |
| D | 7340 | 167 | 2.275204% |
Noise dominated data is calculated using 1-second bins in cleaned event files. If a bin has >2000 counts, and if more than 50% of those come from <1% of pixels, then it is considered to be noise-dominated and hence unusable.
| Quadrant | # 1 sec bins | Bins with >0 counts | Bins with >2000 counts | High rate bins dominated by noise | Noise dominated (total time) | Noise dominated (detector-on time) | Marked lightcurve |
|---|---|---|---|---|---|---|---|
| A | 8600 | 7342 | 0 | 0 | 0.00% | 0.00% | 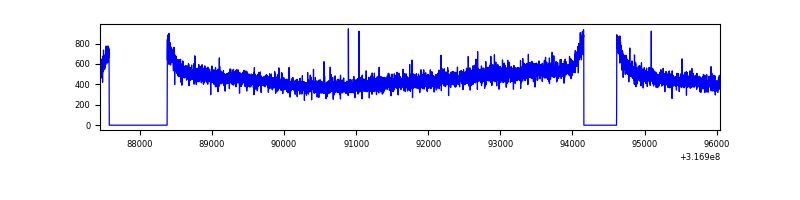 |
| B | 8601 | 7343 | 0 | 0 | 0.00% | 0.00% | 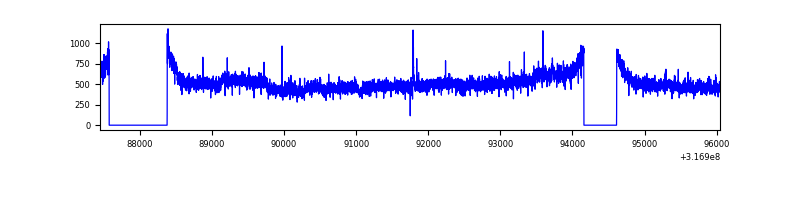 |
| C | 8601 | 7343 | 44 | 44 | 0.51% | 0.60% | 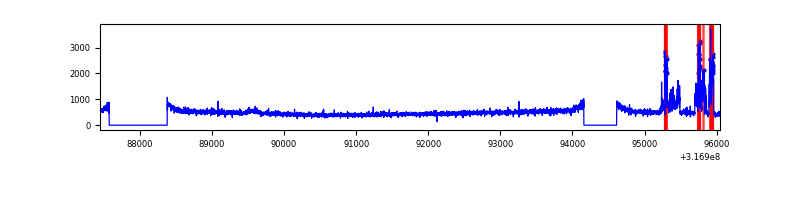 |
| D | 8601 | 7343 | 68 | 68 | 0.79% | 0.93% | 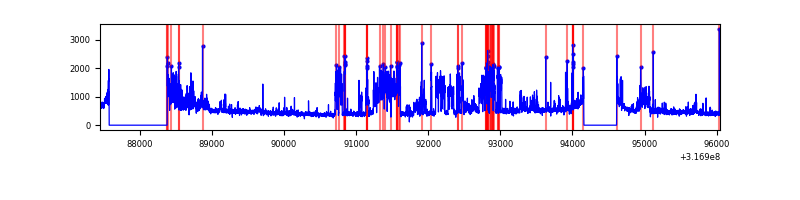 |
Top three noisy pixels from each quadrant. If the there are fewer than three noisy pixels in the level2.evt file, extra rows are filled as -1
| Pixel properties | Quadrant properties | ||||||
|---|---|---|---|---|---|---|---|
| Quadrant | DetID | PixID | Counts | Sigma | Mean | Median | Sigma |
| A | 13 | 254 | 12000 | 62.19 | 889 | 868 | 179.0 |
| A | 3 | 137 | 8004 | 39.87 | 889 | 868 | 179.0 |
| A | 0 | 226 | 7526 | 37.2 | 889 | 868 | 179.0 |
| B | 4 | 206 | 284706 | 1670.03 | 891 | 867 | 170.0 |
| B | 12 | 111 | 20693 | 116.65 | 891 | 867 | 170.0 |
| B | 11 | 111 | 18272 | 102.41 | 891 | 867 | 170.0 |
| C | 10 | 9 | 380929 | 1893.79 | 859 | 865 | 200.7 |
| C | 14 | 238 | 136791 | 677.3 | 859 | 865 | 200.7 |
| C | 8 | 208 | 18585 | 88.3 | 859 | 865 | 200.7 |
| D | 7 | 238 | 1324895 | 6297.32 | 866 | 841 | 210.3 |
| D | 12 | 233 | 133427 | 630.59 | 866 | 841 | 210.3 |
| D | 1 | 239 | 99371 | 468.62 | 866 | 841 | 210.3 |
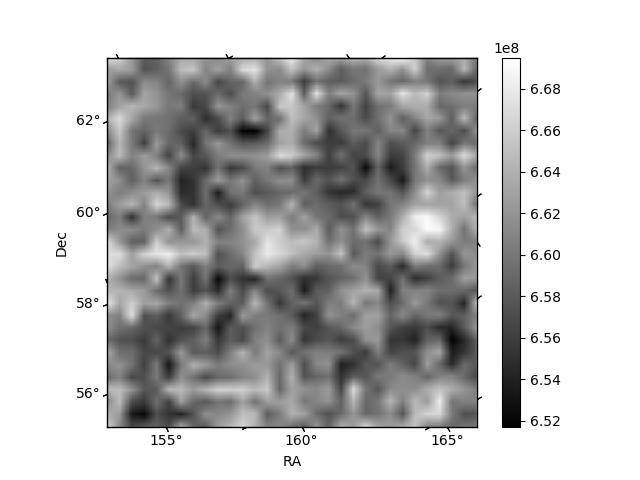
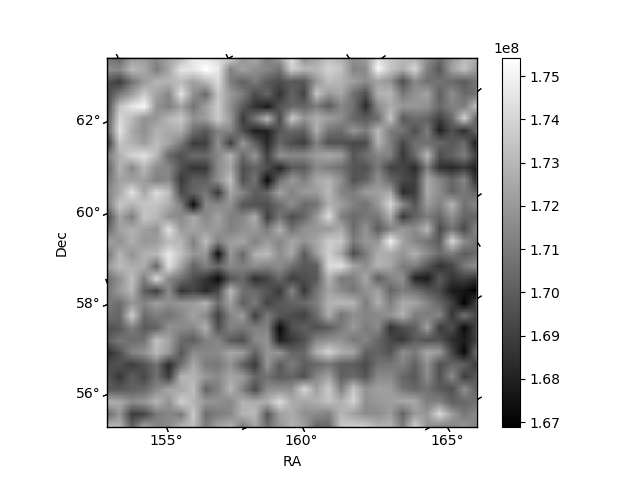
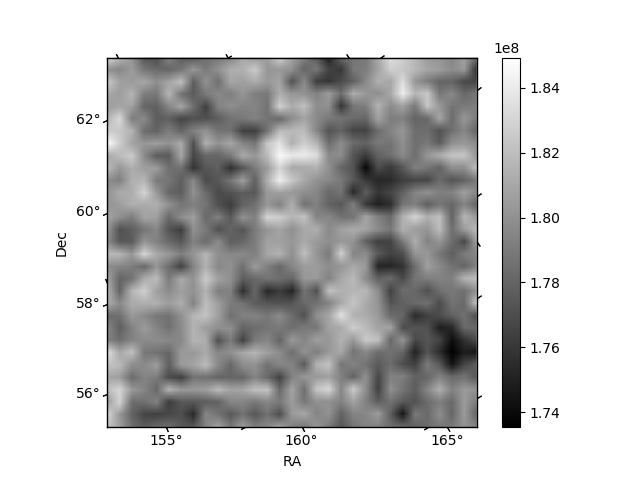
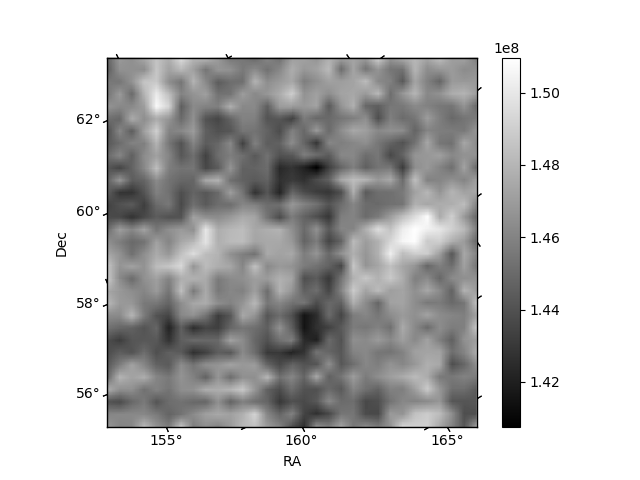
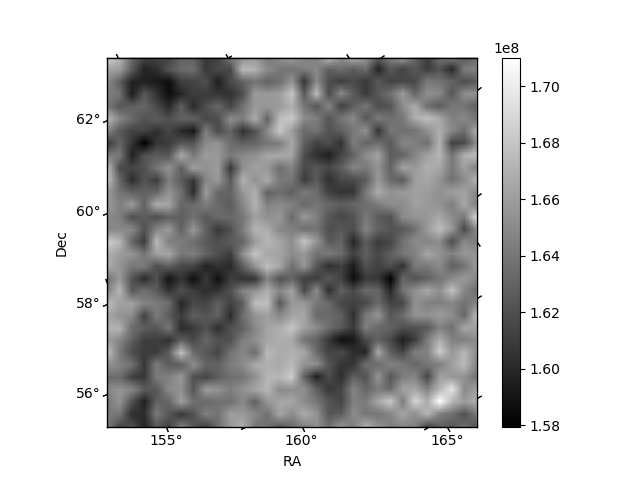
Histogram calculated using DETX and DETY for each event in the final _common_clean file
| Quadrant A | 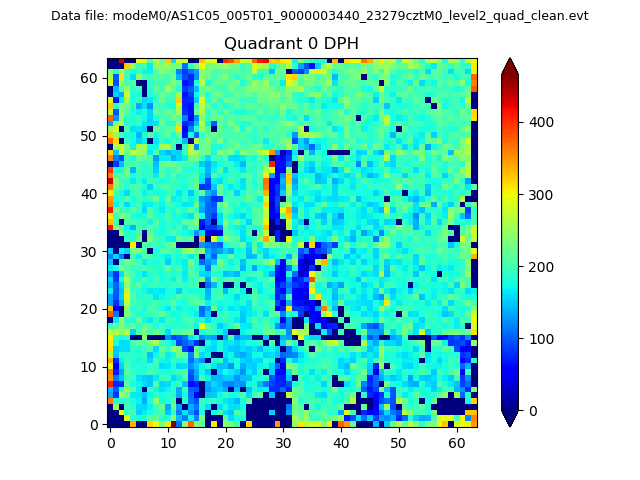 |
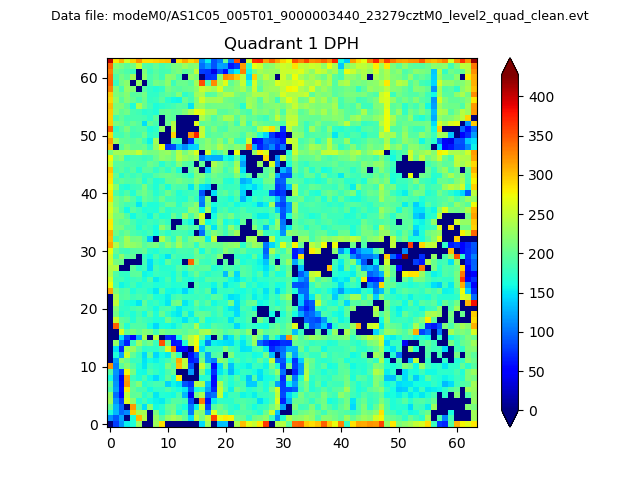 |
Quadrant B |
|---|---|---|---|
| Quadrant D | 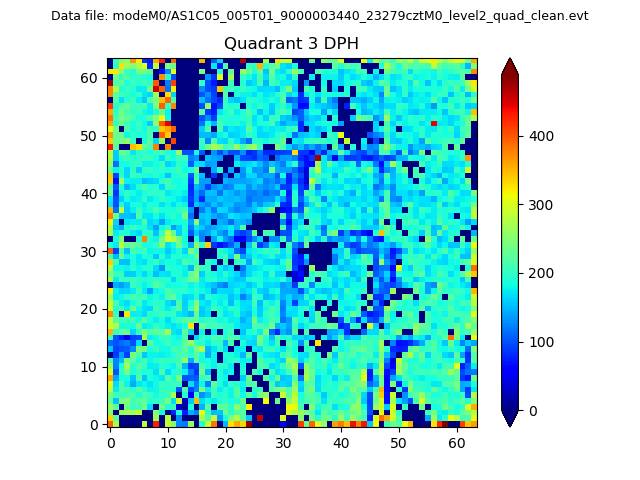 |
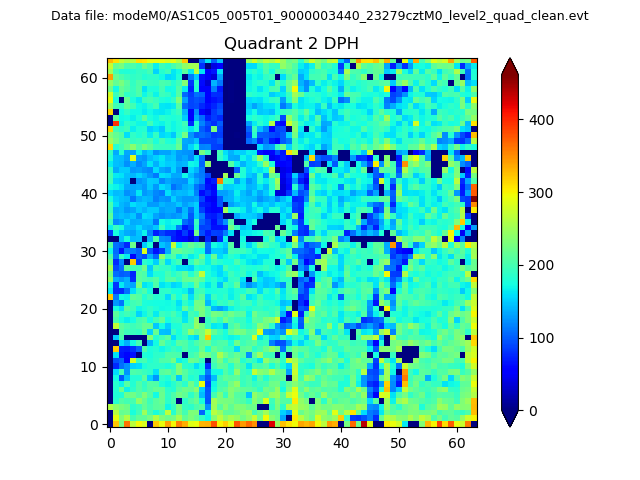 |
Quadrant C |
| Plot type | Count rate plots | Images |
|---|---|---|
| Comparison with Poisson distribution Blue bars denote a histogram of data divided into 1 sec bins. Red curve is a Poisson curve with rate = median count rate of data. |
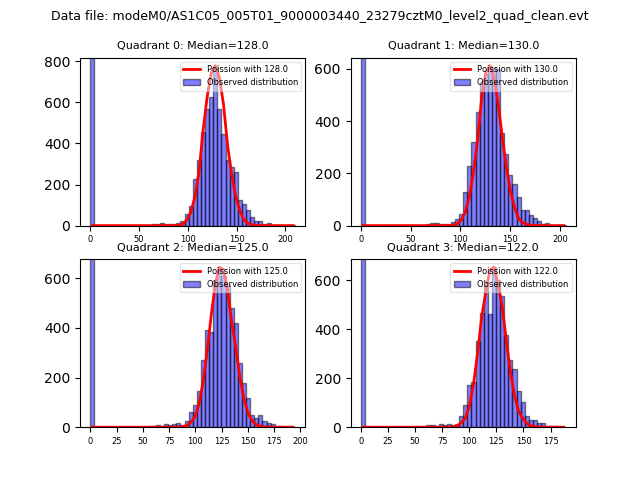 |
 |
| Quadrant-wise count rates Data is divided into 100 sec bins |
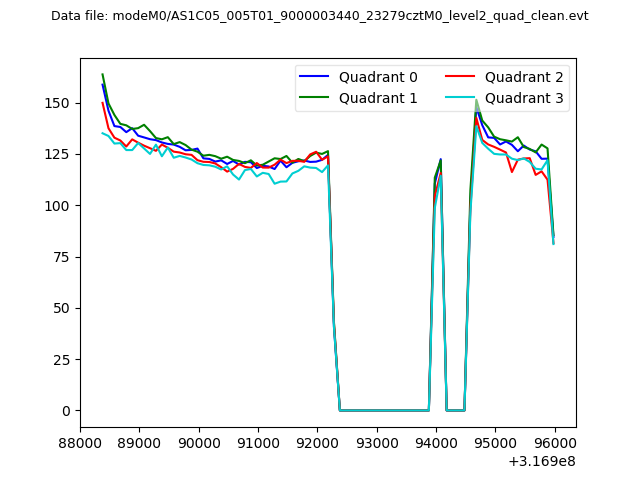 |
|
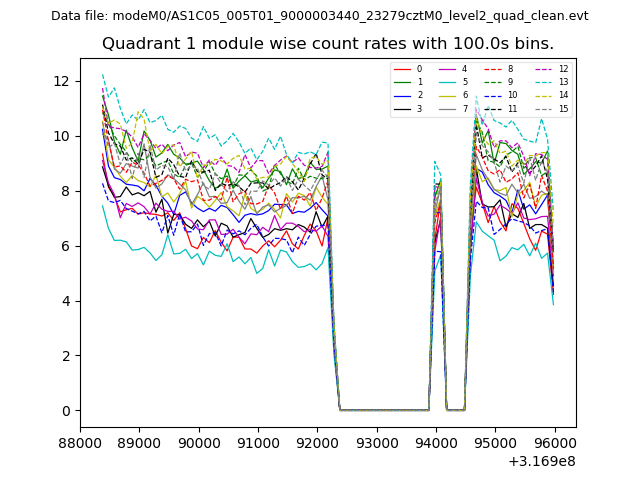
| Module-wise count rates for Quadrant A Data is divided into 100 sec bins |
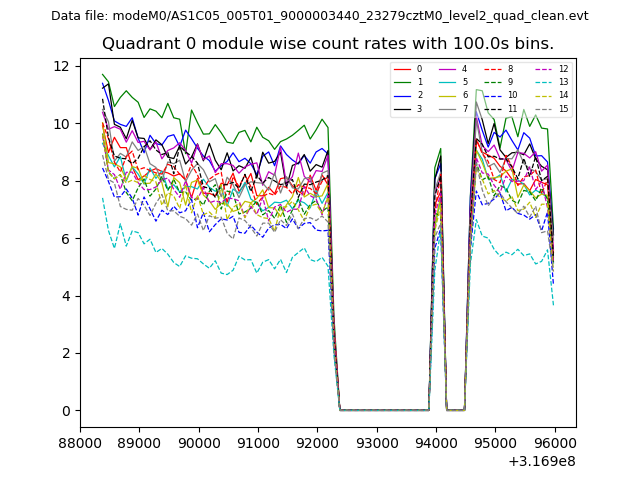 |
 |
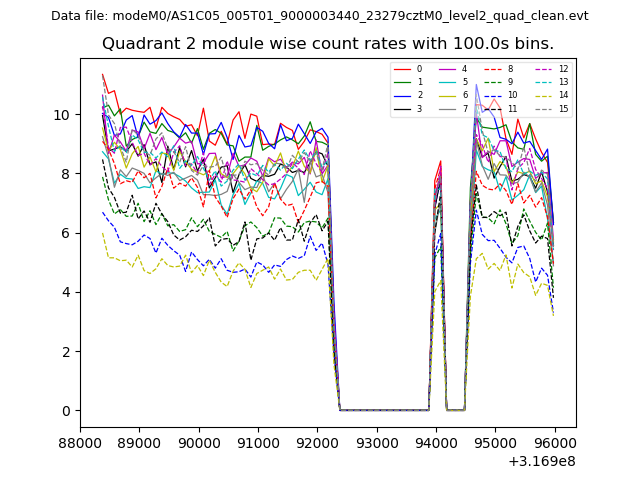
| Module-wise count rates for Quadrant B Data is divided into 100 sec bins |
 |
 |
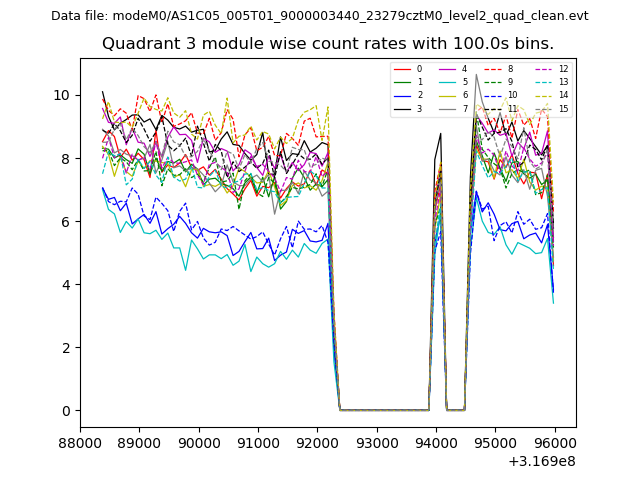
| Module-wise count rates for Quadrant C Data is divided into 100 sec bins |
 |
 |
| Module-wise count rates for Quadrant D Data is divided into 100 sec bins |
 |
 |
| Parameter | Plot |
|---|---|
| CZT HV Monitor | 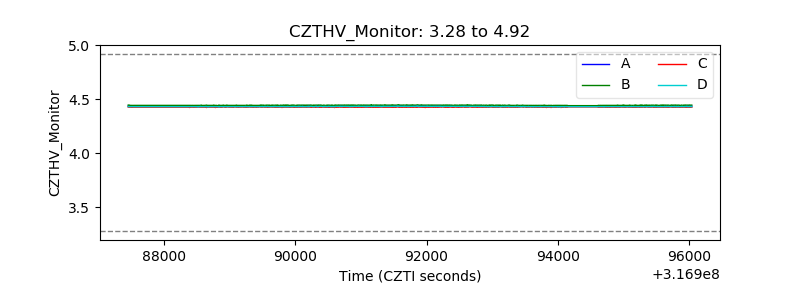 |
| D_VDD | 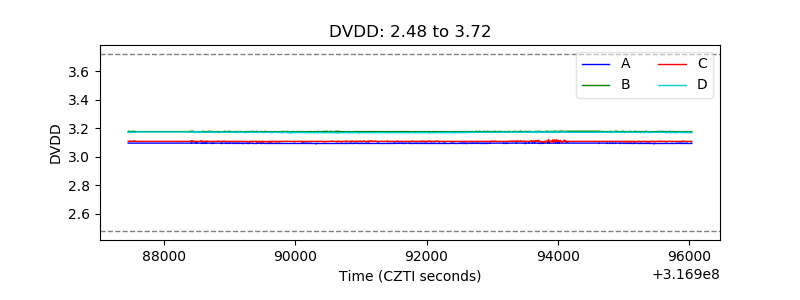 |
| Temperature 1 | 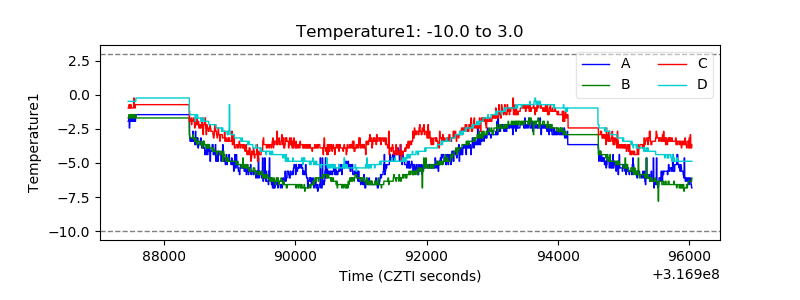 |
| Veto HV Monitor | 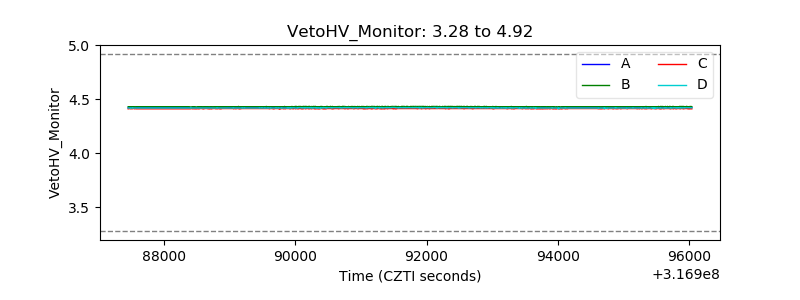 |
| Veto LLD | 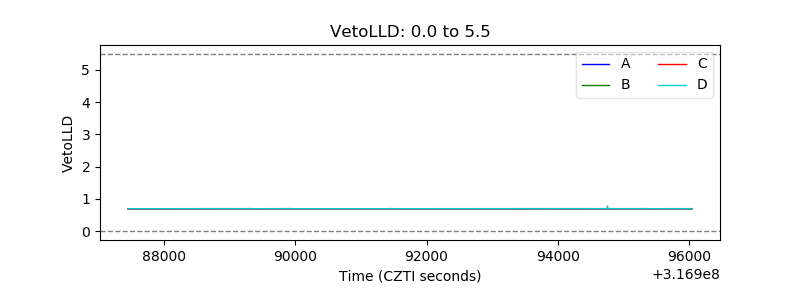 |
| Alpha Counter | 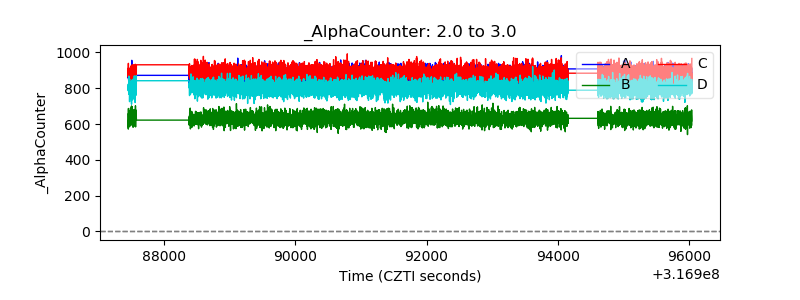 |
| _CPM_Rate | 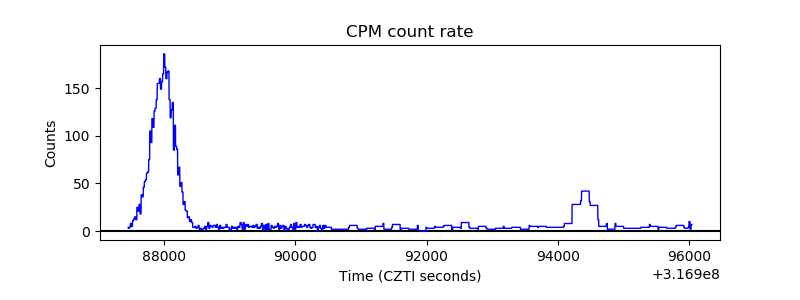 |
| CZT Counter | 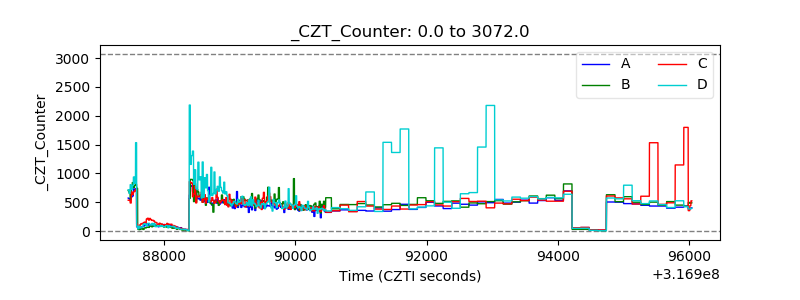 |
| +2.5 Volts monitor | 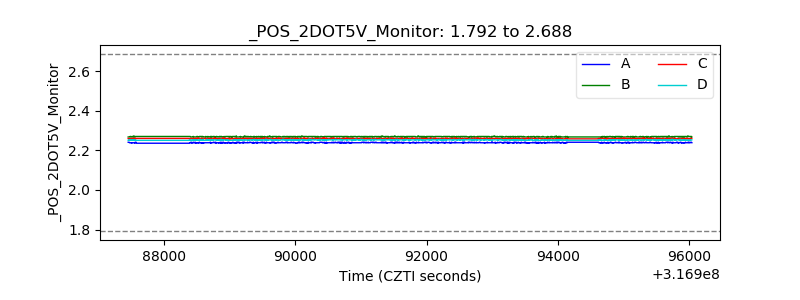 |
| +5 Volts monitor |  |
| _ROLL_ROT | 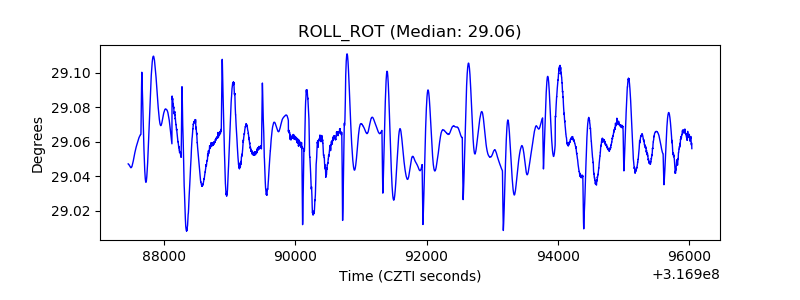 |
| _Roll_DEC | 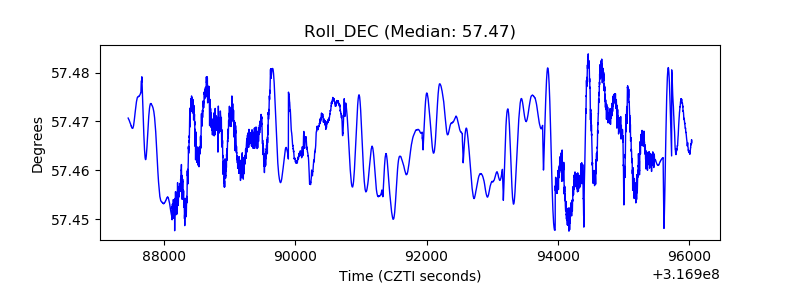 |
| _Roll_RA | 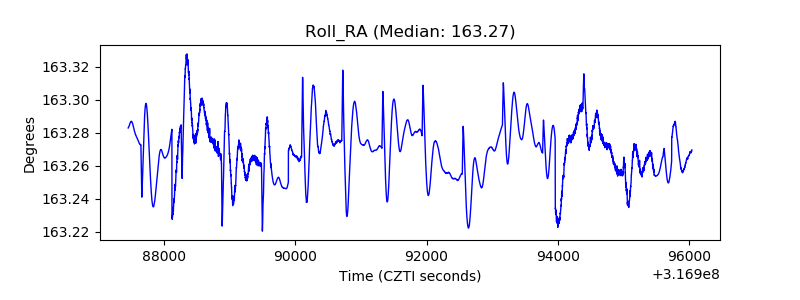 |
| Veto Counter | 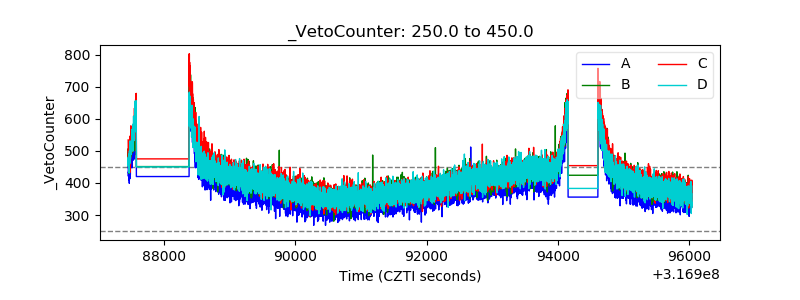 |