| Param | Original file | Final file |
|---|---|---|
| Filename | modeM0/AS1C05_005T01_9000003440_23280cztM0_level2.evt | modeM0/AS1C05_005T01_9000003440_23280cztM0_level2_quad_clean.evt |
| Size (bytes) | 519,433,920 | 111,643,200 |
| Size | 495.4 MB | 106.5 MB |
| Events in quadrant A | 3,491,585 | 723,900 |
| Events in quadrant B | 3,694,666 | 737,819 |
| Events in quadrant C | 3,957,200 | 706,164 |
| Events in quadrant D | 4,079,553 | 692,579 |
| Mode SS | |||
|---|---|---|---|
| Quadrant | BADHDUFLAG | Total packets | Discarded packets |
| A | 0 | 156 | 4 |
| B | 0 | 156 | 2 |
| C | 0 | 156 | 2 |
| D | 0 | 156 | 2 |
| Mode M9 | |||
|---|---|---|---|
| Quadrant | BADHDUFLAG | Total packets | Discarded packets |
| A | 0 | 8 | 0 |
| B | 0 | 8 | 0 |
| C | 0 | 8 | 0 |
| D | 0 | 8 | 0 |
| Mode M0 | |||
|---|---|---|---|
| Quadrant | BADHDUFLAG | Total packets | Discarded packets |
| A | 0 | 15826 | 271 |
| B | 0 | 16083 | 289 |
| C | 0 | 17082 | 272 |
| D | 0 | 17606 | 281 |
| Quadrant | Total seconds | Saturated seconds | Saturation percentage |
|---|---|---|---|
| A | 7486 | 45 | 0.601122% |
| B | 7481 | 86 | 1.149579% |
| C | 7486 | 205 | 2.738445% |
| D | 7484 | 128 | 1.710315% |
Noise dominated data is calculated using 1-second bins in cleaned event files. If a bin has >2000 counts, and if more than 50% of those come from <1% of pixels, then it is considered to be noise-dominated and hence unusable.
| Quadrant | # 1 sec bins | Bins with >0 counts | Bins with >2000 counts | High rate bins dominated by noise | Noise dominated (total time) | Noise dominated (detector-on time) | Marked lightcurve |
|---|---|---|---|---|---|---|---|
| A | 8383 | 7525 | 0 | 0 | 0.00% | 0.00% | 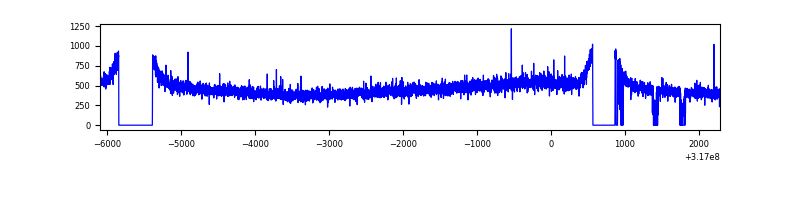 |
| B | 8384 | 7521 | 2 | 2 | 0.02% | 0.03% | 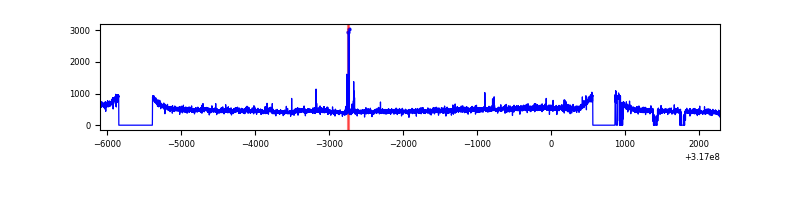 |
| C | 8383 | 7530 | 46 | 46 | 0.55% | 0.61% | 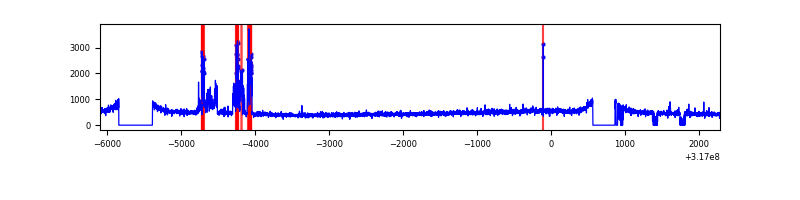 |
| D | 8383 | 7519 | 64 | 64 | 0.76% | 0.85% | 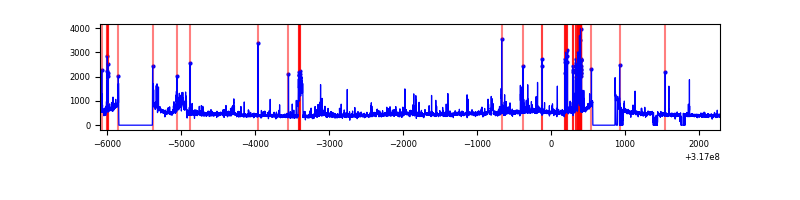 |
Top three noisy pixels from each quadrant. If the there are fewer than three noisy pixels in the level2.evt file, extra rows are filled as -1
| Pixel properties | Quadrant properties | ||||||
|---|---|---|---|---|---|---|---|
| Quadrant | DetID | PixID | Counts | Sigma | Mean | Median | Sigma |
| A | 13 | 254 | 12315 | 62.58 | 904 | 884 | 182.7 |
| A | 3 | 137 | 8275 | 40.46 | 904 | 884 | 182.7 |
| A | 0 | 226 | 7776 | 37.73 | 904 | 884 | 182.7 |
| B | 4 | 206 | 103880 | 594.6 | 906 | 882 | 173.2 |
| B | 12 | 111 | 21385 | 118.36 | 906 | 882 | 173.2 |
| B | 11 | 111 | 18874 | 103.86 | 906 | 882 | 173.2 |
| C | 10 | 9 | 381650 | 1854.64 | 874 | 880 | 205.3 |
| C | 14 | 238 | 138118 | 668.45 | 874 | 880 | 205.3 |
| C | 2 | 16 | 18212 | 84.42 | 874 | 880 | 205.3 |
| D | 7 | 238 | 279800 | 1313.65 | 879 | 854 | 212.3 |
| D | 12 | 238 | 112469 | 525.63 | 879 | 854 | 212.3 |
| D | 12 | 233 | 101800 | 475.39 | 879 | 854 | 212.3 |
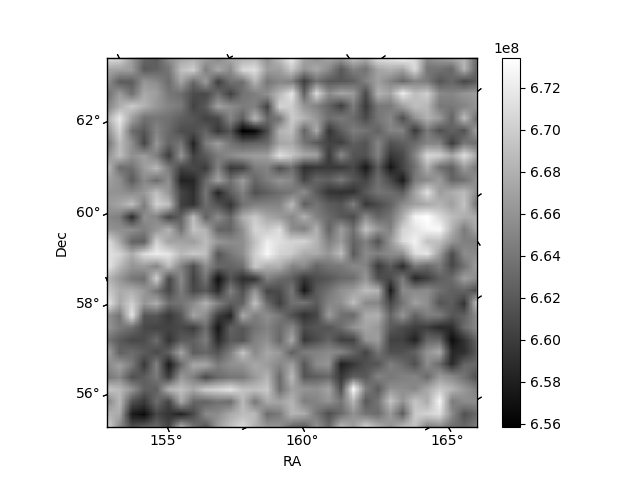
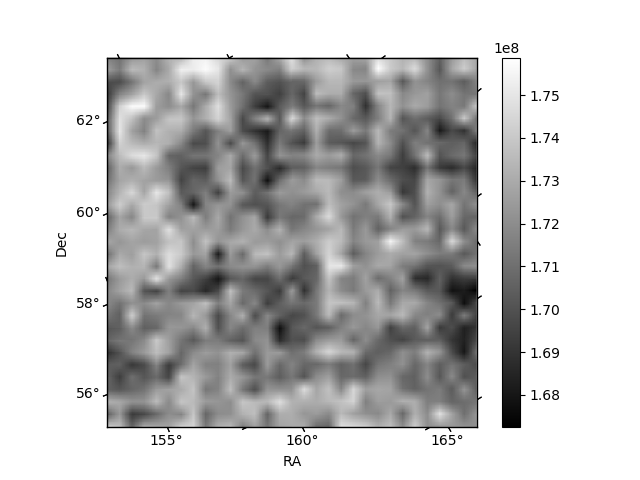
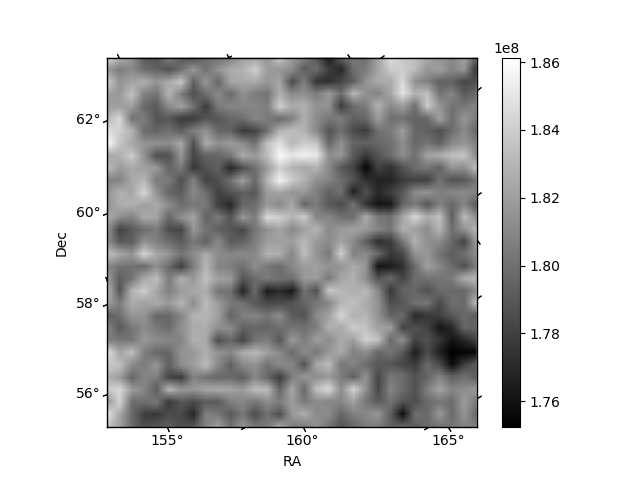
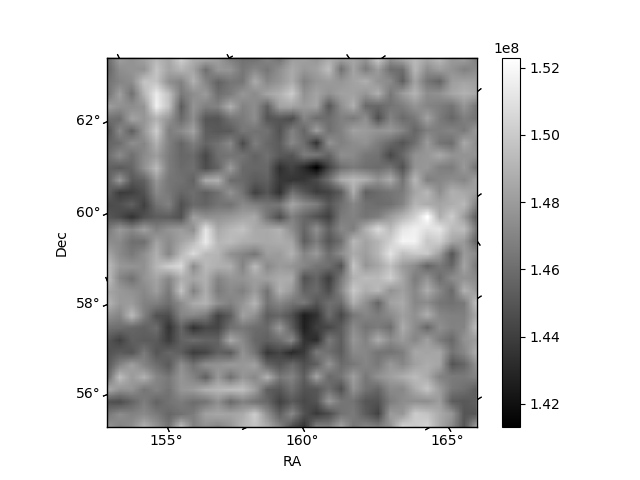
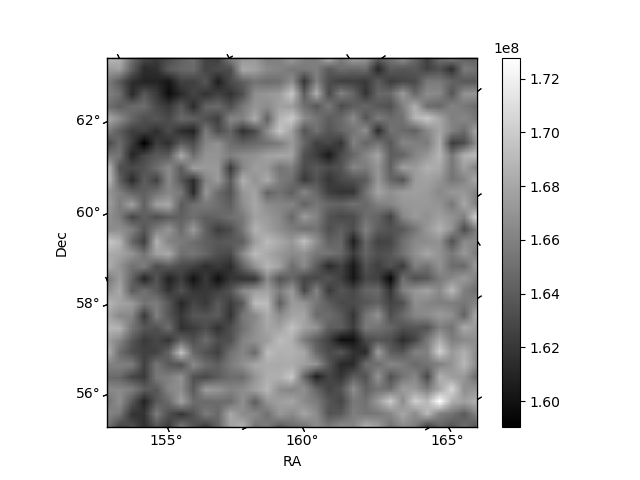
Histogram calculated using DETX and DETY for each event in the final _common_clean file
| Quadrant A | 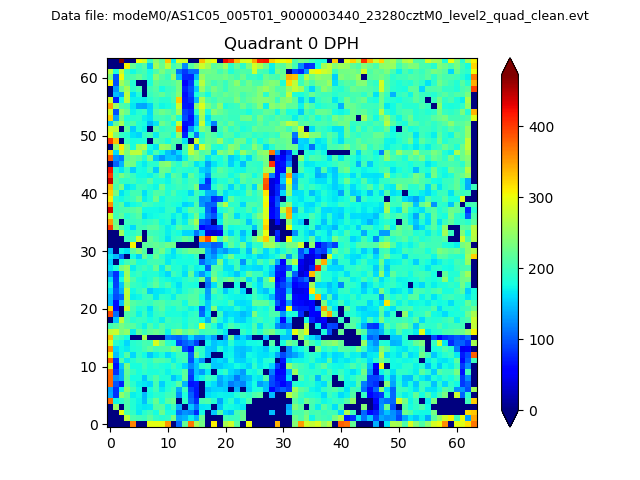 |
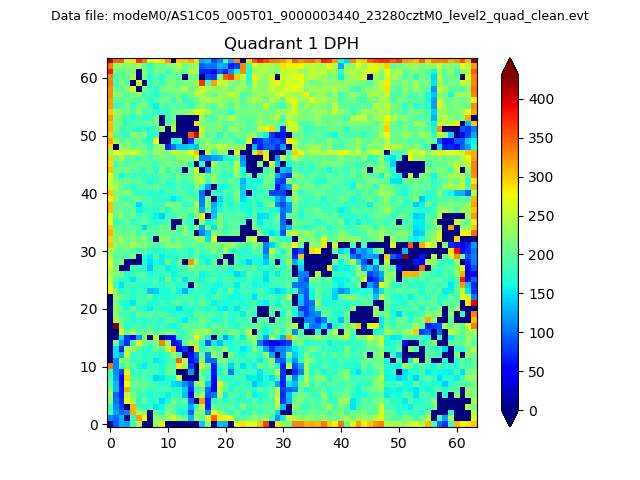 |
Quadrant B |
|---|---|---|---|
| Quadrant D | 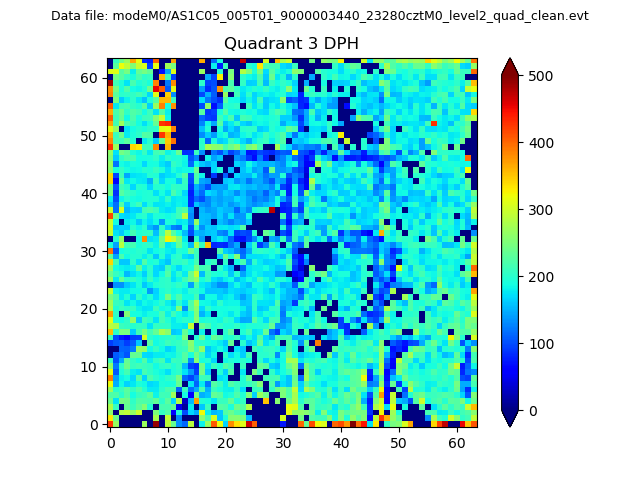 |
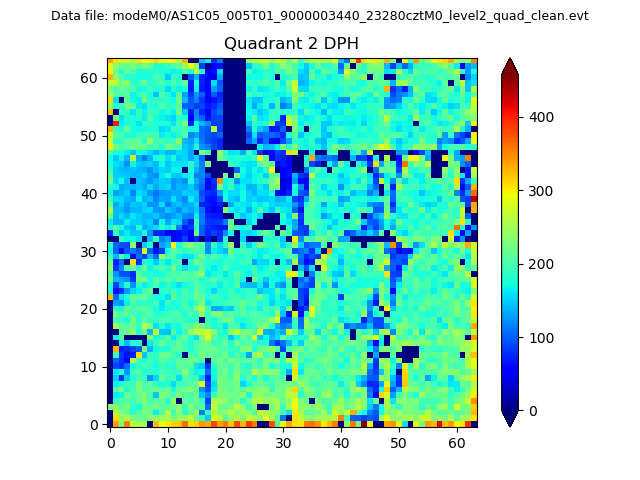 |
Quadrant C |
| Plot type | Count rate plots | Images |
|---|---|---|
| Comparison with Poisson distribution Blue bars denote a histogram of data divided into 1 sec bins. Red curve is a Poisson curve with rate = median count rate of data. |
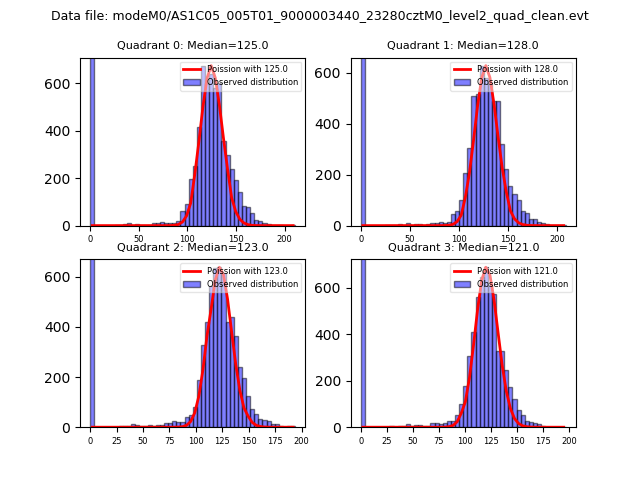 |
 |
| Quadrant-wise count rates Data is divided into 100 sec bins |
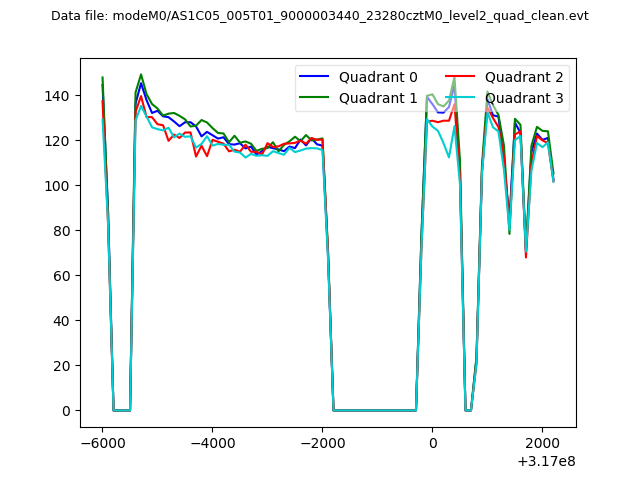 |
|
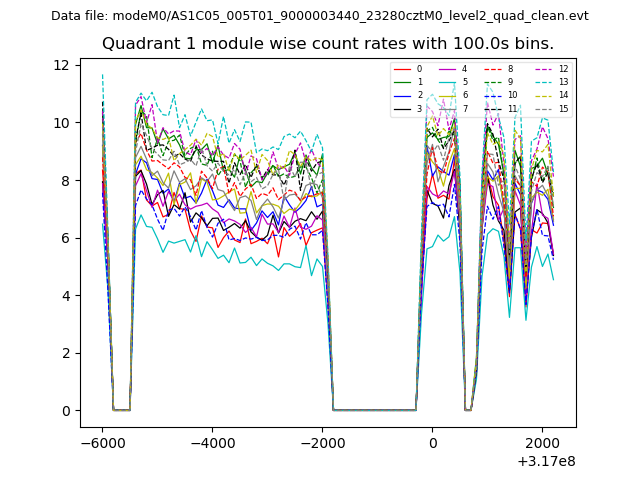
| Module-wise count rates for Quadrant A Data is divided into 100 sec bins |
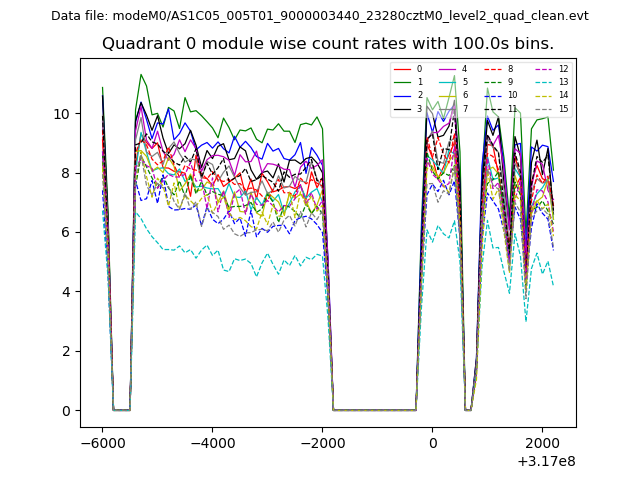 |
 |
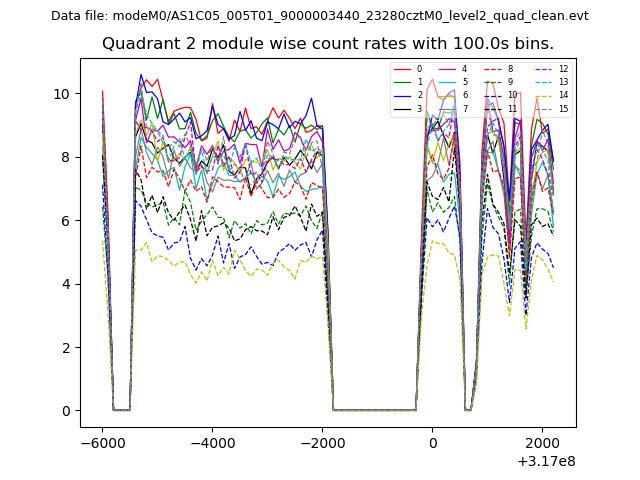
| Module-wise count rates for Quadrant B Data is divided into 100 sec bins |
 |
 |
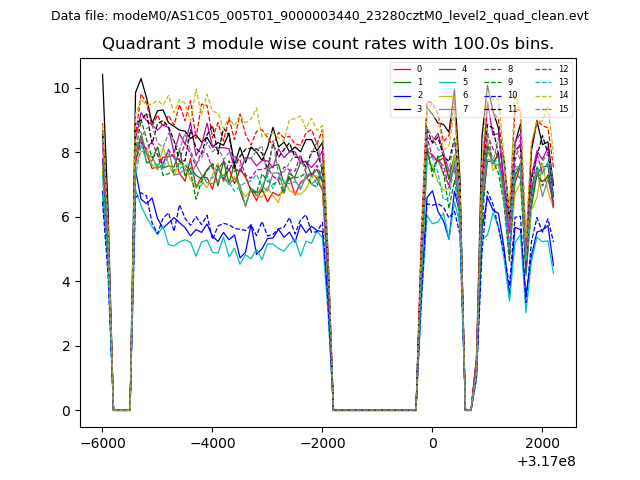
| Module-wise count rates for Quadrant C Data is divided into 100 sec bins |
 |
 |
| Module-wise count rates for Quadrant D Data is divided into 100 sec bins |
 |
 |
| Parameter | Plot |
|---|---|
| CZT HV Monitor | 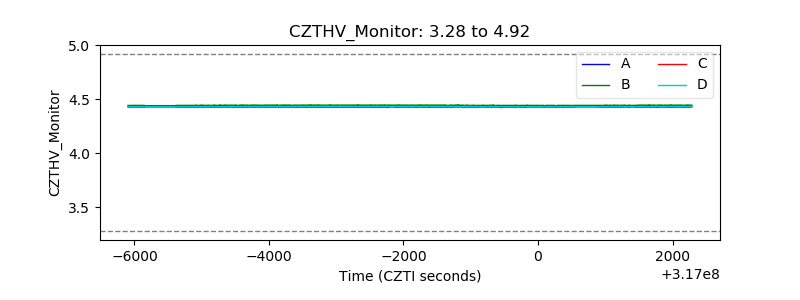 |
| D_VDD | 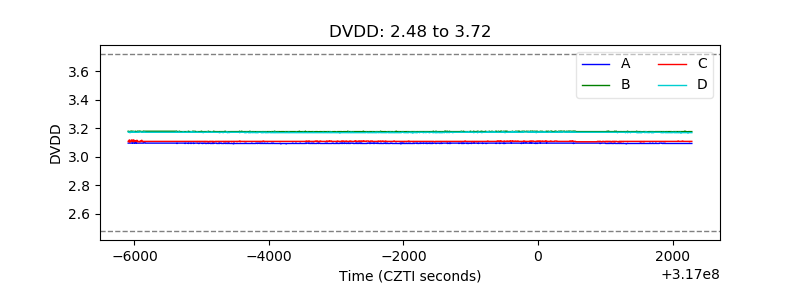 |
| Temperature 1 | 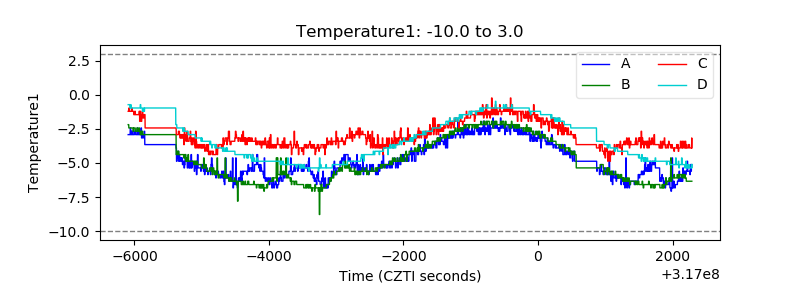 |
| Veto HV Monitor | 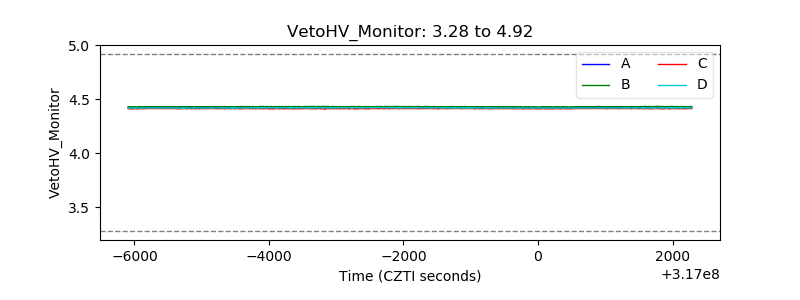 |
| Veto LLD | 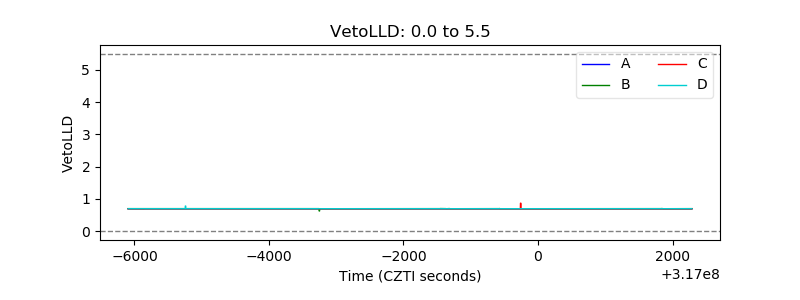 |
| Alpha Counter | 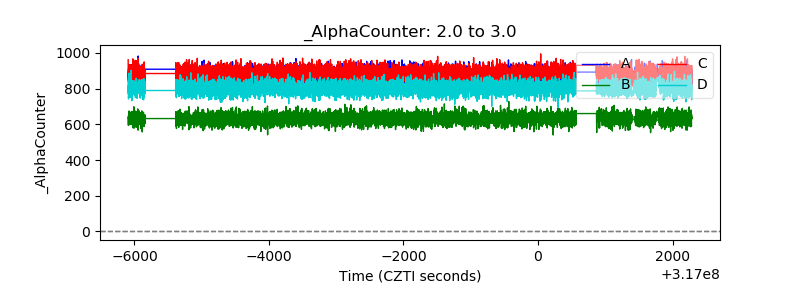 |
| _CPM_Rate | 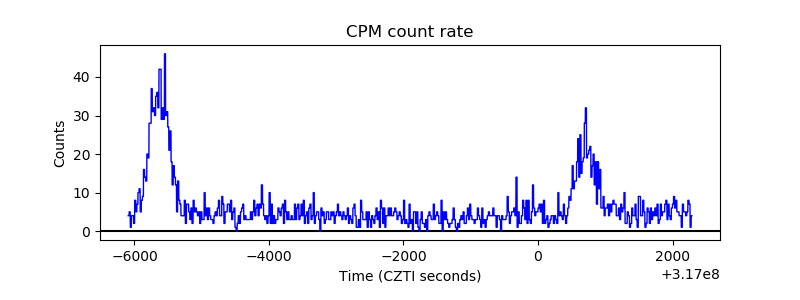 |
| CZT Counter |  |
| +2.5 Volts monitor |  |
| +5 Volts monitor |  |
| _ROLL_ROT | 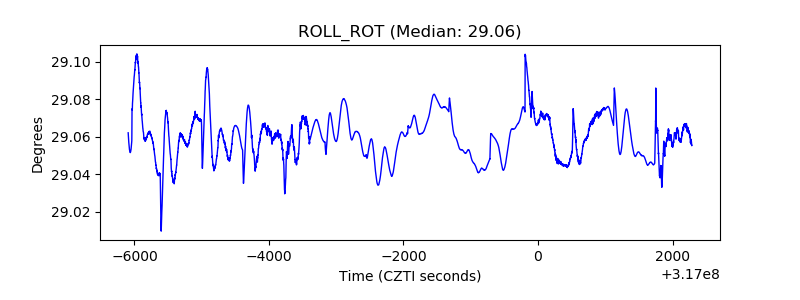 |
| _Roll_DEC | 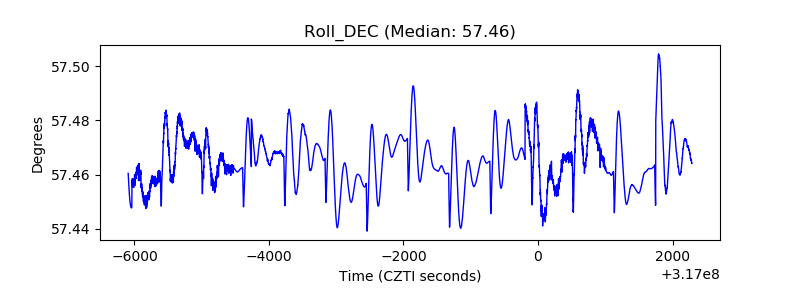 |
| _Roll_RA | 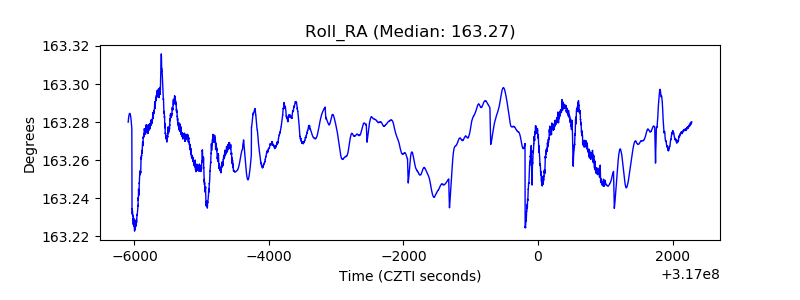 |
| Veto Counter | 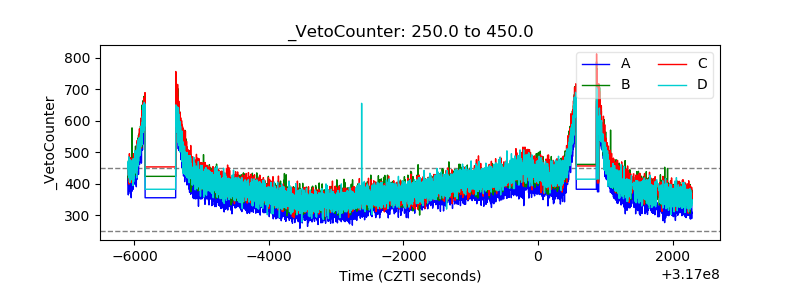 |