| Param | Original file | Final file |
|---|---|---|
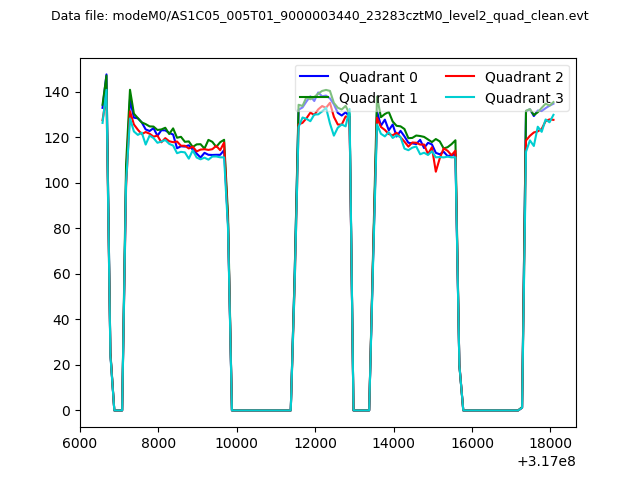
| Filename | modeM0/AS1C05_005T01_9000003440_23283cztM0_level2.evt | modeM0/AS1C05_005T01_9000003440_23283cztM0_level2_quad_clean.evt |
| Size (bytes) | 697,694,400 | 142,637,760 |
| Size | 665.4 MB | 136.0 MB |
| Events in quadrant A | 4,815,700 | 905,223 |
| Events in quadrant B | 4,904,907 | 923,820 |
| Events in quadrant C | 5,027,328 | 884,542 |
| Events in quadrant D | 5,661,132 | 870,378 |
| Mode SS | |||
|---|---|---|---|
| Quadrant | BADHDUFLAG | Total packets | Discarded packets |
| A | 0 | 216 | 0 |
| B | 0 | 216 | 0 |
| C | 0 | 216 | 0 |
| D | 0 | 216 | 0 |
| Mode M9 | |||
|---|---|---|---|
| Quadrant | BADHDUFLAG | Total packets | Discarded packets |
| A | 0 | 10 | 0 |
| B | 0 | 10 | 0 |
| C | 0 | 10 | 0 |
| D | 0 | 10 | 0 |
| Mode M0 | |||
|---|---|---|---|
| Quadrant | BADHDUFLAG | Total packets | Discarded packets |
| A | 0 | 21671 | 2 |
| B | 0 | 21763 | 2 |
| C | 0 | 22168 | 2 |
| D | 0 | 24548 | 2 |
| Quadrant | Total seconds | Saturated seconds | Saturation percentage |
|---|---|---|---|
| A | 10628 | 71 | 0.668047% |
| B | 10629 | 96 | 0.903189% |
| C | 10629 | 192 | 1.806379% |
| D | 10629 | 189 | 1.778154% |
Noise dominated data is calculated using 1-second bins in cleaned event files. If a bin has >2000 counts, and if more than 50% of those come from <1% of pixels, then it is considered to be noise-dominated and hence unusable.
| Quadrant | # 1 sec bins | Bins with >0 counts | Bins with >2000 counts | High rate bins dominated by noise | Noise dominated (total time) | Noise dominated (detector-on time) | Marked lightcurve |
|---|---|---|---|---|---|---|---|
| A | 11603 | 10629 | 0 | 0 | 0.00% | 0.00% | 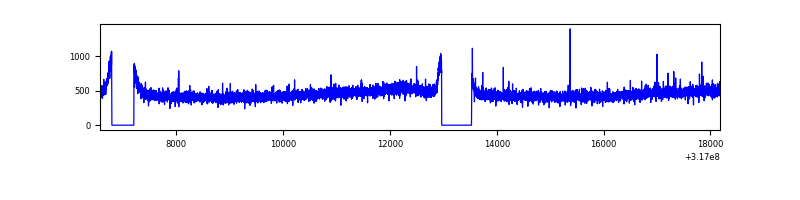 |
| B | 11604 | 10630 | 0 | 0 | 0.00% | 0.00% | 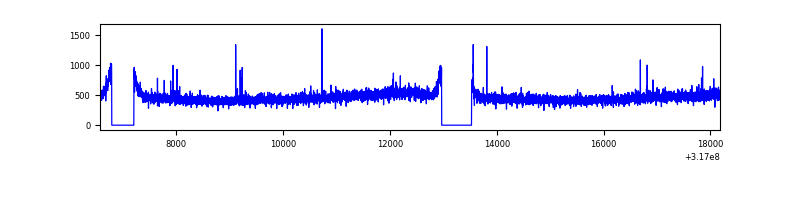 |
| C | 11604 | 10631 | 38 | 38 | 0.33% | 0.36% | 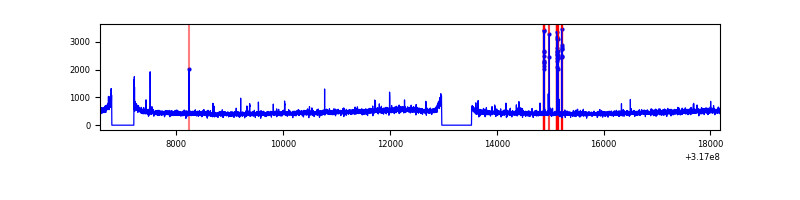 |
| D | 11604 | 10631 | 113 | 113 | 0.97% | 1.06% | 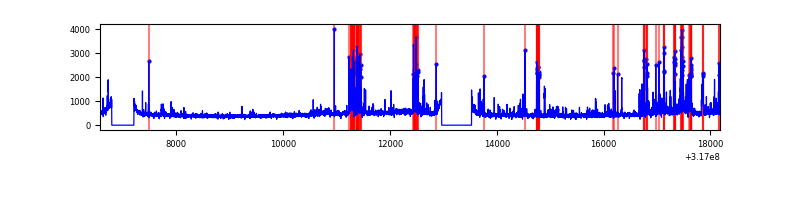 |
Top three noisy pixels from each quadrant. If the there are fewer than three noisy pixels in the level2.evt file, extra rows are filled as -1
| Pixel properties | Quadrant properties | ||||||
|---|---|---|---|---|---|---|---|
| Quadrant | DetID | PixID | Counts | Sigma | Mean | Median | Sigma |
| A | 13 | 254 | 16341 | 60.29 | 1245 | 1216 | 250.9 |
| A | 6 | 16 | 11899 | 42.58 | 1245 | 1216 | 250.9 |
| A | 3 | 137 | 11409 | 40.63 | 1245 | 1216 | 250.9 |
| B | 12 | 111 | 29730 | 120.45 | 1243 | 1212 | 236.8 |
| B | 11 | 111 | 26272 | 105.85 | 1243 | 1212 | 236.8 |
| B | 14 | 111 | 22988 | 91.98 | 1243 | 1212 | 236.8 |
| C | 14 | 238 | 190854 | 681.76 | 1193 | 1199 | 278.2 |
| C | 10 | 9 | 151332 | 539.69 | 1193 | 1199 | 278.2 |
| C | 0 | 207 | 15121 | 50.05 | 1193 | 1199 | 278.2 |
| D | 1 | 52 | 481803 | 1623.58 | 1209 | 1172 | 296.0 |
| D | 12 | 233 | 239262 | 804.27 | 1209 | 1172 | 296.0 |
| D | 1 | 239 | 105825 | 353.52 | 1209 | 1172 | 296.0 |
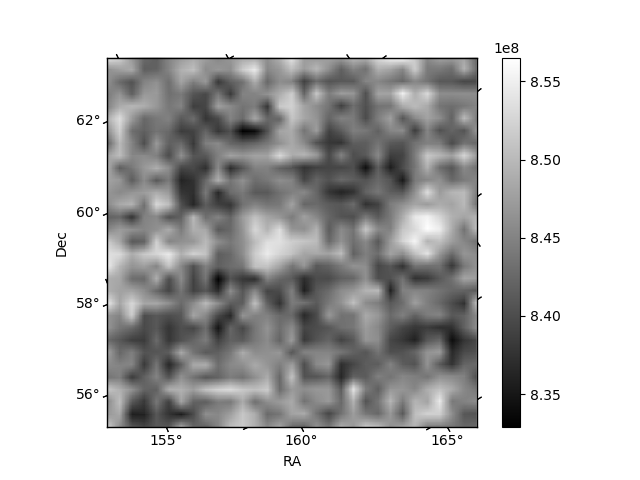
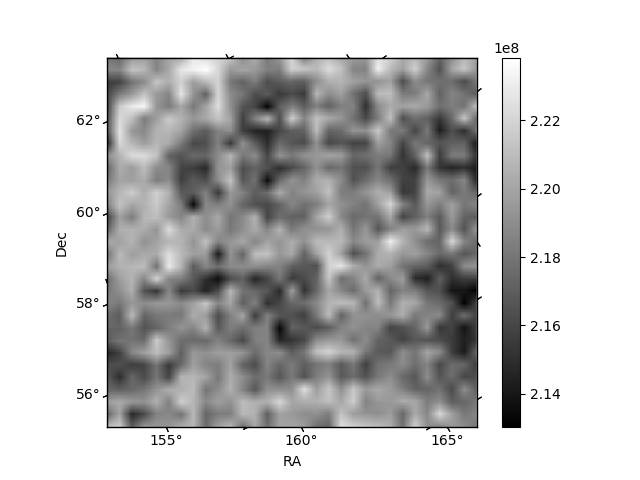
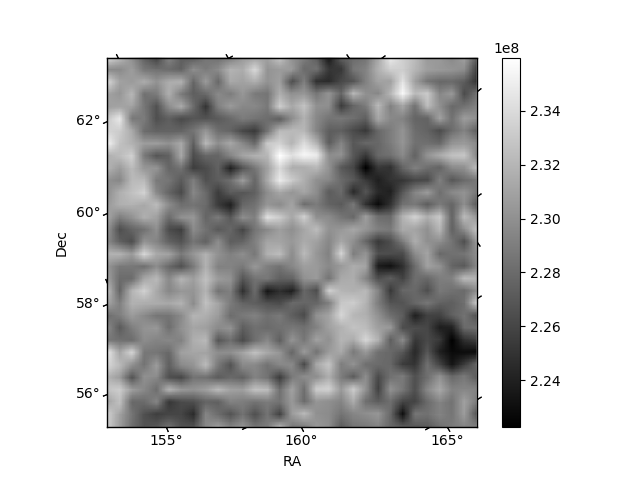
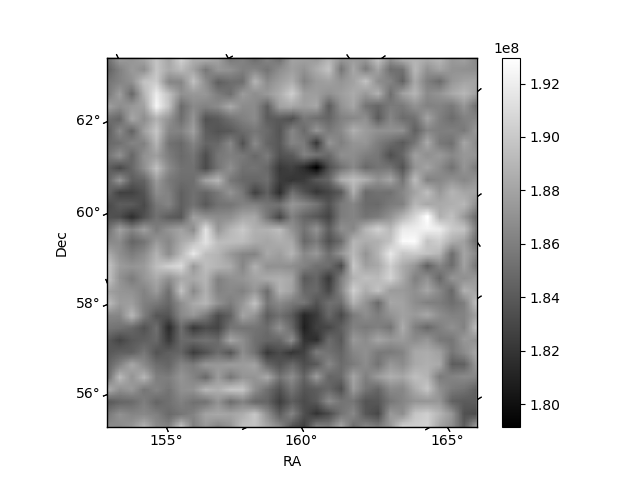
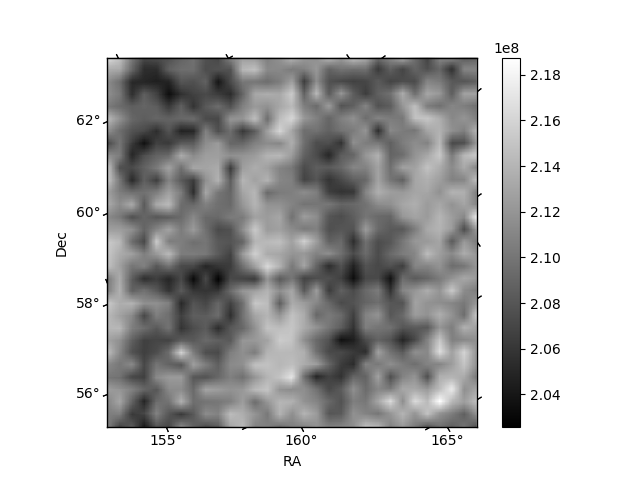
Histogram calculated using DETX and DETY for each event in the final _common_clean file
| Quadrant A | 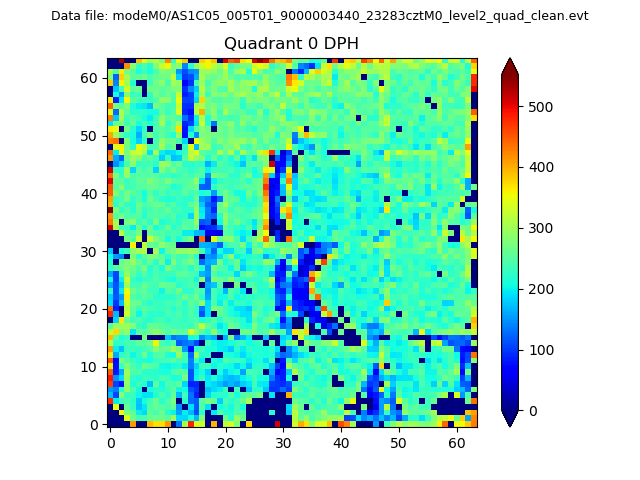 |
 |
Quadrant B |
|---|---|---|---|
| Quadrant D | 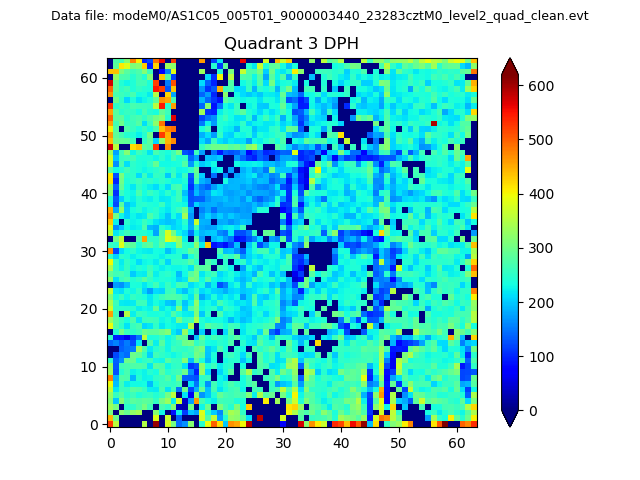 |
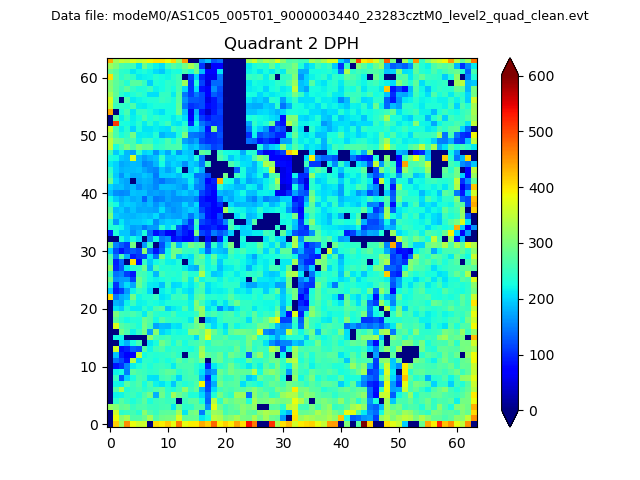 |
Quadrant C |
| Plot type | Count rate plots | Images |
|---|---|---|
| Comparison with Poisson distribution Blue bars denote a histogram of data divided into 1 sec bins. Red curve is a Poisson curve with rate = median count rate of data. |
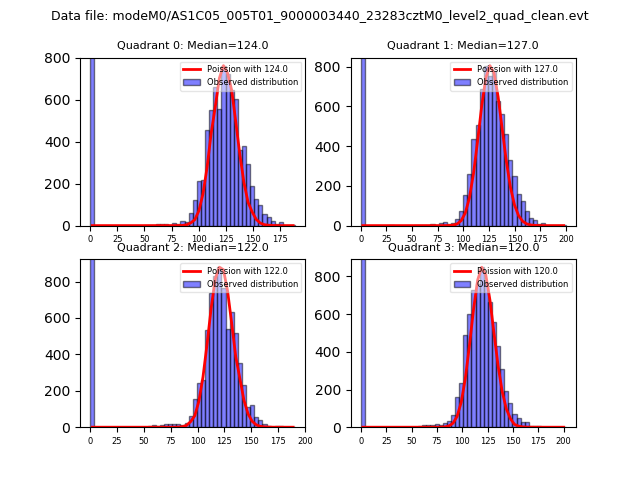 |
 |
| Quadrant-wise count rates Data is divided into 100 sec bins |
 |
|
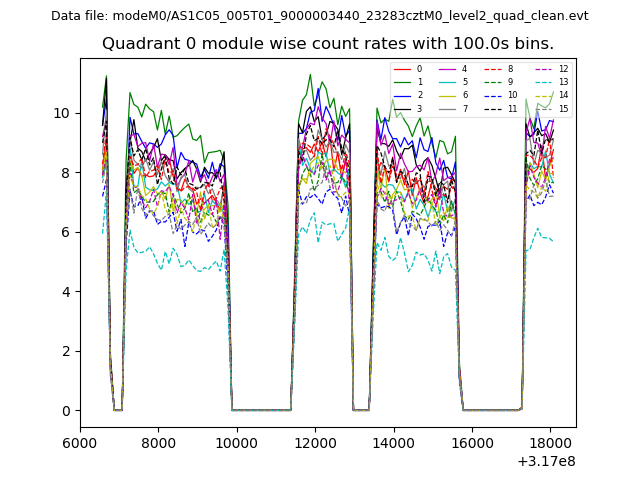
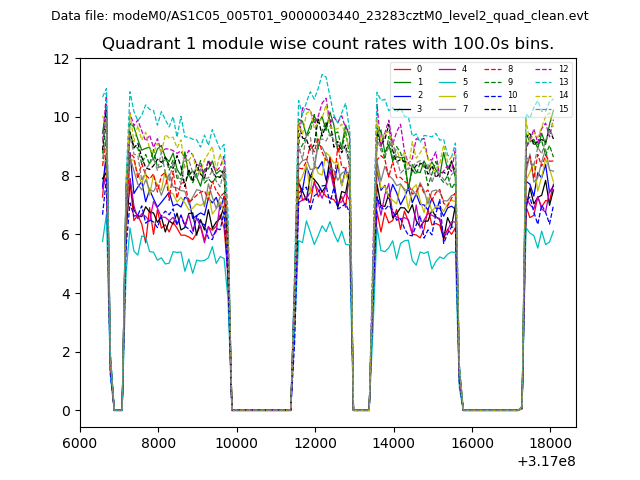
| Module-wise count rates for Quadrant A Data is divided into 100 sec bins |
 |
 |
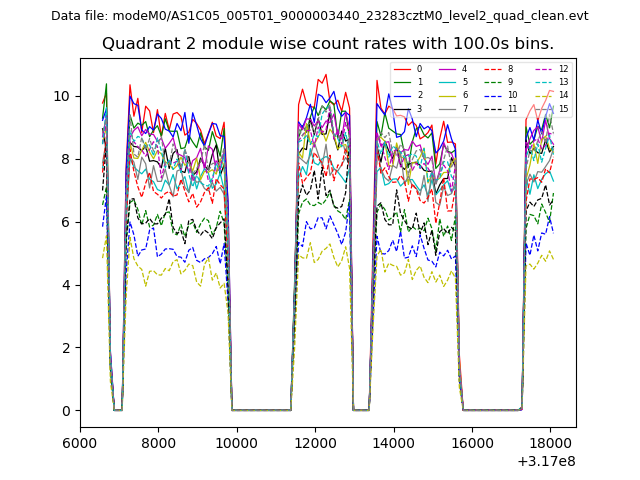
| Module-wise count rates for Quadrant B Data is divided into 100 sec bins |
 |
 |
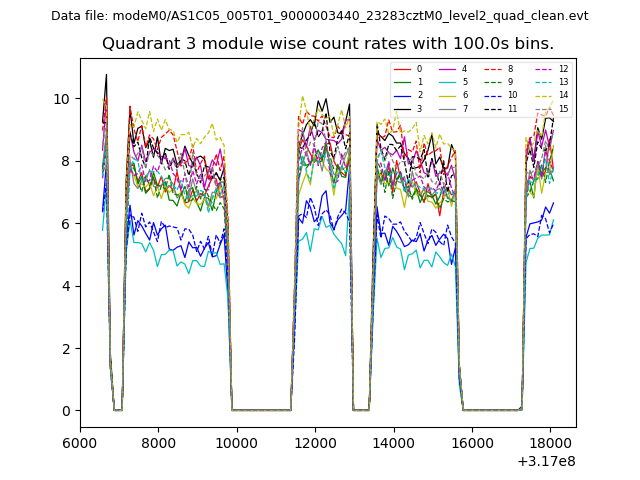
| Module-wise count rates for Quadrant C Data is divided into 100 sec bins |
 |
 |
| Module-wise count rates for Quadrant D Data is divided into 100 sec bins |
 |
 |
| Parameter | Plot |
|---|---|
| CZT HV Monitor | 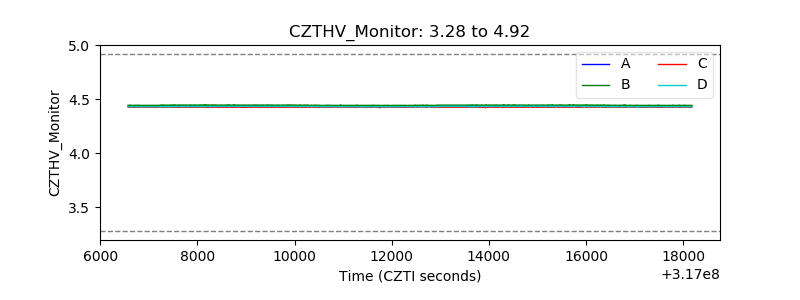 |
| D_VDD | 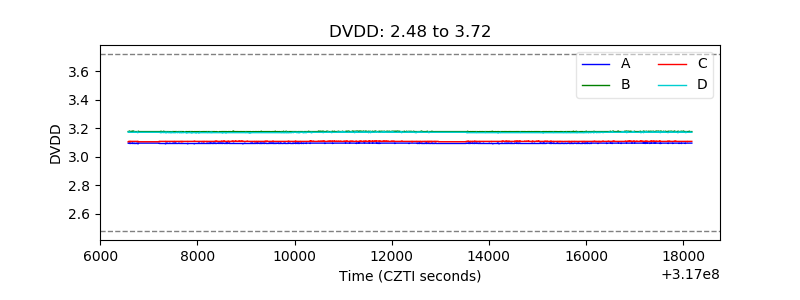 |
| Temperature 1 | 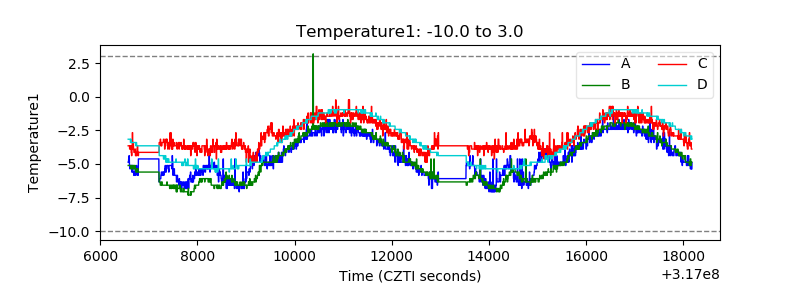 |
| Veto HV Monitor |  |
| Veto LLD |  |
| Alpha Counter | 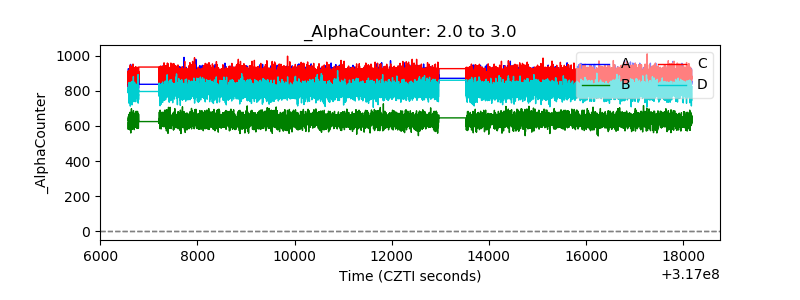 |
| _CPM_Rate | 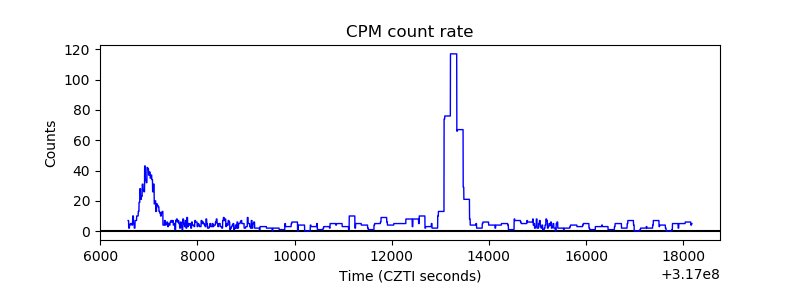 |
| CZT Counter | 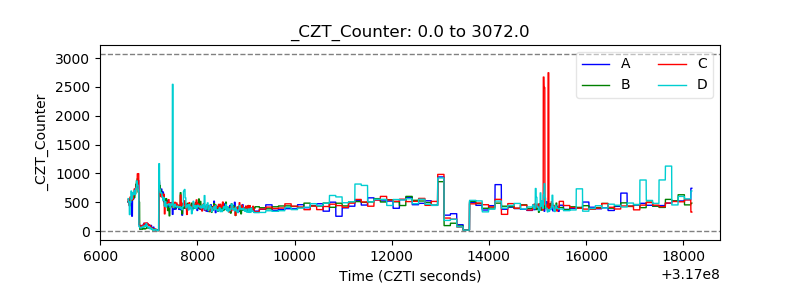 |
| +2.5 Volts monitor | 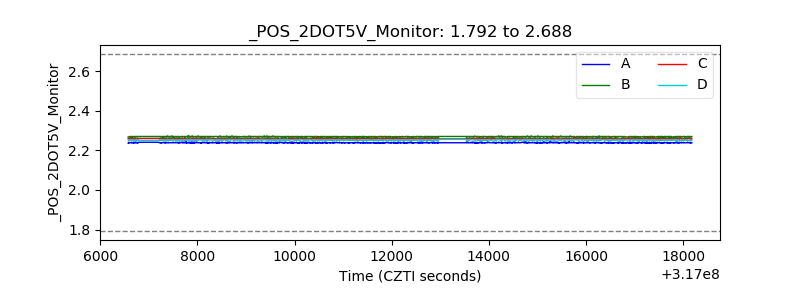 |
| +5 Volts monitor |  |
| _ROLL_ROT | 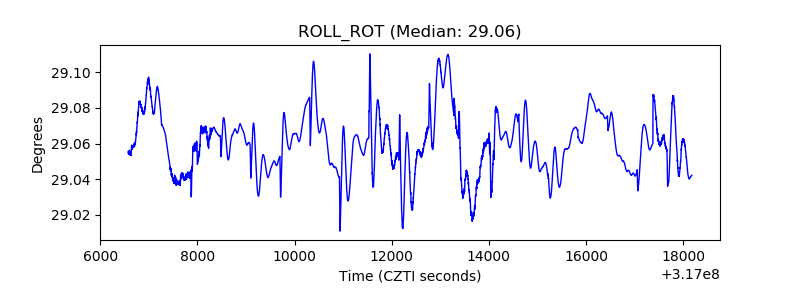 |
| _Roll_DEC | 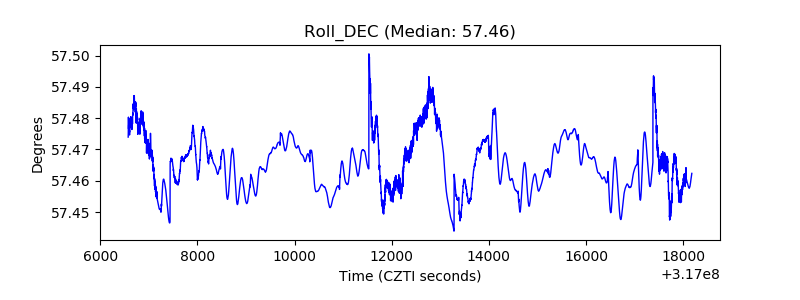 |
| _Roll_RA | 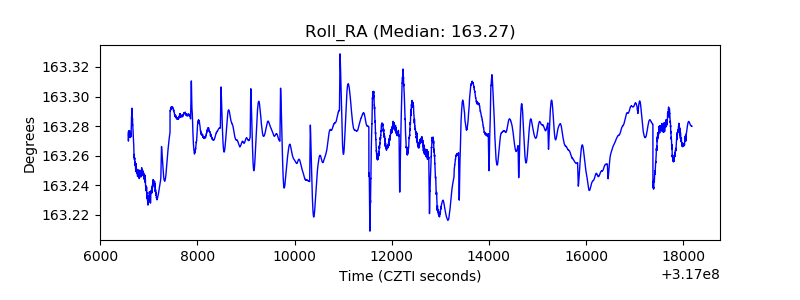 |
| Veto Counter | 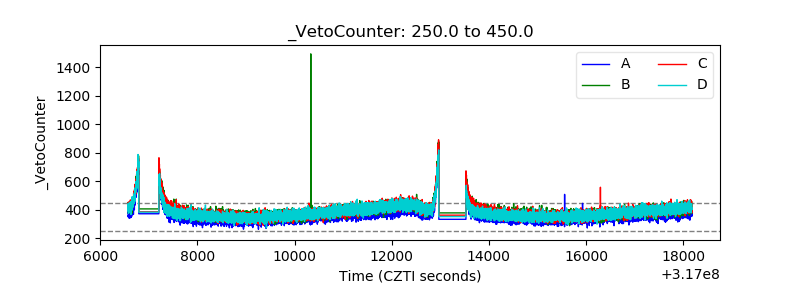 |