| Param | Original file | Final file |
|---|---|---|
| Filename | modeM0/AS1C05_012T03_9000003442cztM0_level2.fits | modeM0/AS1C05_012T03_9000003442cztM0_level2_quad_clean.evt |
| Size (bytes) | 755,524,800 | 900,892,800 |
| Size | 720.5 MB | 859.2 MB |
| Events in quadrant A | 4,675,490 | 5,772,862 |
| Events in quadrant B | 4,449,104 | 5,765,257 |
| Events in quadrant C | 4,536,178 | 5,505,078 |
| Events in quadrant D | 3,883,536 | 4,907,032 |
| Mode M9 | |||
|---|---|---|---|
| Quadrant | BADHDUFLAG | Total packets | Discarded packets |
| A | 0 | 135 | 0 |
| B | 0 | 135 | 0 |
| C | 0 | 135 | 0 |
| D | 0 | 135 | 0 |
| Mode SS | |||
|---|---|---|---|
| Quadrant | BADHDUFLAG | Total packets | Discarded packets |
| A | 0 | 1582 | 0 |
| B | 0 | 1582 | 0 |
| C | 0 | 1582 | 0 |
| D | 0 | 1582 | 0 |
| Mode M0 | |||
|---|---|---|---|
| Quadrant | BADHDUFLAG | Total packets | Discarded packets |
| A | 0 | 159954 | 0 |
| B | 0 | 161807 | 0 |
| C | 0 | 164013 | 0 |
| D | 0 | 221206 | 0 |
| Quadrant | Total seconds | Saturated seconds | Saturation percentage |
|---|---|---|---|
| A | 77833 | 546 | 0.701502% |
| B | 77833 | 793 | 1.018848% |
| C | 77834 | 1067 | 1.370866% |
| D | 77834 | 4701 | 6.039777% |
Noise dominated data is calculated using 1-second bins in cleaned event files. If a bin has >2000 counts, and if more than 50% of those come from <1% of pixels, then it is considered to be noise-dominated and hence unusable.
| Quadrant | # 1 sec bins | Bins with >0 counts | Bins with >2000 counts | High rate bins dominated by noise | Noise dominated (total time) | Noise dominated (detector-on time) | Marked lightcurve |
|---|---|---|---|---|---|---|---|
| A | 91069 | 77829 | 0 | 0 | 0.00% | 0.00% | 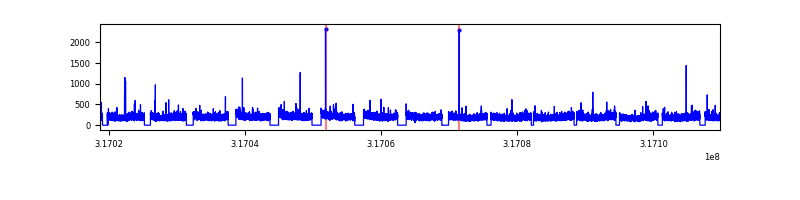 |
| B | 91069 | 77828 | 0 | 0 | 0.00% | 0.00% |  |
| C | 91069 | 77833 | 0 | 0 | 0.00% | 0.00% |  |
| D | 91069 | 77642 | 0 | 0 | 0.00% | 0.00% |  |
Top three noisy pixels from each quadrant. If the there are fewer than three noisy pixels in the level2.evt file, extra rows are filled as -1
| Pixel properties | Quadrant properties | ||||||
|---|---|---|---|---|---|---|---|
| Quadrant | DetID | PixID | Counts | Sigma | Mean | Median | Sigma |
| A | 0 | 29 | 4335 | 10.62 | 1217 | 1144 | 300.6 |
| A | 7 | 110 | 3722 | 8.58 | 1217 | 1144 | 300.6 |
| A | 9 | 19 | 3476 | 7.76 | 1217 | 1144 | 300.6 |
| B | 2 | 9 | 3512 | 10.21 | 1177 | 1126 | 233.7 |
| B | 3 | 80 | 3004 | 8.04 | 1177 | 1126 | 233.7 |
| B | 5 | 128 | 2963 | 7.86 | 1177 | 1126 | 233.7 |
| C | 12 | 241 | 3178 | 6.79 | 1198 | 1128 | 301.9 |
| C | 3 | 126 | 3172 | 6.77 | 1198 | 1128 | 301.9 |
| C | 2 | 191 | 3034 | 6.31 | 1198 | 1128 | 301.9 |
| D | 3 | 14 | 2844 | 6.21 | 1109 | 1015 | 294.4 |
| D | 6 | 38 | 2731 | 5.83 | 1109 | 1015 | 294.4 |
| D | 15 | 46 | 2722 | 5.8 | 1109 | 1015 | 294.4 |
Histogram calculated using DETX and DETY for each event in the final _common_clean file
| Quadrant A |  |
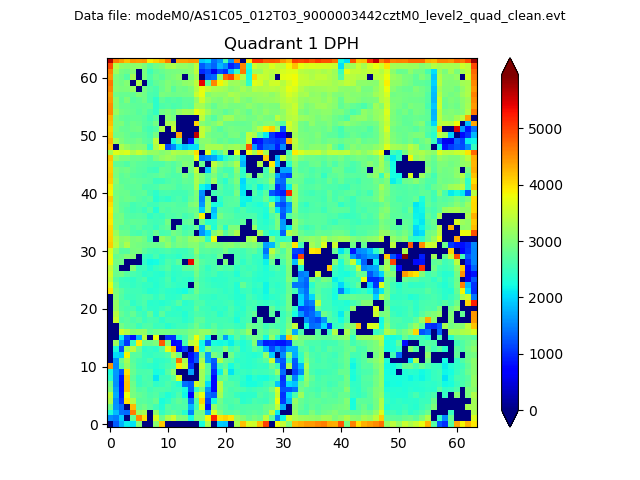 |
Quadrant B |
|---|---|---|---|
| Quadrant D |  |
 |
Quadrant C |
| Plot type | Count rate plots | Images |
|---|---|---|
| Comparison with Poisson distribution Blue bars denote a histogram of data divided into 1 sec bins. Red curve is a Poisson curve with rate = median count rate of data. |
 |
 |
| Quadrant-wise count rates Data is divided into 100 sec bins |
 |
|
| Module-wise count rates for Quadrant A Data is divided into 100 sec bins |
 |
 |
| Module-wise count rates for Quadrant B Data is divided into 100 sec bins |
 |
 |
| Module-wise count rates for Quadrant C Data is divided into 100 sec bins |
 |
 |
| Module-wise count rates for Quadrant D Data is divided into 100 sec bins |
 |
 |
| Parameter | Plot |
|---|---|
| CZT HV Monitor |  |
| D_VDD |  |
| Temperature 1 |  |
| Veto HV Monitor |  |
| Veto LLD |  |
| Alpha Counter |  |
| _CPM_Rate | 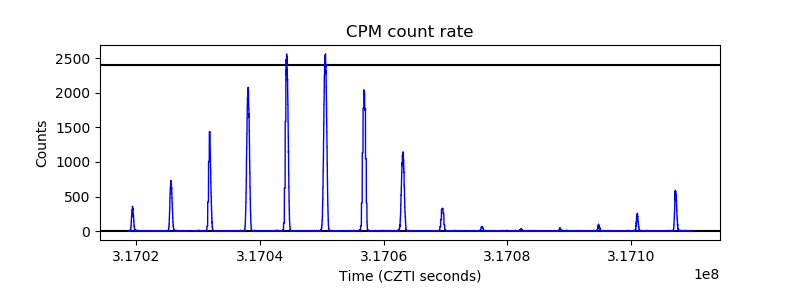 |
| CZT Counter |  |
| +2.5 Volts monitor |  |
| +5 Volts monitor |  |
| _ROLL_ROT |  |
| _Roll_DEC |  |
| _Roll_RA |  |
| Veto Counter |  |