| Param | Original file | Final file |
|---|---|---|
| Filename | modeM0/AS1C05_012T03_9000003442_23283cztM0_level2.evt | modeM0/AS1C05_012T03_9000003442_23283cztM0_level2_quad_clean.evt |
| Size (bytes) | 139,429,440 | 36,072,000 |
| Size | 133.0 MB | 34.4 MB |
| Events in quadrant A | 896,787 | 240,817 |
| Events in quadrant B | 932,297 | 246,802 |
| Events in quadrant C | 909,909 | 237,346 |
| Events in quadrant D | 1,351,456 | 228,099 |
| Mode M9 | |||
|---|---|---|---|
| Quadrant | BADHDUFLAG | Total packets | Discarded packets |
| A | 0 | 8 | 0 |
| B | 0 | 8 | 0 |
| C | 0 | 8 | 0 |
| D | 0 | 8 | 0 |
| Mode SS | |||
|---|---|---|---|
| Quadrant | BADHDUFLAG | Total packets | Discarded packets |
| A | 0 | 38 | 0 |
| B | 0 | 38 | 0 |
| C | 0 | 38 | 0 |
| D | 0 | 38 | 0 |
| Mode M0 | |||
|---|---|---|---|
| Quadrant | BADHDUFLAG | Total packets | Discarded packets |
| A | 0 | 3943 | 1 |
| B | 0 | 3984 | 2 |
| C | 0 | 3949 | 1 |
| D | 0 | 5419 | 1 |
| Quadrant | Total seconds | Saturated seconds | Saturation percentage |
|---|---|---|---|
| A | 1914 | 19 | 0.992685% |
| B | 1913 | 37 | 1.934135% |
| C | 1913 | 23 | 1.202300% |
| D | 1913 | 70 | 3.659174% |
Noise dominated data is calculated using 1-second bins in cleaned event files. If a bin has >2000 counts, and if more than 50% of those come from <1% of pixels, then it is considered to be noise-dominated and hence unusable.
| Quadrant | # 1 sec bins | Bins with >0 counts | Bins with >2000 counts | High rate bins dominated by noise | Noise dominated (total time) | Noise dominated (detector-on time) | Marked lightcurve |
|---|---|---|---|---|---|---|---|
| A | 2654 | 1916 | 0 | 0 | 0.00% | 0.00% | 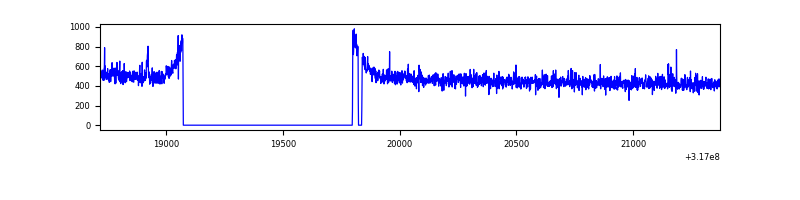 |
| B | 2653 | 1915 | 2 | 2 | 0.08% | 0.10% | 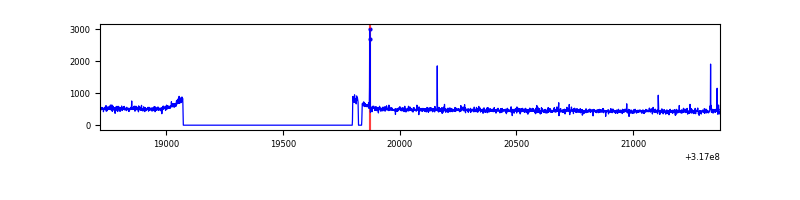 |
| C | 2653 | 1915 | 0 | 0 | 0.00% | 0.00% | 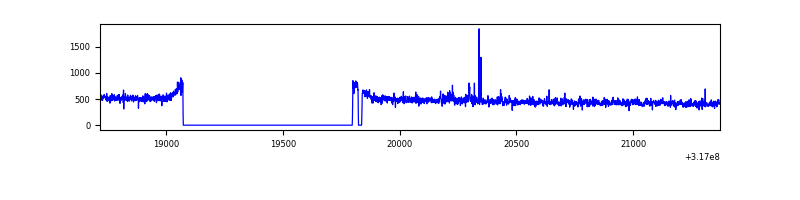 |
| D | 2653 | 1915 | 26 | 26 | 0.98% | 1.36% | 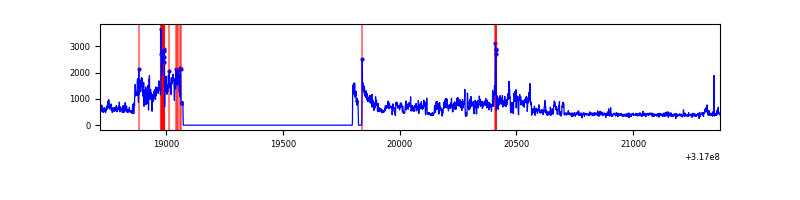 |
Top three noisy pixels from each quadrant. If the there are fewer than three noisy pixels in the level2.evt file, extra rows are filled as -1
| Pixel properties | Quadrant properties | ||||||
|---|---|---|---|---|---|---|---|
| Quadrant | DetID | PixID | Counts | Sigma | Mean | Median | Sigma |
| A | 6 | 16 | 4768 | 93.92 | 231 | 226 | 48.4 |
| A | 13 | 254 | 2957 | 56.47 | 231 | 226 | 48.4 |
| A | 3 | 137 | 2173 | 40.26 | 231 | 226 | 48.4 |
| B | 4 | 173 | 11592 | 242.85 | 232 | 226 | 46.8 |
| B | 5 | 172 | 9926 | 207.25 | 232 | 226 | 46.8 |
| B | 12 | 111 | 5859 | 120.35 | 232 | 226 | 46.8 |
| C | 14 | 238 | 34584 | 641.61 | 220 | 221 | 53.6 |
| C | 10 | 9 | 9365 | 170.73 | 220 | 221 | 53.6 |
| C | 3 | 233 | 3066 | 53.12 | 220 | 221 | 53.6 |
| D | 7 | 238 | 402451 | 7392.69 | 218 | 210 | 54.4 |
| D | 1 | 52 | 101686 | 1865.0 | 218 | 210 | 54.4 |
| D | 2 | 120 | 15637 | 283.53 | 218 | 210 | 54.4 |
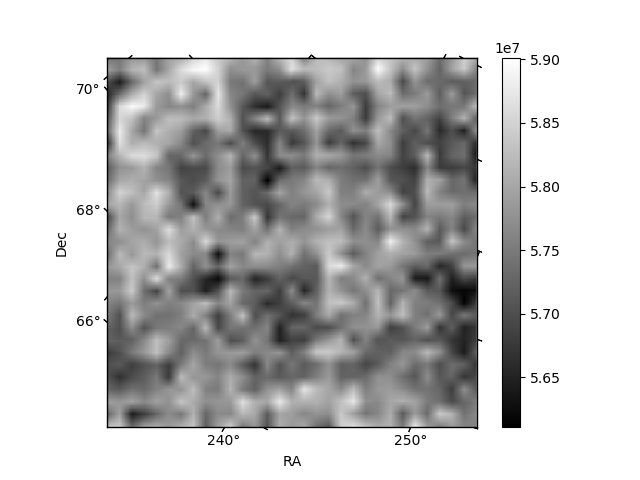
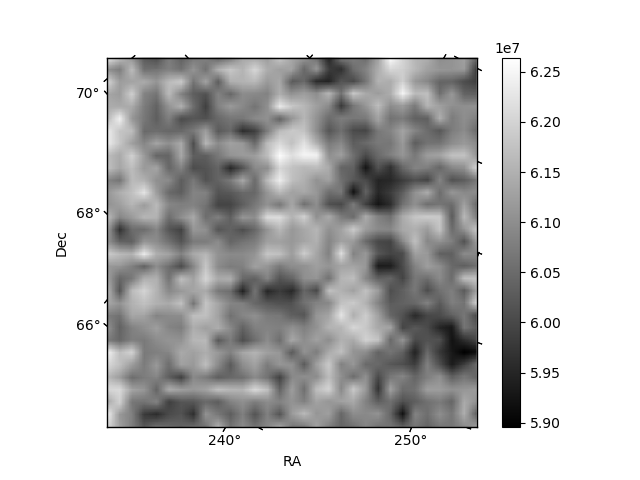
Histogram calculated using DETX and DETY for each event in the final _common_clean file
| Quadrant A |  |
 |
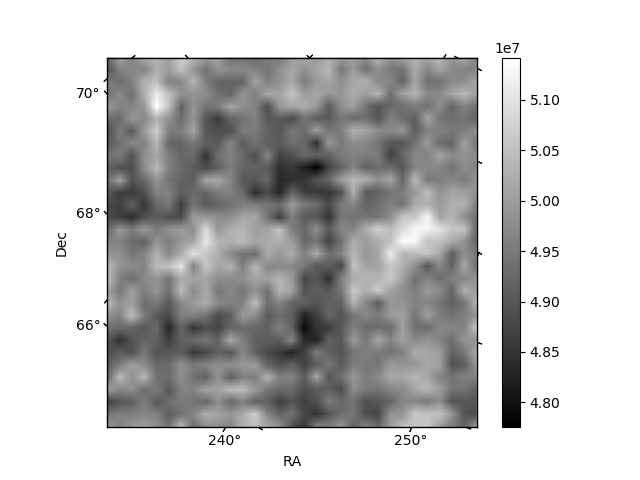
Quadrant B |
|---|---|---|---|
| Quadrant D |  |
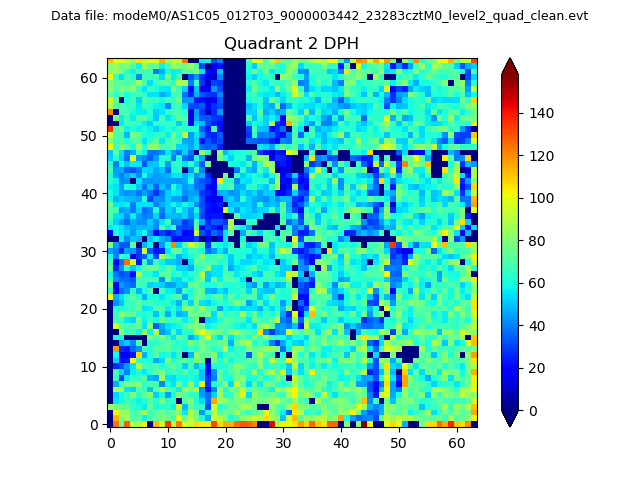 |
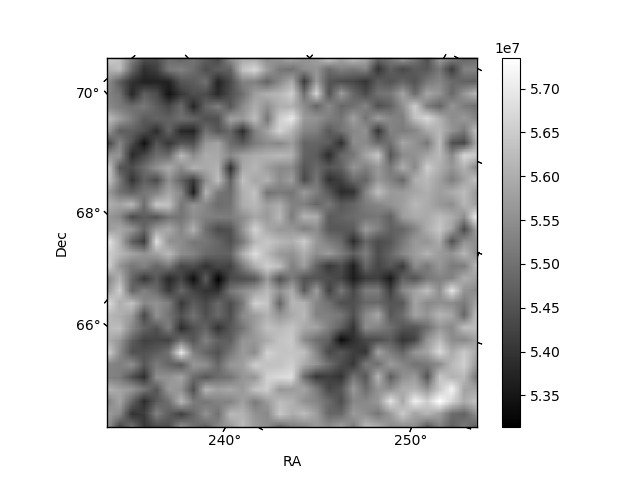
Quadrant C |
| Plot type | Count rate plots | Images |
|---|---|---|
| Comparison with Poisson distribution Blue bars denote a histogram of data divided into 1 sec bins. Red curve is a Poisson curve with rate = median count rate of data. |
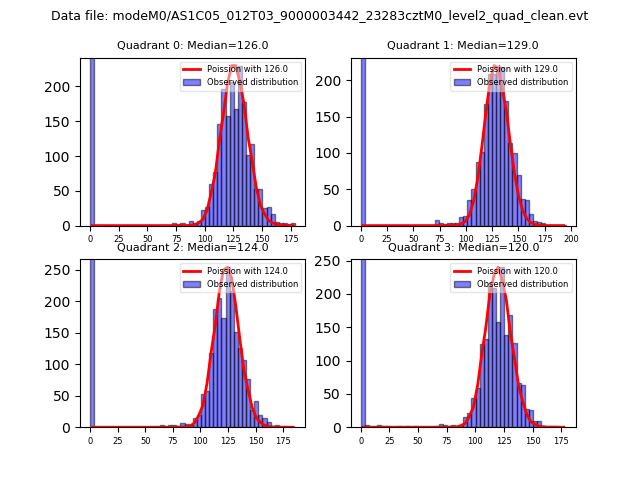 |
 |
| Quadrant-wise count rates Data is divided into 100 sec bins |
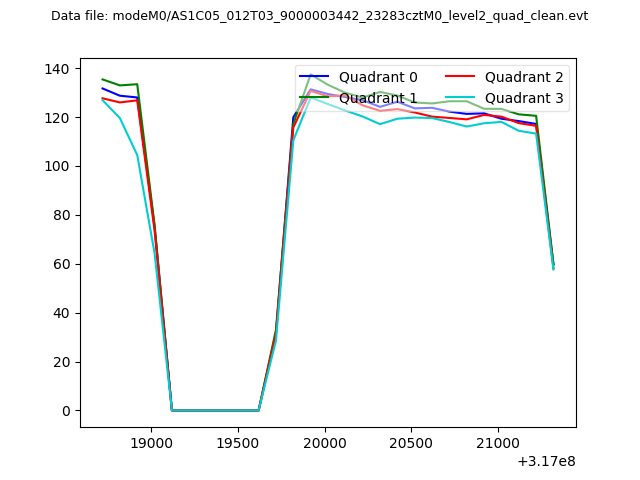 |
|
| Module-wise count rates for Quadrant A Data is divided into 100 sec bins |
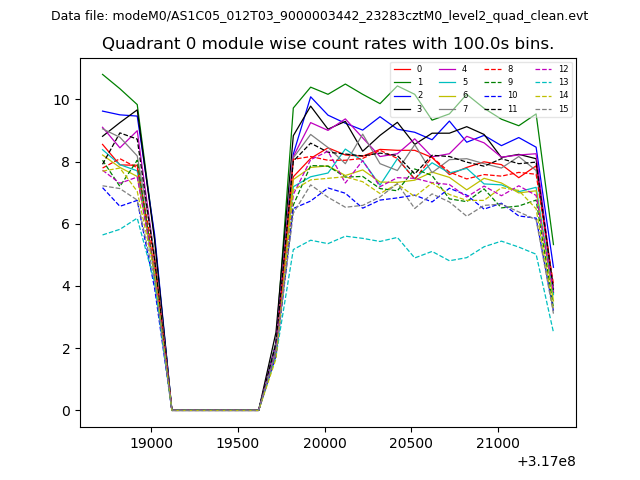 |
 |
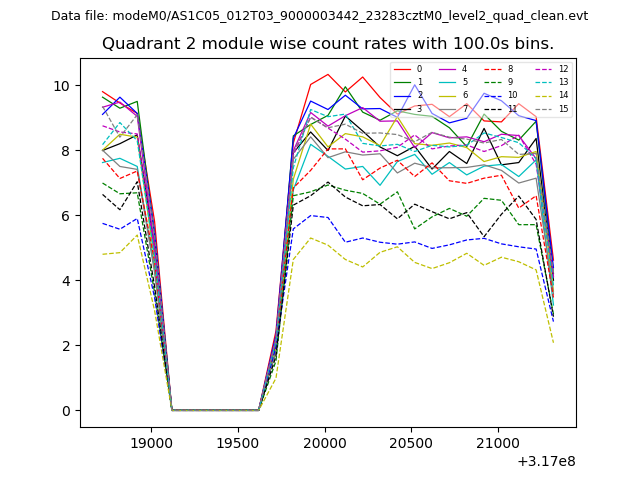
| Module-wise count rates for Quadrant B Data is divided into 100 sec bins |
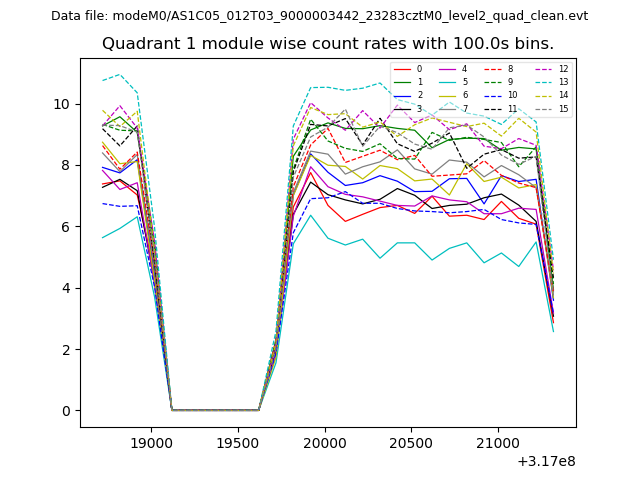 |
 |
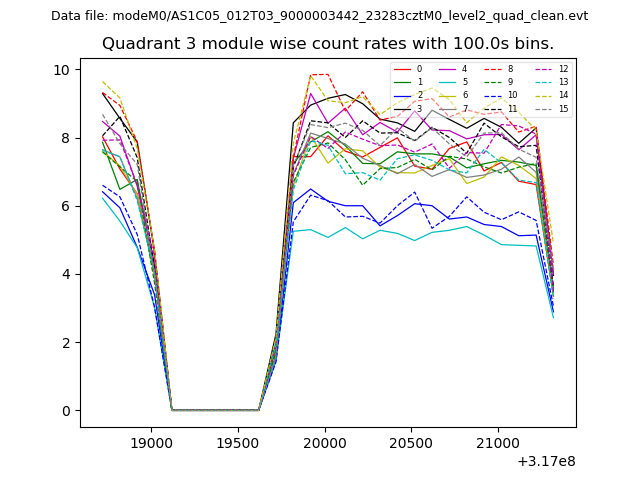
| Module-wise count rates for Quadrant C Data is divided into 100 sec bins |
 |
 |
| Module-wise count rates for Quadrant D Data is divided into 100 sec bins |
 |
 |
| Parameter | Plot |
|---|---|
| CZT HV Monitor | 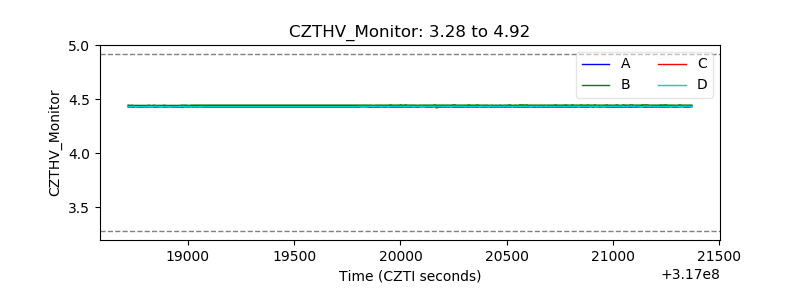 |
| D_VDD | 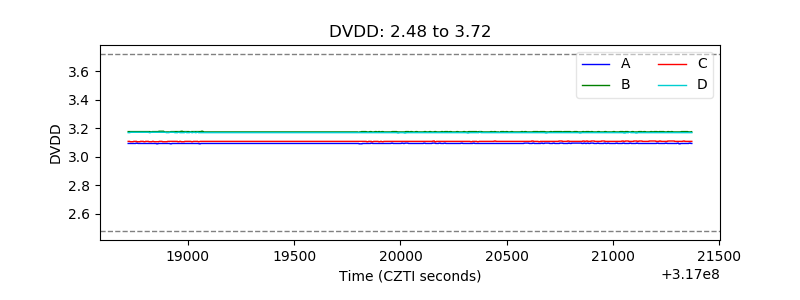 |
| Temperature 1 | 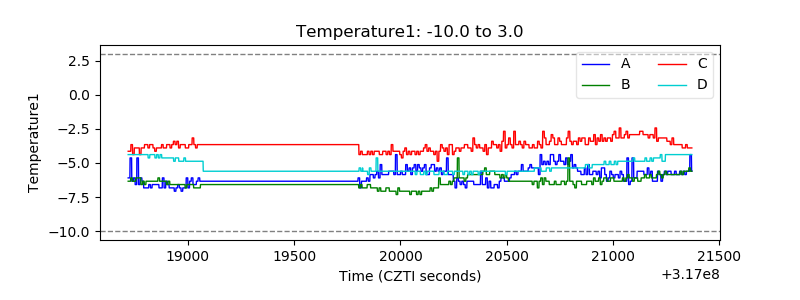 |
| Veto HV Monitor | 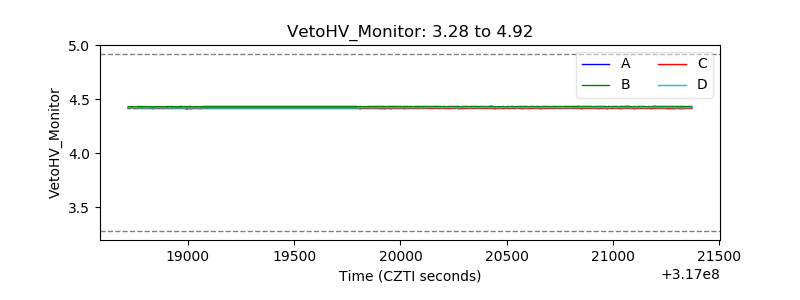 |
| Veto LLD | 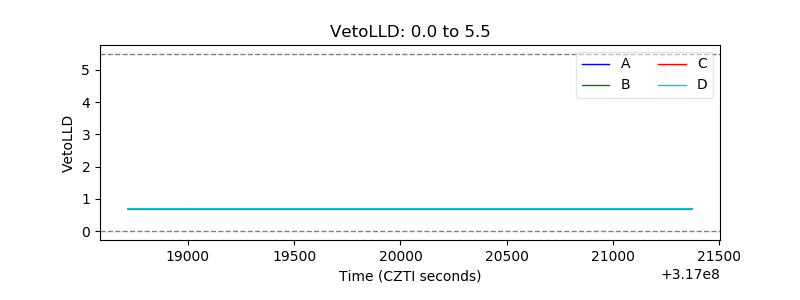 |
| Alpha Counter | 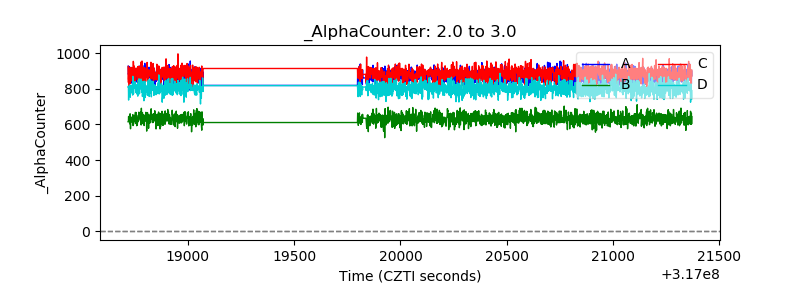 |
| _CPM_Rate | 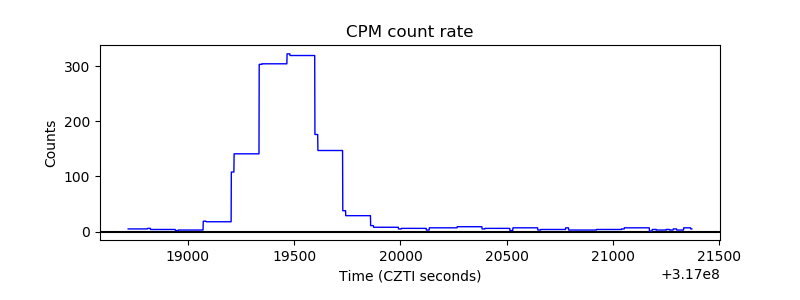 |
| CZT Counter | 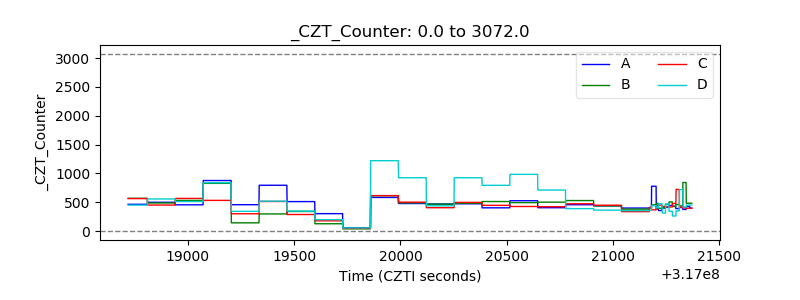 |
| +2.5 Volts monitor |  |
| +5 Volts monitor |  |
| _ROLL_ROT | 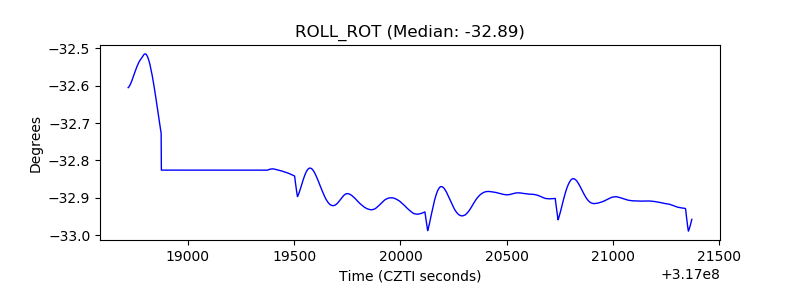 |
| _Roll_DEC | 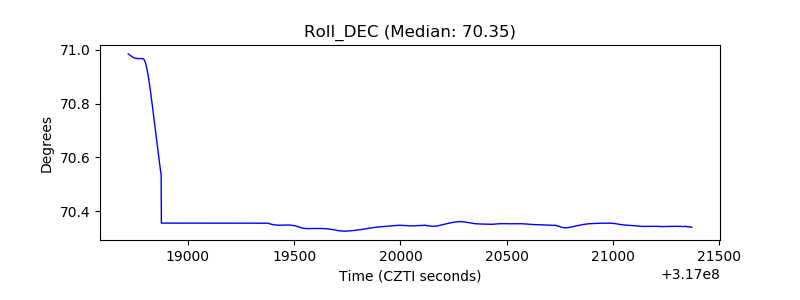 |
| _Roll_RA | 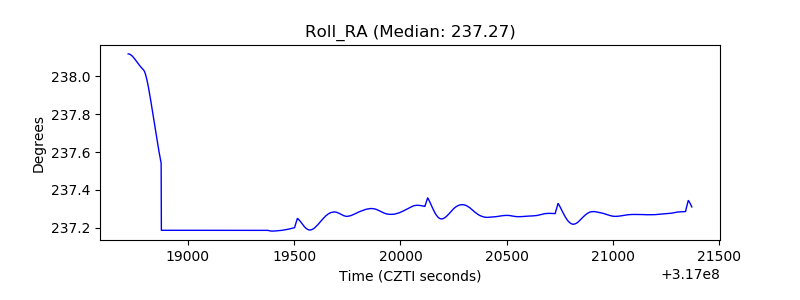 |
| Veto Counter | 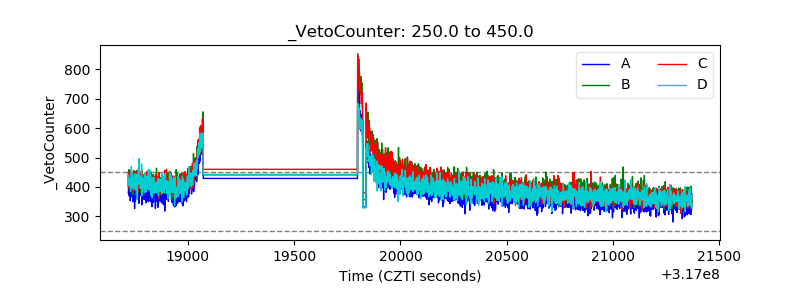 |