| Param | Original file | Final file |
|---|---|---|
| Filename | modeM0/AS1C05_012T03_9000003442_23284cztM0_level2.evt | modeM0/AS1C05_012T03_9000003442_23284cztM0_level2_quad_clean.evt |
| Size (bytes) | 491,175,360 | 136,728,000 |
| Size | 468.4 MB | 130.4 MB |
| Events in quadrant A | 3,398,205 | 922,897 |
| Events in quadrant B | 3,441,627 | 941,896 |
| Events in quadrant C | 3,446,937 | 895,480 |
| Events in quadrant D | 4,093,084 | 873,508 |
| Mode M9 | |||
|---|---|---|---|
| Quadrant | BADHDUFLAG | Total packets | Discarded packets |
| A | 0 | 17 | 0 |
| B | 0 | 17 | 0 |
| C | 0 | 17 | 0 |
| D | 0 | 17 | 0 |
| Mode SS | |||
|---|---|---|---|
| Quadrant | BADHDUFLAG | Total packets | Discarded packets |
| A | 0 | 148 | 0 |
| B | 0 | 148 | 0 |
| C | 0 | 148 | 0 |
| D | 0 | 148 | 0 |
| Mode M0 | |||
|---|---|---|---|
| Quadrant | BADHDUFLAG | Total packets | Discarded packets |
| A | 0 | 14951 | 2 |
| B | 0 | 15021 | 2 |
| C | 0 | 15031 | 2 |
| D | 0 | 17282 | 2 |
| Quadrant | Total seconds | Saturated seconds | Saturation percentage |
|---|---|---|---|
| A | 7299 | 52 | 0.712426% |
| B | 7299 | 76 | 1.041239% |
| C | 7299 | 73 | 1.000137% |
| D | 7298 | 132 | 1.808715% |
Noise dominated data is calculated using 1-second bins in cleaned event files. If a bin has >2000 counts, and if more than 50% of those come from <1% of pixels, then it is considered to be noise-dominated and hence unusable.
| Quadrant | # 1 sec bins | Bins with >0 counts | Bins with >2000 counts | High rate bins dominated by noise | Noise dominated (total time) | Noise dominated (detector-on time) | Marked lightcurve |
|---|---|---|---|---|---|---|---|
| A | 8929 | 7302 | 0 | 0 | 0.00% | 0.00% | 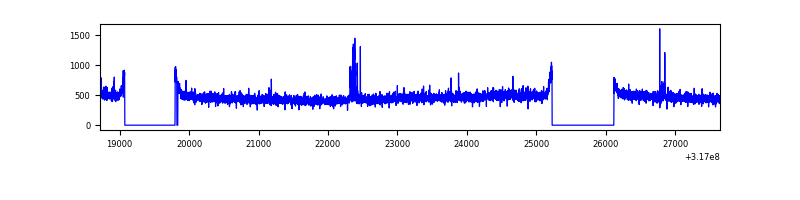 |
| B | 8929 | 7302 | 2 | 2 | 0.02% | 0.03% | 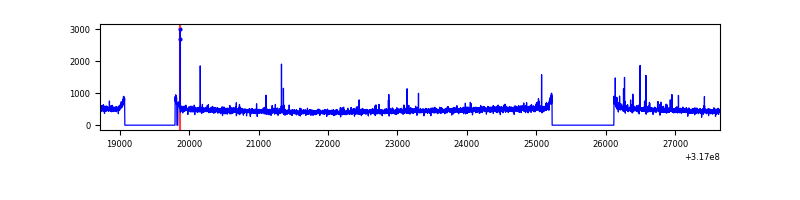 |
| C | 8929 | 7302 | 0 | 0 | 0.00% | 0.00% | 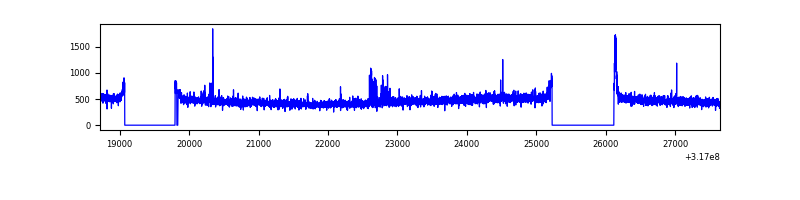 |
| D | 8928 | 7301 | 66 | 66 | 0.74% | 0.90% | 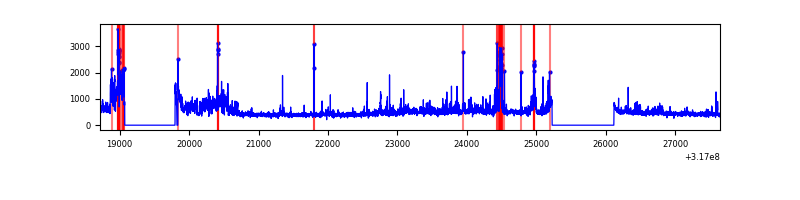 |
Top three noisy pixels from each quadrant. If the there are fewer than three noisy pixels in the level2.evt file, extra rows are filled as -1
| Pixel properties | Quadrant properties | ||||||
|---|---|---|---|---|---|---|---|
| Quadrant | DetID | PixID | Counts | Sigma | Mean | Median | Sigma |
| A | 6 | 16 | 52398 | 294.79 | 867 | 849 | 174.9 |
| A | 13 | 254 | 11252 | 59.49 | 867 | 849 | 174.9 |
| A | 3 | 137 | 7864 | 40.12 | 867 | 849 | 174.9 |
| B | 5 | 172 | 27612 | 162.05 | 863 | 841 | 165.2 |
| B | 12 | 111 | 20479 | 118.87 | 863 | 841 | 165.2 |
| B | 4 | 173 | 19531 | 113.14 | 863 | 841 | 165.2 |
| C | 14 | 238 | 132060 | 684.01 | 825 | 833 | 191.9 |
| C | 10 | 9 | 52700 | 270.35 | 825 | 833 | 191.9 |
| C | 0 | 10 | 26375 | 133.14 | 825 | 833 | 191.9 |
| D | 7 | 238 | 432207 | 2153.85 | 832 | 808 | 200.3 |
| D | 1 | 52 | 315266 | 1570.0 | 832 | 808 | 200.3 |
| D | 13 | 249 | 92386 | 457.22 | 832 | 808 | 200.3 |
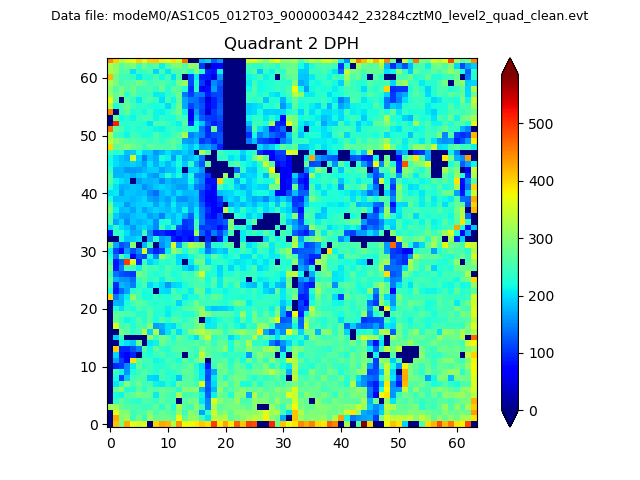
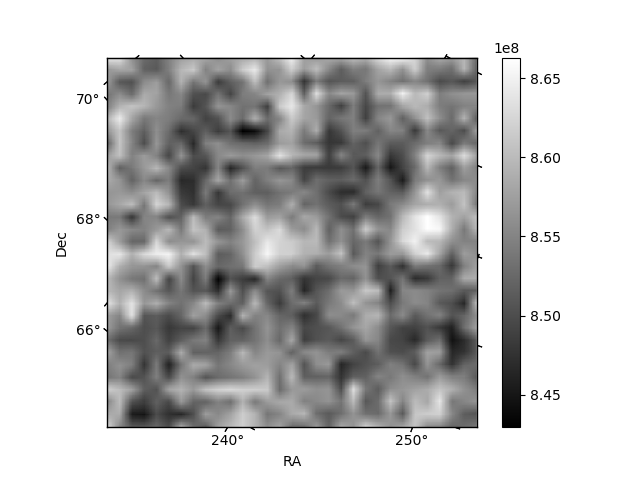
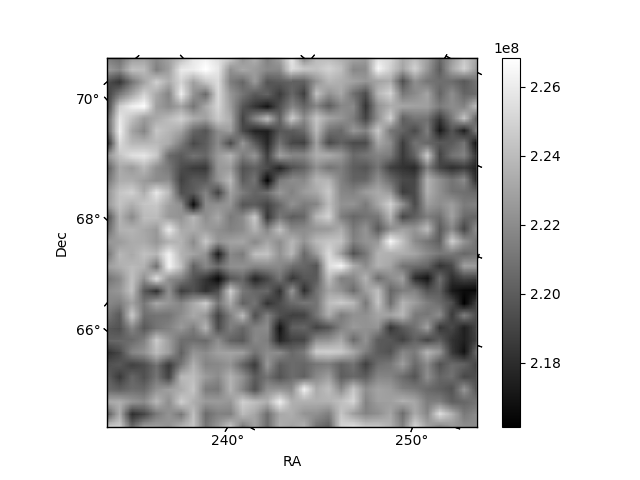
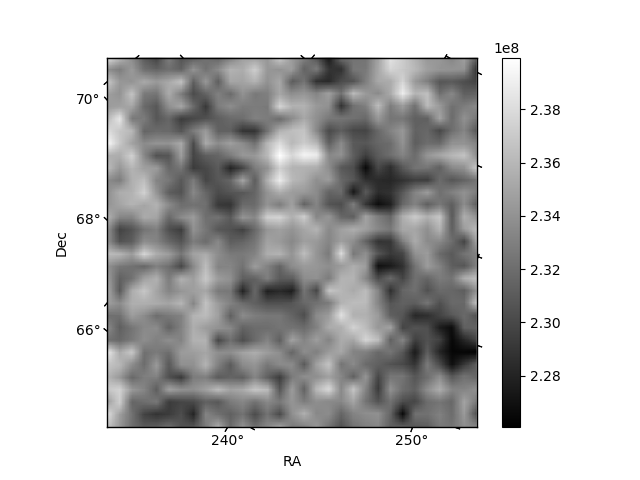
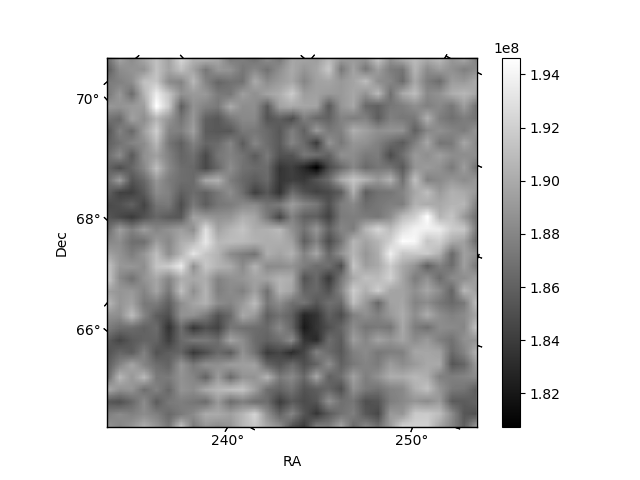
Histogram calculated using DETX and DETY for each event in the final _common_clean file
| Quadrant A | 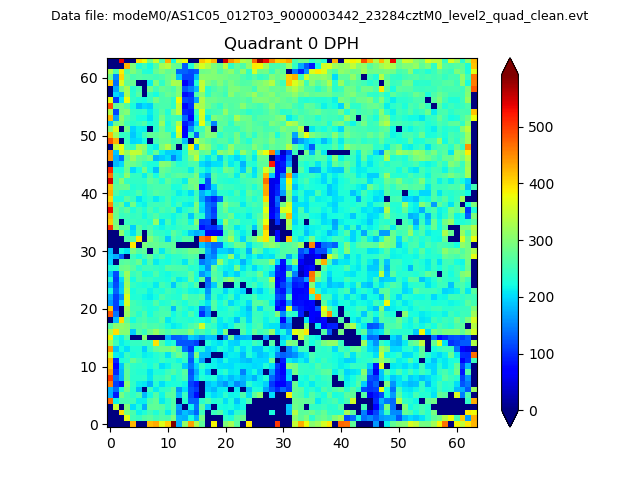 |
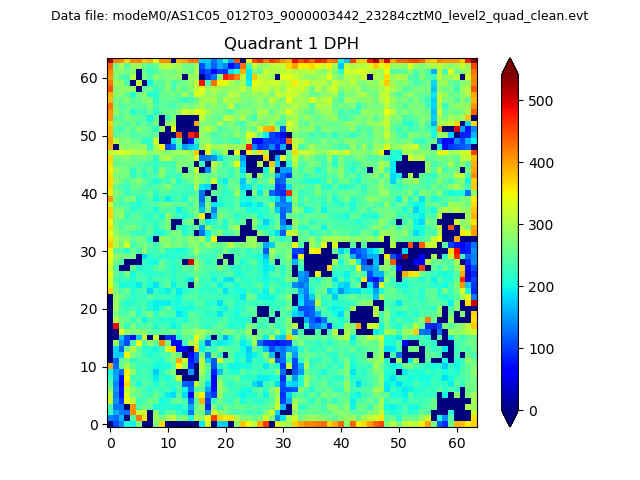 |
Quadrant B |
|---|---|---|---|
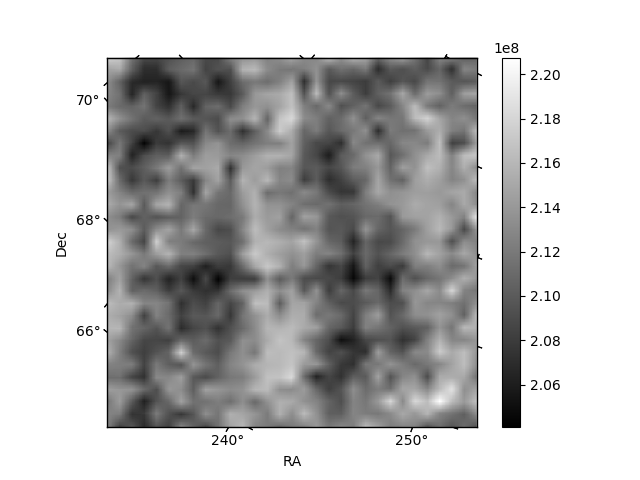
| Quadrant D | 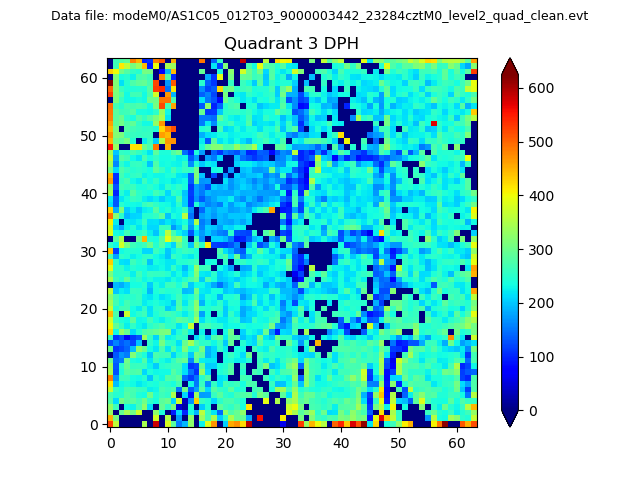 |
 |
Quadrant C |
| Plot type | Count rate plots | Images |
|---|---|---|
| Comparison with Poisson distribution Blue bars denote a histogram of data divided into 1 sec bins. Red curve is a Poisson curve with rate = median count rate of data. |
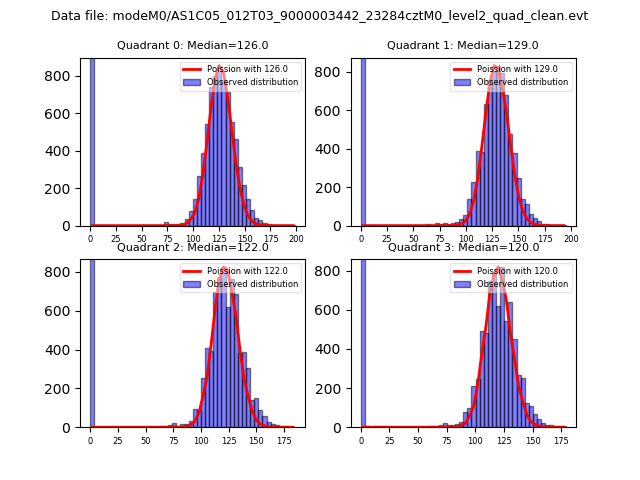 |
 |
| Quadrant-wise count rates Data is divided into 100 sec bins |
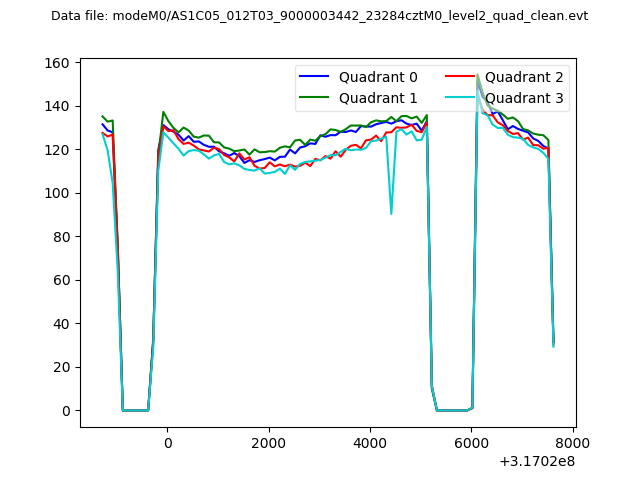 |
|
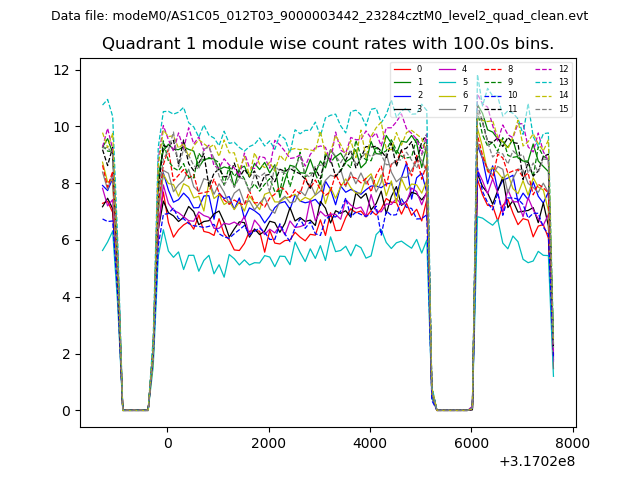
| Module-wise count rates for Quadrant A Data is divided into 100 sec bins |
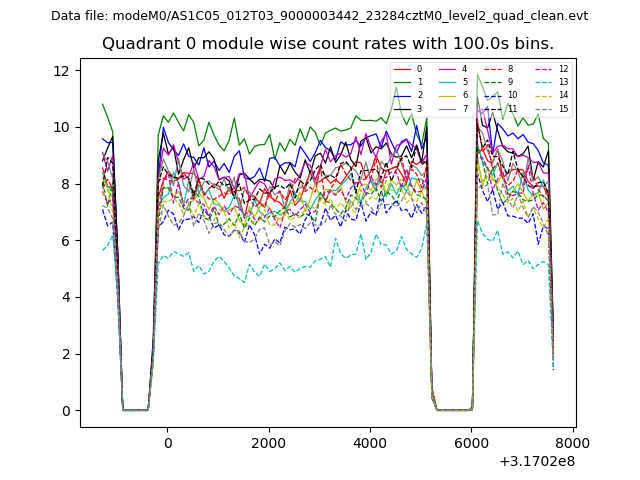 |
 |
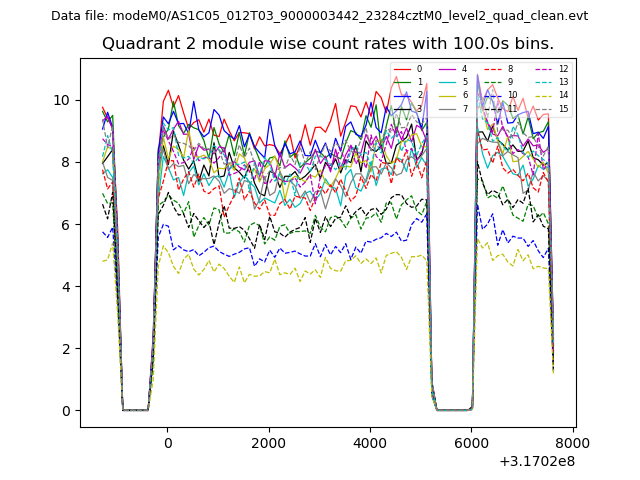
| Module-wise count rates for Quadrant B Data is divided into 100 sec bins |
 |
 |
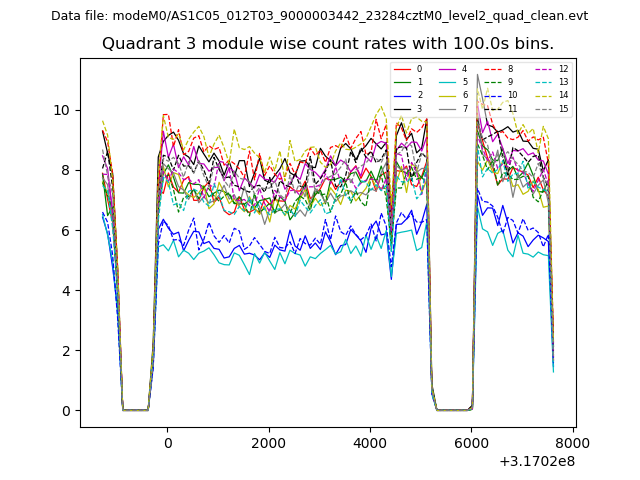
| Module-wise count rates for Quadrant C Data is divided into 100 sec bins |
 |
 |
| Module-wise count rates for Quadrant D Data is divided into 100 sec bins |
 |
 |
| Parameter | Plot |
|---|---|
| CZT HV Monitor | 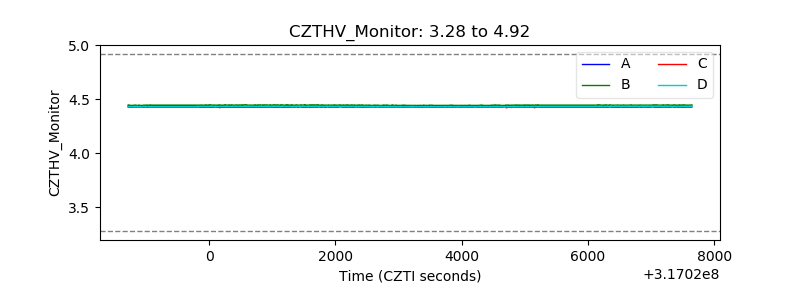 |
| D_VDD | 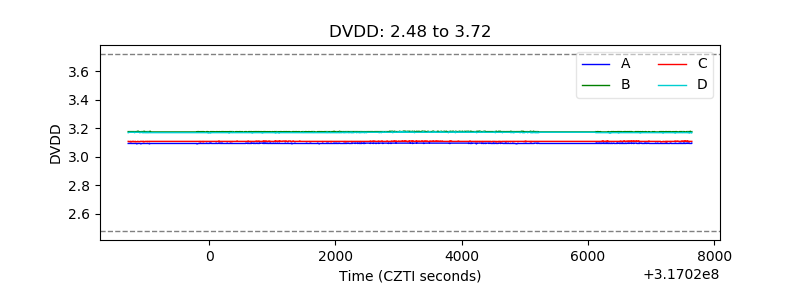 |
| Temperature 1 | 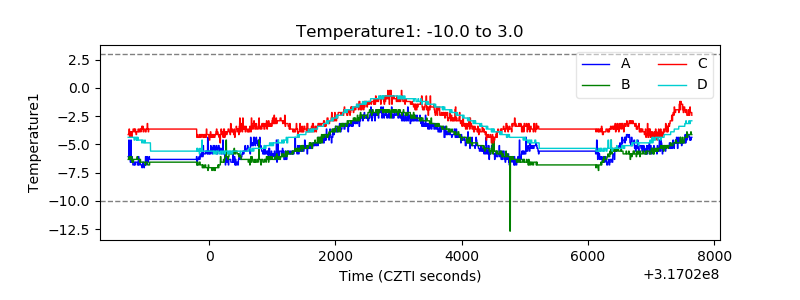 |
| Veto HV Monitor |  |
| Veto LLD | 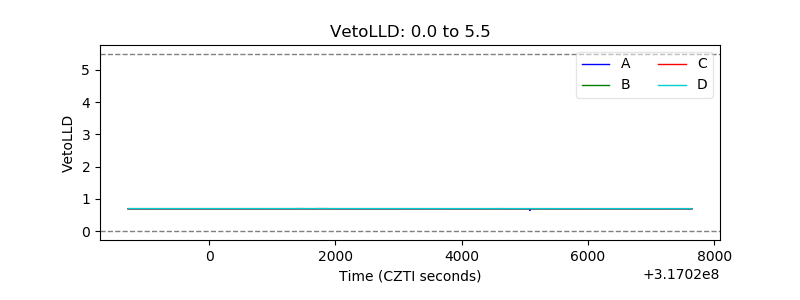 |
| Alpha Counter | 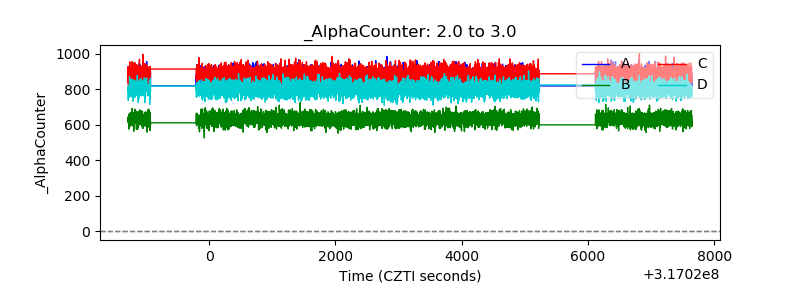 |
| _CPM_Rate |  |
| CZT Counter | 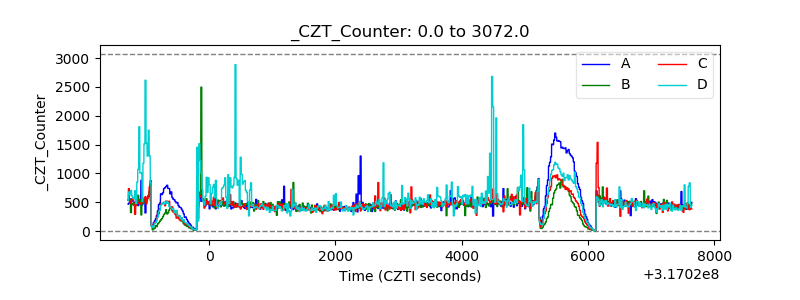 |
| +2.5 Volts monitor |  |
| +5 Volts monitor |  |
| _ROLL_ROT | 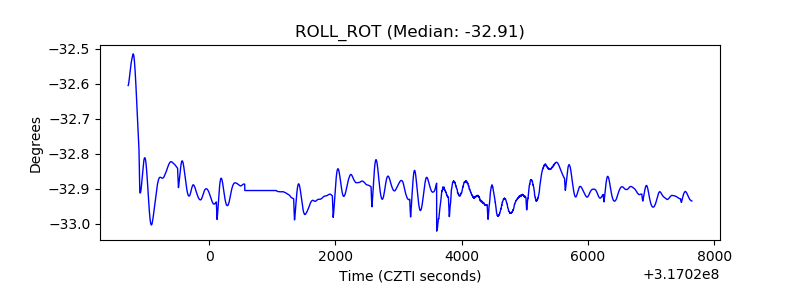 |
| _Roll_DEC | 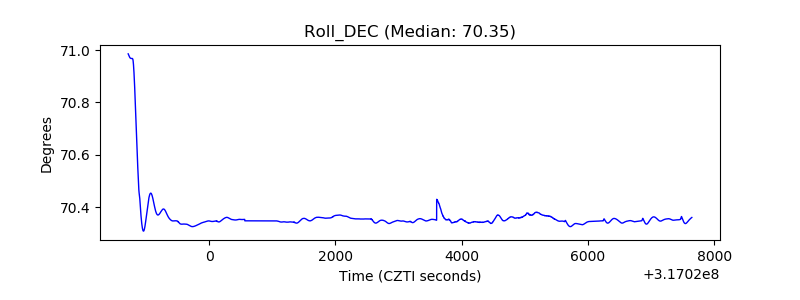 |
| _Roll_RA | 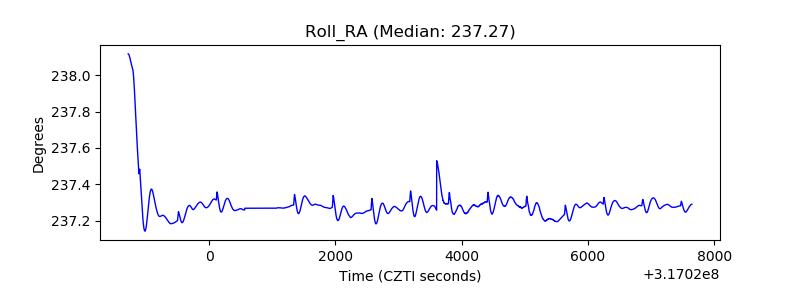 |
| Veto Counter | 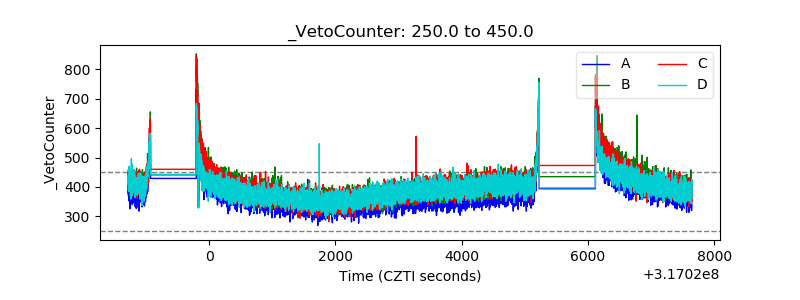 |