| Param | Original file | Final file |
|---|---|---|
| Filename | modeM0/AS1C05_012T03_9000003442_23285cztM0_level2.evt | modeM0/AS1C05_012T03_9000003442_23285cztM0_level2_quad_clean.evt |
| Size (bytes) | 443,062,080 | 117,889,920 |
| Size | 422.5 MB | 112.4 MB |
| Events in quadrant A | 2,853,440 | 804,541 |
| Events in quadrant B | 2,934,575 | 814,901 |
| Events in quadrant C | 3,010,453 | 771,206 |
| Events in quadrant D | 4,202,949 | 751,799 |
| Mode M9 | |||
|---|---|---|---|
| Quadrant | BADHDUFLAG | Total packets | Discarded packets |
| A | 0 | 10 | 0 |
| B | 0 | 10 | 0 |
| C | 0 | 10 | 0 |
| D | 0 | 10 | 0 |
| Mode SS | |||
|---|---|---|---|
| Quadrant | BADHDUFLAG | Total packets | Discarded packets |
| A | 0 | 124 | 0 |
| B | 0 | 124 | 0 |
| C | 0 | 124 | 0 |
| D | 0 | 124 | 0 |
| Mode M0 | |||
|---|---|---|---|
| Quadrant | BADHDUFLAG | Total packets | Discarded packets |
| A | 0 | 12508 | 1 |
| B | 0 | 12718 | 1 |
| C | 0 | 12898 | 1 |
| D | 0 | 16730 | 1 |
| Quadrant | Total seconds | Saturated seconds | Saturation percentage |
|---|---|---|---|
| A | 6134 | 49 | 0.798826% |
| B | 6134 | 54 | 0.880339% |
| C | 6135 | 93 | 1.515892% |
| D | 6135 | 251 | 4.091280% |
Noise dominated data is calculated using 1-second bins in cleaned event files. If a bin has >2000 counts, and if more than 50% of those come from <1% of pixels, then it is considered to be noise-dominated and hence unusable.
| Quadrant | # 1 sec bins | Bins with >0 counts | Bins with >2000 counts | High rate bins dominated by noise | Noise dominated (total time) | Noise dominated (detector-on time) | Marked lightcurve |
|---|---|---|---|---|---|---|---|
| A | 7154 | 6134 | 0 | 0 | 0.00% | 0.00% | 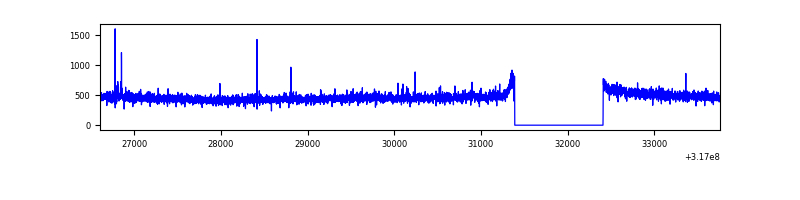 |
| B | 7154 | 6134 | 4 | 4 | 0.06% | 0.07% | 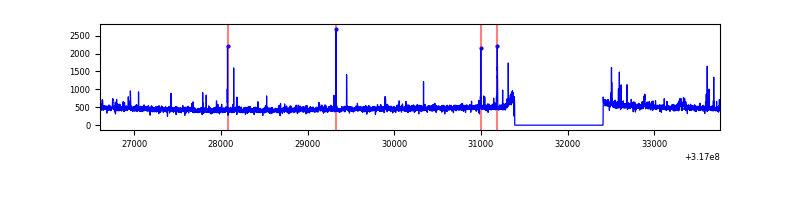 |
| C | 7155 | 6135 | 23 | 23 | 0.32% | 0.37% | 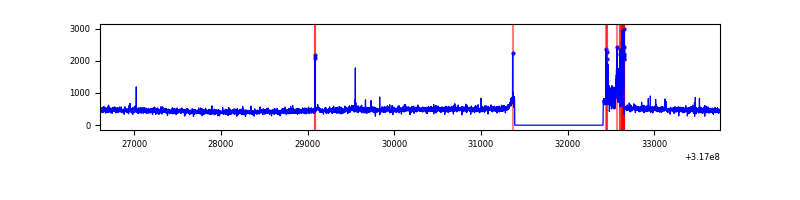 |
| D | 7155 | 6135 | 176 | 176 | 2.46% | 2.87% | 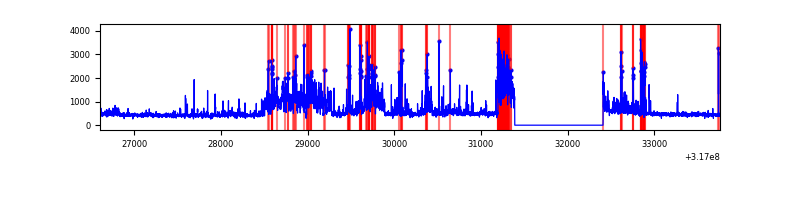 |
Top three noisy pixels from each quadrant. If the there are fewer than three noisy pixels in the level2.evt file, extra rows are filled as -1
| Pixel properties | Quadrant properties | ||||||
|---|---|---|---|---|---|---|---|
| Quadrant | DetID | PixID | Counts | Sigma | Mean | Median | Sigma |
| A | 13 | 254 | 10103 | 62.64 | 738 | 721 | 149.8 |
| A | 6 | 16 | 7329 | 44.12 | 738 | 721 | 149.8 |
| A | 0 | 226 | 6537 | 38.83 | 738 | 721 | 149.8 |
| B | 5 | 172 | 72398 | 518.28 | 727 | 709 | 138.3 |
| B | 12 | 111 | 16944 | 117.37 | 727 | 709 | 138.3 |
| B | 11 | 111 | 14848 | 102.22 | 727 | 709 | 138.3 |
| C | 10 | 9 | 143288 | 880.93 | 696 | 698 | 161.9 |
| C | 14 | 238 | 111815 | 686.49 | 696 | 698 | 161.9 |
| C | 0 | 207 | 15373 | 90.66 | 696 | 698 | 161.9 |
| D | 7 | 238 | 530384 | 3090.0 | 705 | 684 | 171.4 |
| D | 1 | 52 | 505248 | 2943.37 | 705 | 684 | 171.4 |
| D | 1 | 239 | 281320 | 1637.09 | 705 | 684 | 171.4 |
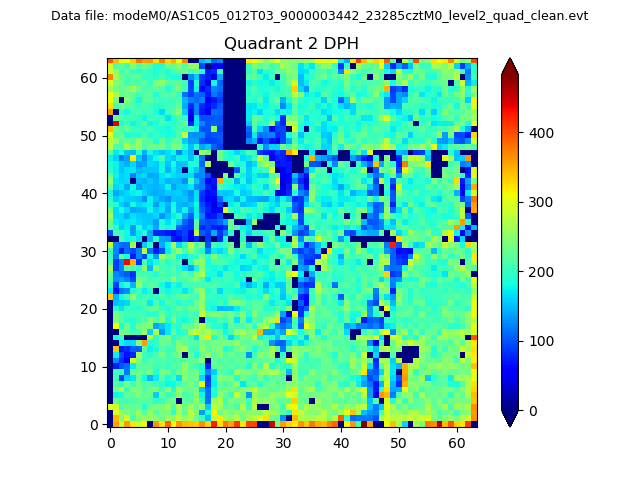
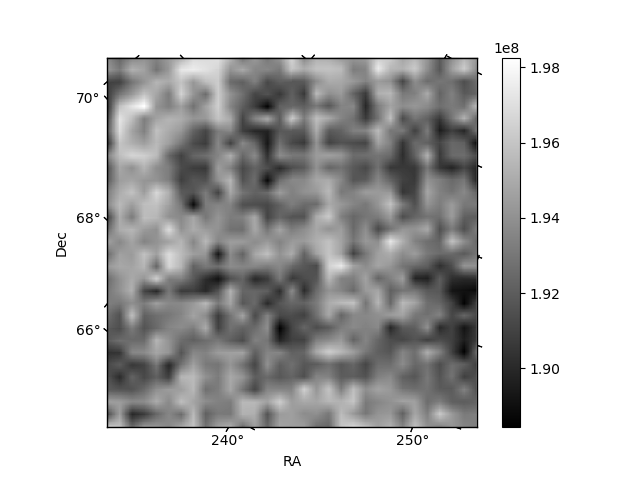
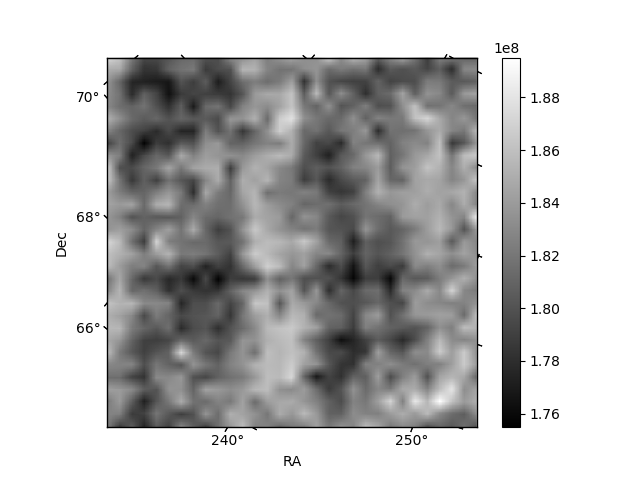
Histogram calculated using DETX and DETY for each event in the final _common_clean file
| Quadrant A |  |
 |
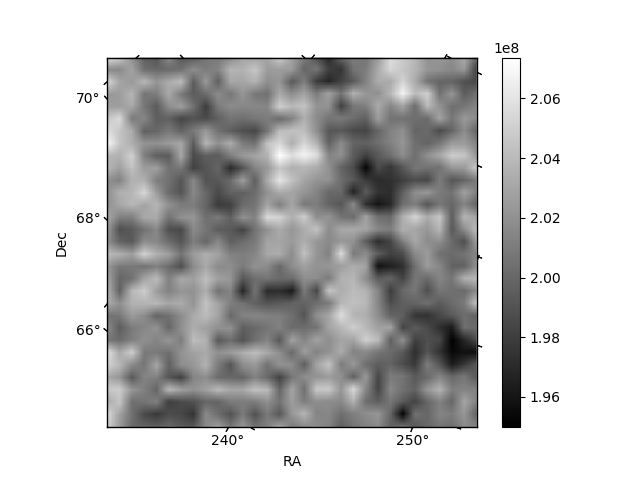
Quadrant B |
|---|---|---|---|
| Quadrant D | 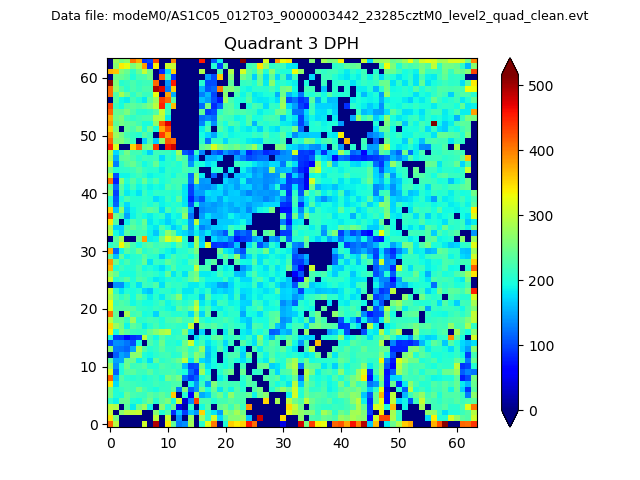 |
 |
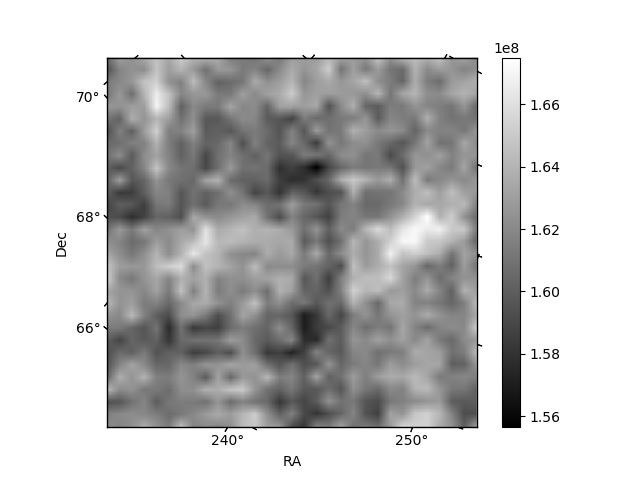
Quadrant C |
| Plot type | Count rate plots | Images |
|---|---|---|
| Comparison with Poisson distribution Blue bars denote a histogram of data divided into 1 sec bins. Red curve is a Poisson curve with rate = median count rate of data. |
 |
 |
| Quadrant-wise count rates Data is divided into 100 sec bins |
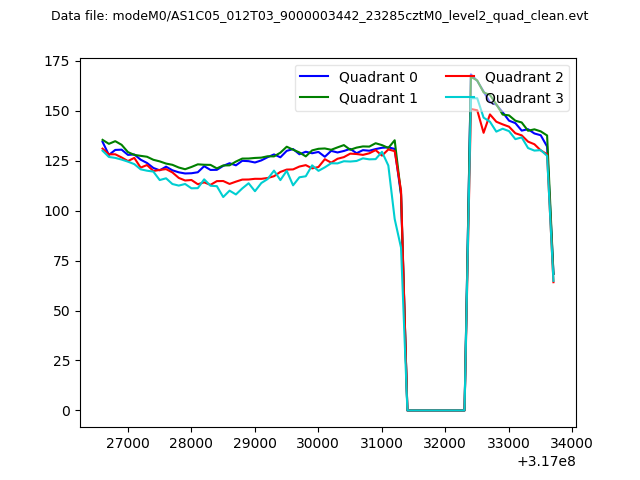 |
|
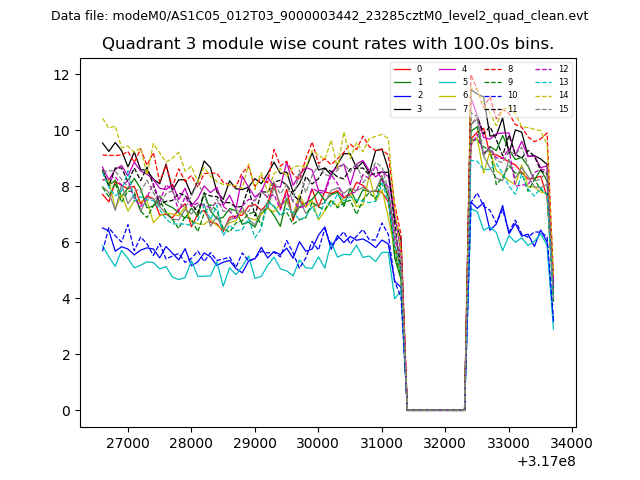
| Module-wise count rates for Quadrant A Data is divided into 100 sec bins |
 |
 |
| Module-wise count rates for Quadrant B Data is divided into 100 sec bins |
 |
 |
| Module-wise count rates for Quadrant C Data is divided into 100 sec bins |
 |
 |
| Module-wise count rates for Quadrant D Data is divided into 100 sec bins |
 |
 |
| Parameter | Plot |
|---|---|
| CZT HV Monitor |  |
| D_VDD | 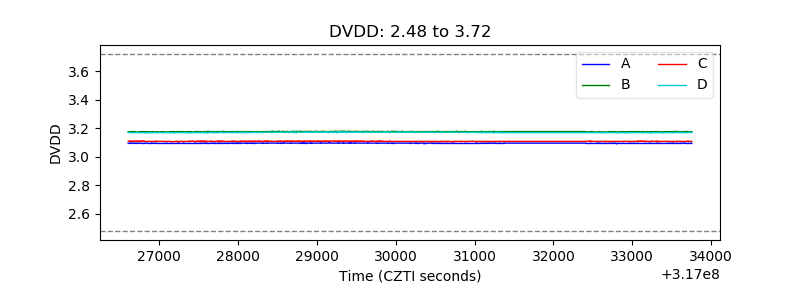 |
| Temperature 1 | 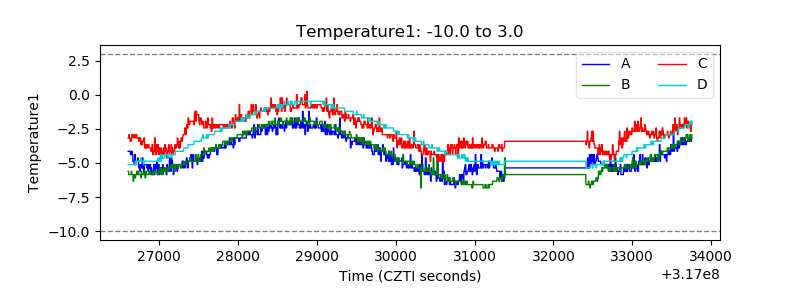 |
| Veto HV Monitor | 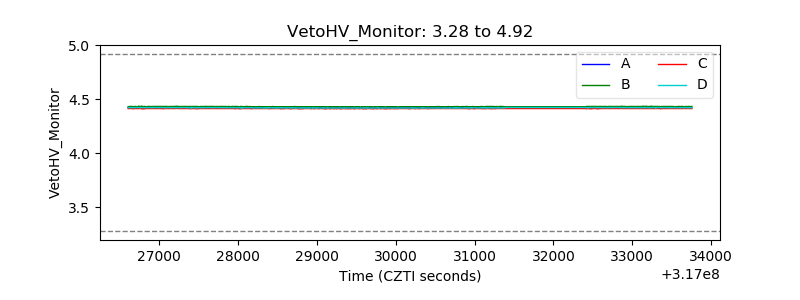 |
| Veto LLD | 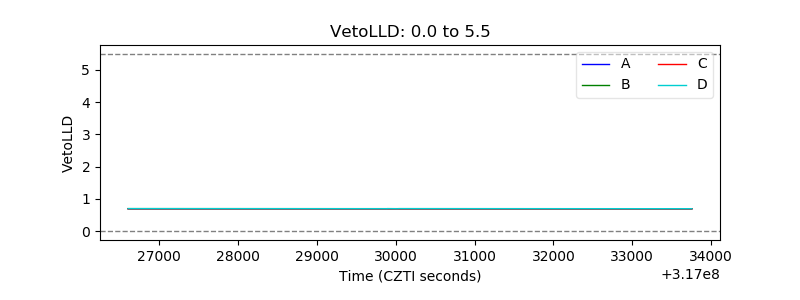 |
| Alpha Counter | 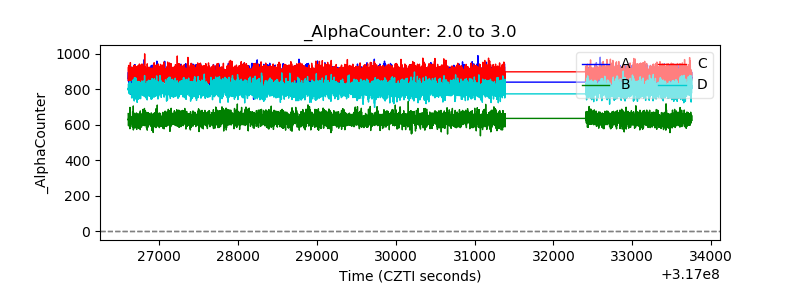 |
| _CPM_Rate | 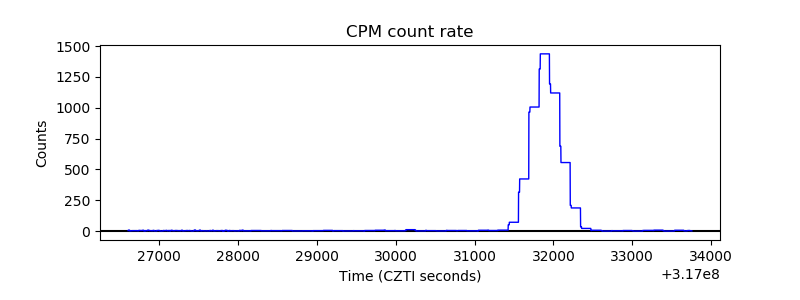 |
| CZT Counter | 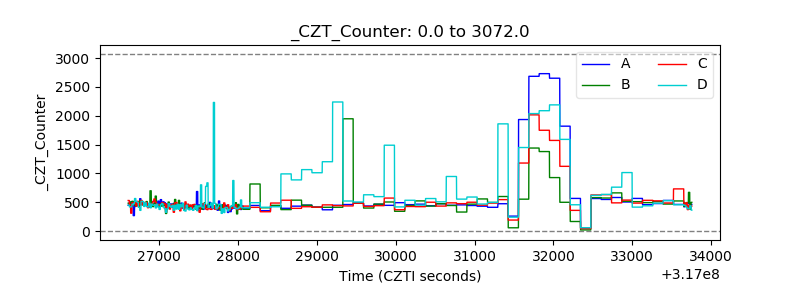 |
| +2.5 Volts monitor |  |
| +5 Volts monitor |  |
| _ROLL_ROT | 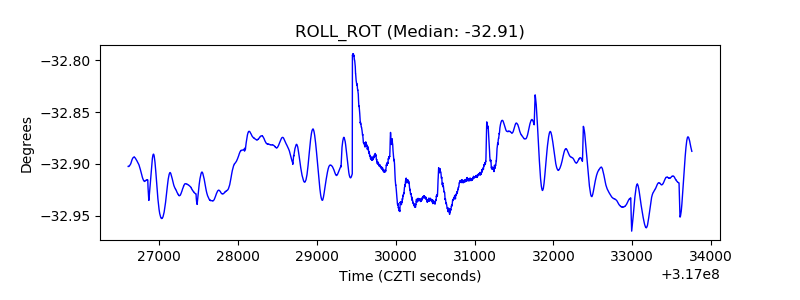 |
| _Roll_DEC | 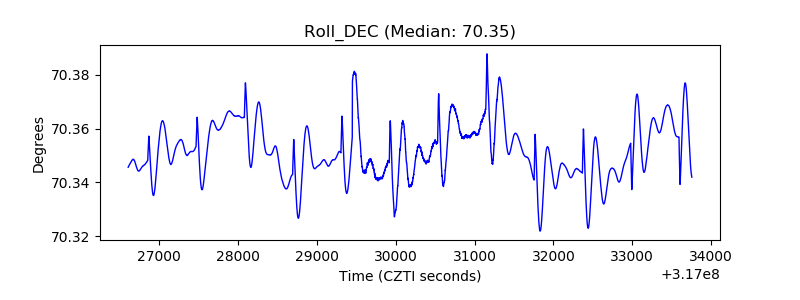 |
| _Roll_RA | 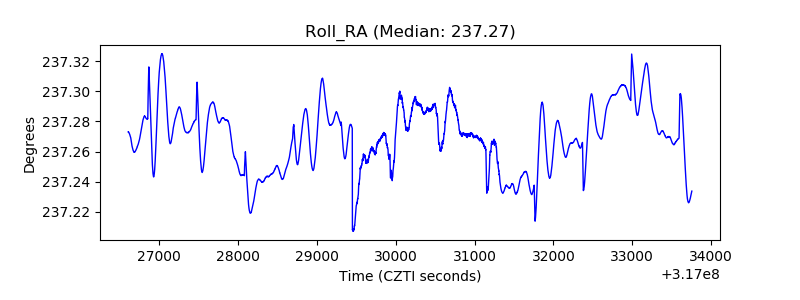 |
| Veto Counter | 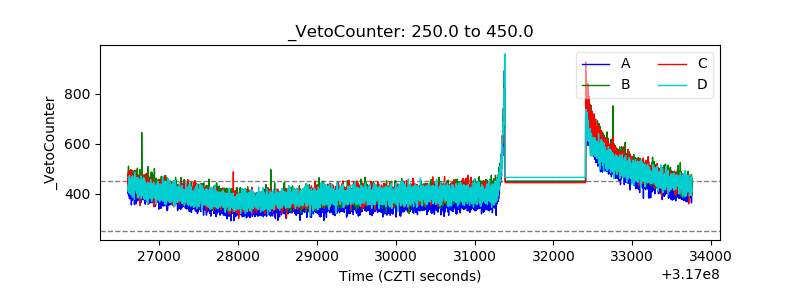 |