| Param | Original file | Final file |
|---|---|---|
| Filename | modeM0/AS1C05_012T03_9000003442_23287cztM0_level2.evt | modeM0/AS1C05_012T03_9000003442_23287cztM0_level2_quad_clean.evt |
| Size (bytes) | 475,680,960 | 129,064,320 |
| Size | 453.6 MB | 123.1 MB |
| Events in quadrant A | 3,064,062 | 893,476 |
| Events in quadrant B | 3,126,650 | 896,996 |
| Events in quadrant C | 3,229,276 | 847,177 |
| Events in quadrant D | 4,555,296 | 828,974 |
| Mode M9 | |||
|---|---|---|---|
| Quadrant | BADHDUFLAG | Total packets | Discarded packets |
| A | 0 | 11 | 0 |
| B | 0 | 11 | 0 |
| C | 0 | 11 | 0 |
| D | 0 | 11 | 0 |
| Mode SS | |||
|---|---|---|---|
| Quadrant | BADHDUFLAG | Total packets | Discarded packets |
| A | 0 | 130 | 0 |
| B | 0 | 130 | 0 |
| C | 0 | 130 | 0 |
| D | 0 | 130 | 0 |
| Mode M0 | |||
|---|---|---|---|
| Quadrant | BADHDUFLAG | Total packets | Discarded packets |
| A | 0 | 13128 | 1 |
| B | 0 | 13272 | 2 |
| C | 0 | 13547 | 1 |
| D | 0 | 17726 | 1 |
| Quadrant | Total seconds | Saturated seconds | Saturation percentage |
|---|---|---|---|
| A | 6336 | 46 | 0.726010% |
| B | 6336 | 49 | 0.773359% |
| C | 6336 | 82 | 1.294192% |
| D | 6336 | 302 | 4.766414% |
Noise dominated data is calculated using 1-second bins in cleaned event files. If a bin has >2000 counts, and if more than 50% of those come from <1% of pixels, then it is considered to be noise-dominated and hence unusable.
| Quadrant | # 1 sec bins | Bins with >0 counts | Bins with >2000 counts | High rate bins dominated by noise | Noise dominated (total time) | Noise dominated (detector-on time) | Marked lightcurve |
|---|---|---|---|---|---|---|---|
| A | 7481 | 6336 | 0 | 0 | 0.00% | 0.00% | 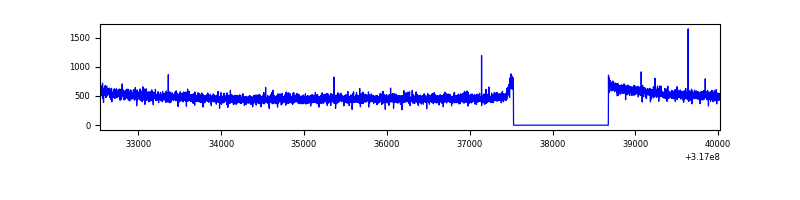 |
| B | 7481 | 6336 | 6 | 6 | 0.08% | 0.09% | 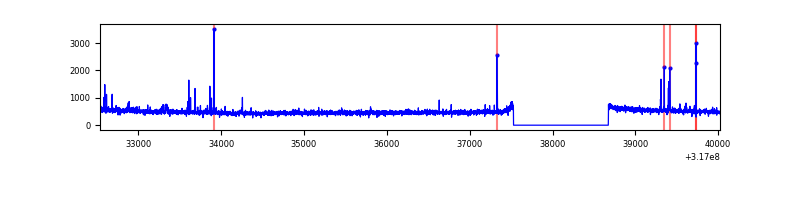 |
| C | 7481 | 6337 | 21 | 21 | 0.28% | 0.33% | 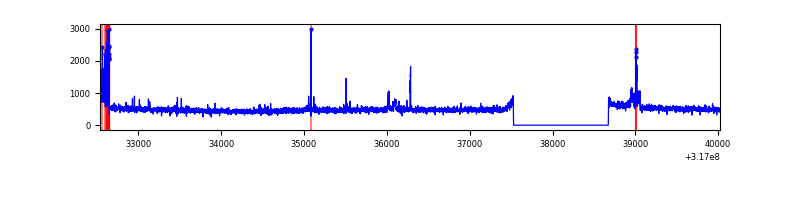 |
| D | 7481 | 6336 | 287 | 287 | 3.84% | 4.53% | 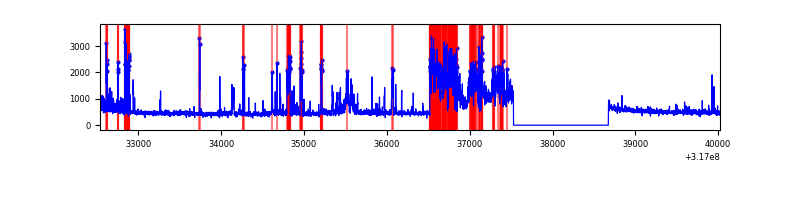 |
Top three noisy pixels from each quadrant. If the there are fewer than three noisy pixels in the level2.evt file, extra rows are filled as -1
| Pixel properties | Quadrant properties | ||||||
|---|---|---|---|---|---|---|---|
| Quadrant | DetID | PixID | Counts | Sigma | Mean | Median | Sigma |
| A | 13 | 254 | 10254 | 59.87 | 794 | 780 | 158.2 |
| A | 0 | 226 | 6877 | 38.53 | 794 | 780 | 158.2 |
| A | 3 | 137 | 6514 | 36.23 | 794 | 780 | 158.2 |
| B | 5 | 172 | 72401 | 497.58 | 777 | 760 | 144.0 |
| B | 12 | 111 | 17166 | 113.95 | 777 | 760 | 144.0 |
| B | 11 | 111 | 15573 | 102.88 | 777 | 760 | 144.0 |
| C | 10 | 9 | 159461 | 915.07 | 747 | 750 | 173.4 |
| C | 14 | 238 | 120792 | 692.12 | 747 | 750 | 173.4 |
| C | 0 | 207 | 15579 | 85.5 | 747 | 750 | 173.4 |
| D | 7 | 238 | 1321586 | 7245.49 | 760 | 739 | 182.3 |
| D | 1 | 52 | 192454 | 1051.65 | 760 | 739 | 182.3 |
| D | 12 | 233 | 49183 | 265.74 | 760 | 739 | 182.3 |
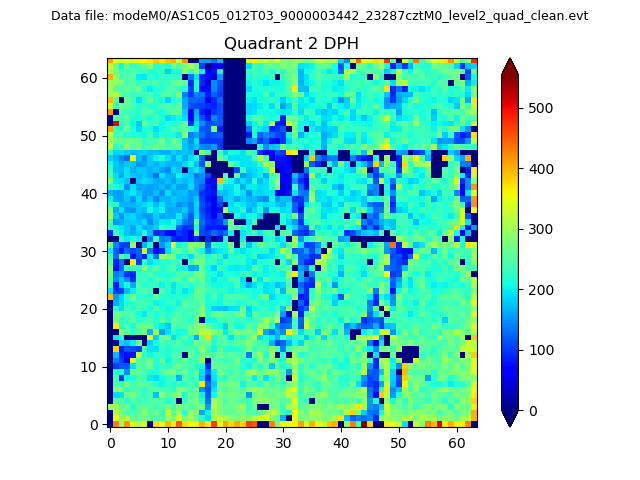
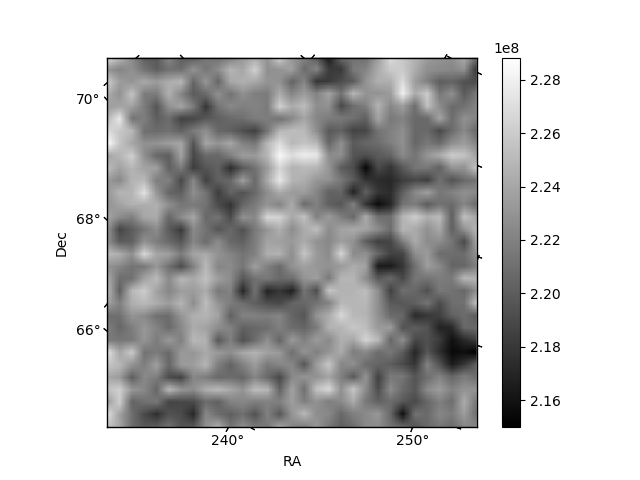
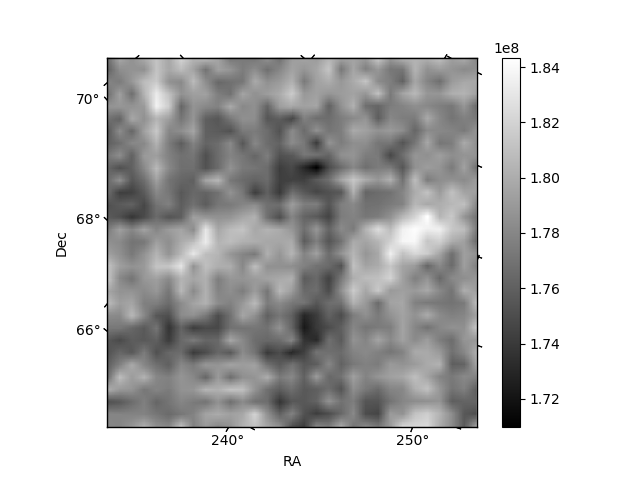
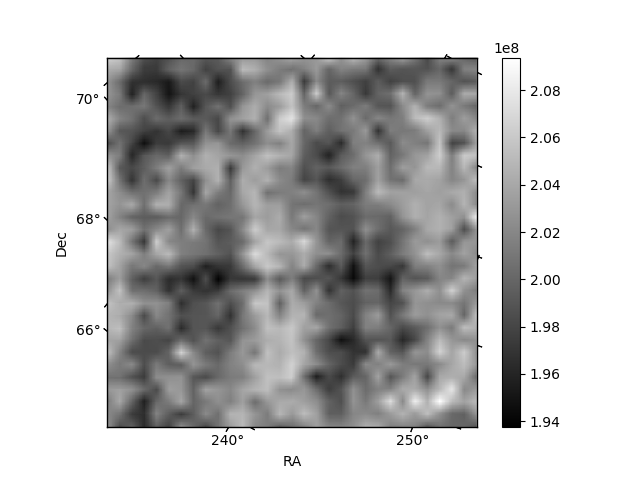
Histogram calculated using DETX and DETY for each event in the final _common_clean file
| Quadrant A | 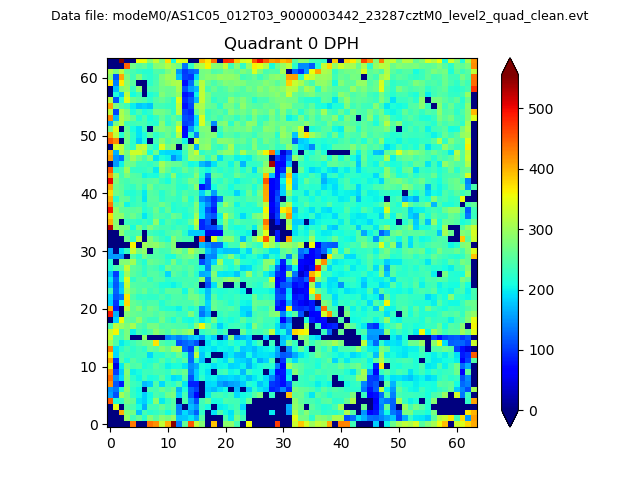 |
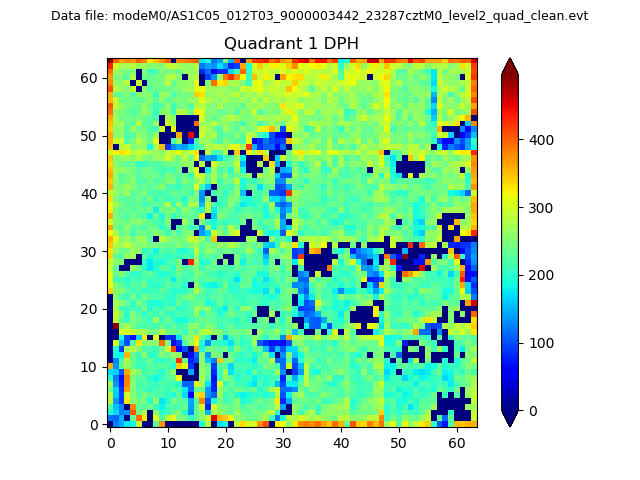 |
Quadrant B |
|---|---|---|---|
| Quadrant D | 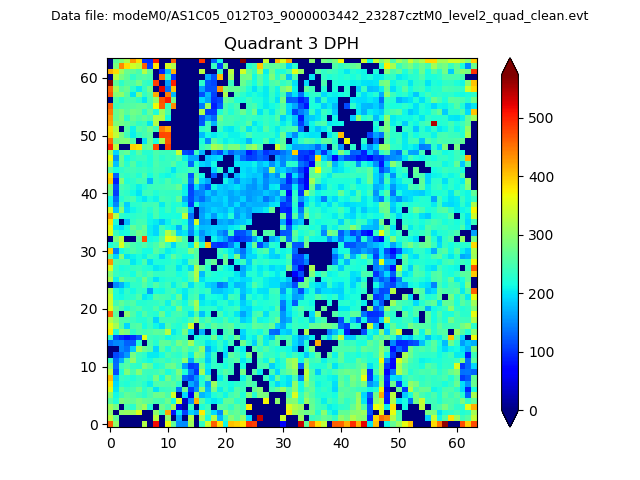 |
 |
Quadrant C |
| Plot type | Count rate plots | Images |
|---|---|---|
| Comparison with Poisson distribution Blue bars denote a histogram of data divided into 1 sec bins. Red curve is a Poisson curve with rate = median count rate of data. |
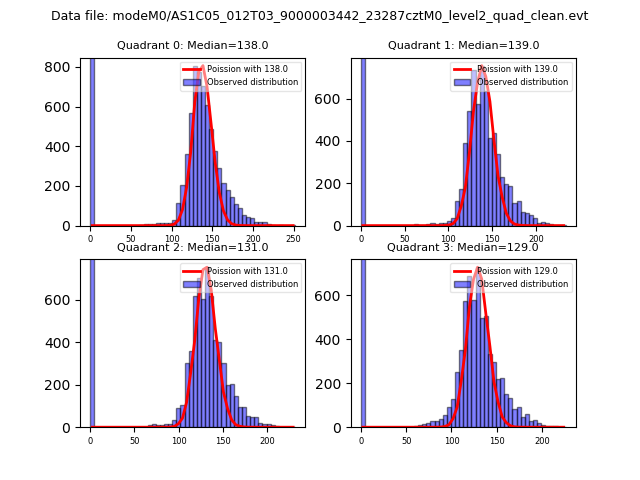 |
 |
| Quadrant-wise count rates Data is divided into 100 sec bins |
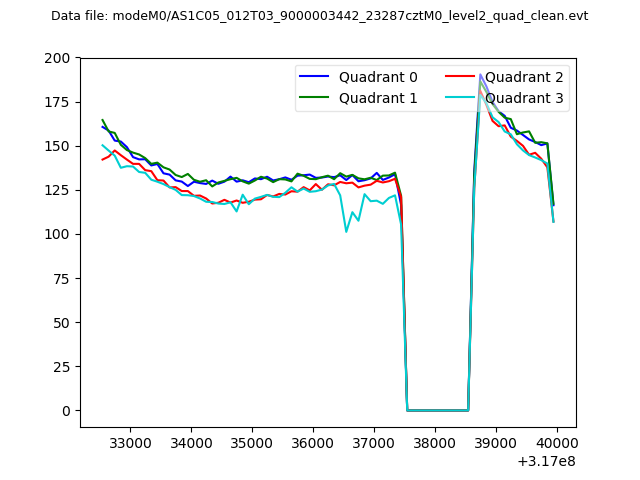 |
|
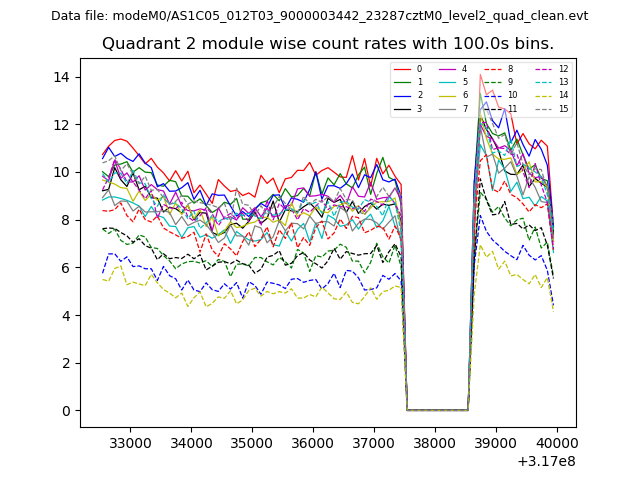
| Module-wise count rates for Quadrant A Data is divided into 100 sec bins |
 |
 |
| Module-wise count rates for Quadrant B Data is divided into 100 sec bins |
 |
 |
| Module-wise count rates for Quadrant C Data is divided into 100 sec bins |
 |
 |
| Module-wise count rates for Quadrant D Data is divided into 100 sec bins |
 |
 |
| Parameter | Plot |
|---|---|
| CZT HV Monitor | 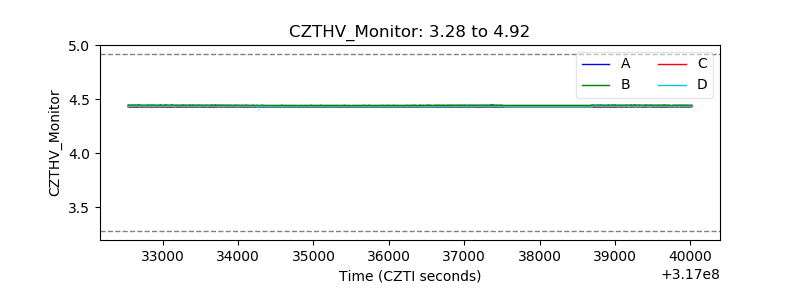 |
| D_VDD |  |
| Temperature 1 | 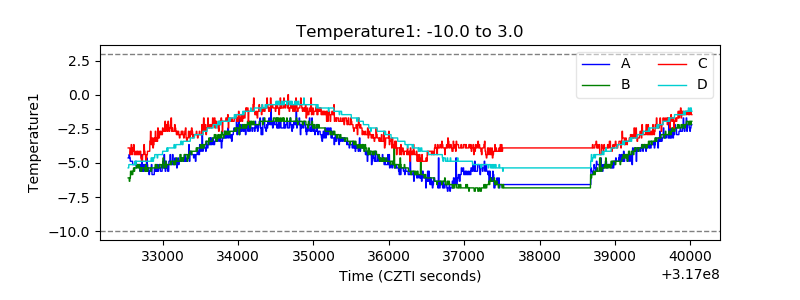 |
| Veto HV Monitor | 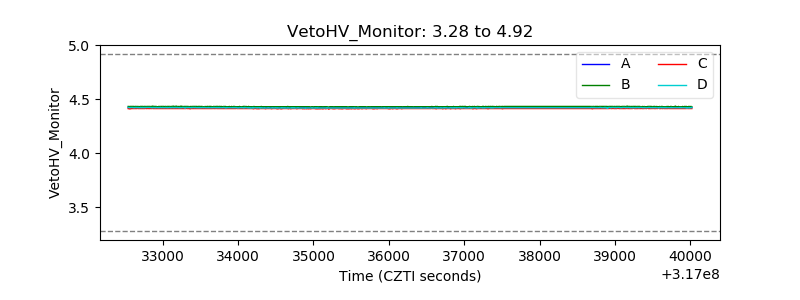 |
| Veto LLD |  |
| Alpha Counter | 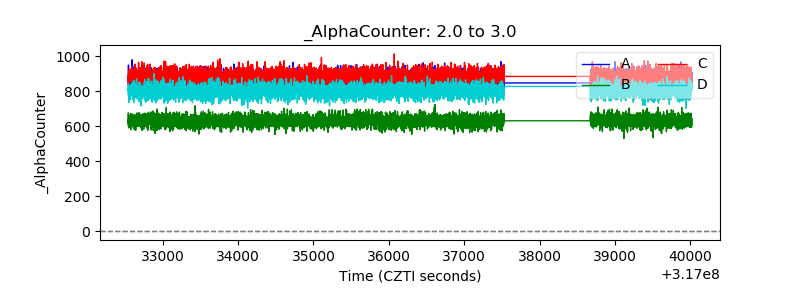 |
| _CPM_Rate | 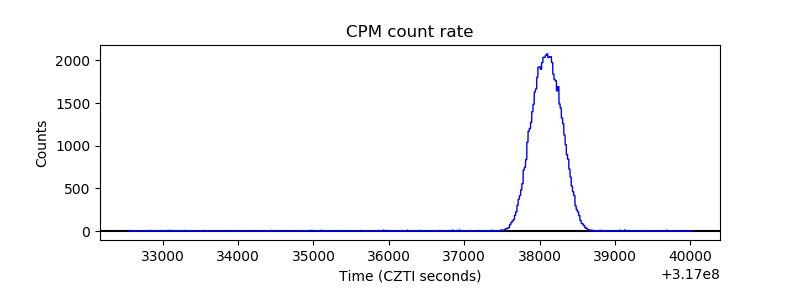 |
| CZT Counter | 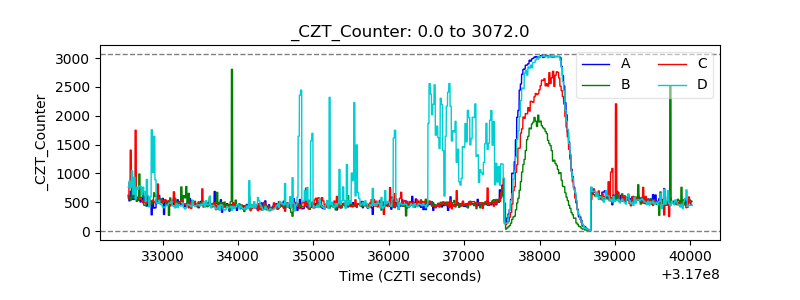 |
| +2.5 Volts monitor |  |
| +5 Volts monitor |  |
| _ROLL_ROT | 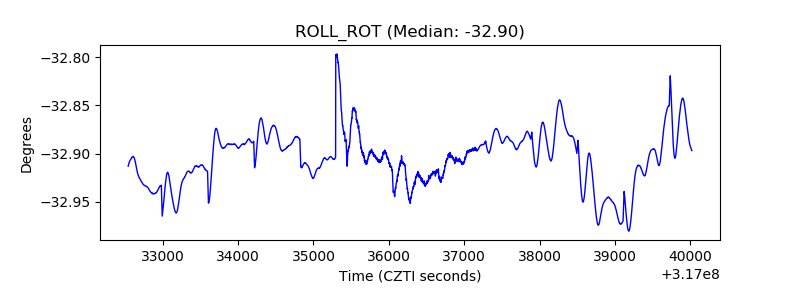 |
| _Roll_DEC | 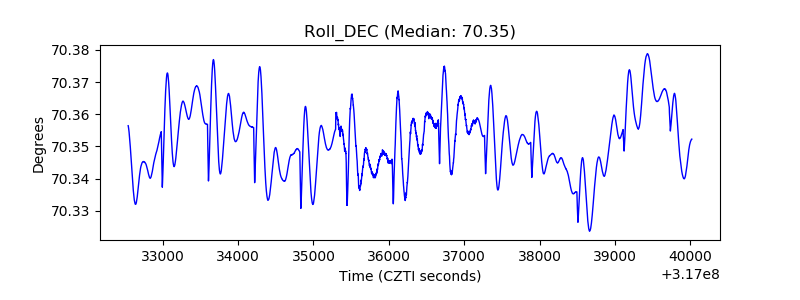 |
| _Roll_RA | 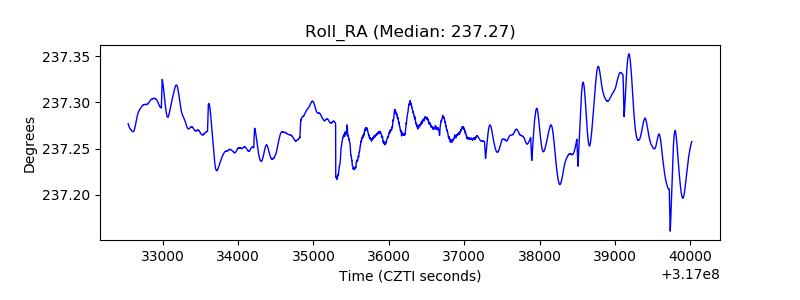 |
| Veto Counter | 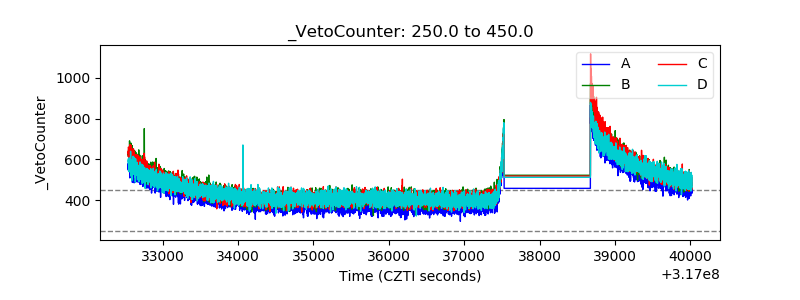 |