| Param | Original file | Final file |
|---|---|---|
| Filename | modeM0/AS1C05_012T03_9000003442_23288cztM0_level2.evt | modeM0/AS1C05_012T03_9000003442_23288cztM0_level2_quad_clean.evt |
| Size (bytes) | 463,893,120 | 135,740,160 |
| Size | 442.4 MB | 129.5 MB |
| Events in quadrant A | 3,164,033 | 948,192 |
| Events in quadrant B | 3,165,057 | 944,055 |
| Events in quadrant C | 3,270,828 | 897,028 |
| Events in quadrant D | 4,023,938 | 885,267 |
| Mode M9 | |||
|---|---|---|---|
| Quadrant | BADHDUFLAG | Total packets | Discarded packets |
| A | 0 | 13 | 0 |
| B | 0 | 13 | 0 |
| C | 0 | 13 | 0 |
| D | 0 | 13 | 0 |
| Mode SS | |||
|---|---|---|---|
| Quadrant | BADHDUFLAG | Total packets | Discarded packets |
| A | 0 | 128 | 0 |
| B | 0 | 128 | 0 |
| C | 0 | 128 | 0 |
| D | 0 | 128 | 0 |
| Mode M0 | |||
|---|---|---|---|
| Quadrant | BADHDUFLAG | Total packets | Discarded packets |
| A | 0 | 13367 | 2 |
| B | 0 | 13288 | 2 |
| C | 0 | 13556 | 2 |
| D | 0 | 15925 | 2 |
| Quadrant | Total seconds | Saturated seconds | Saturation percentage |
|---|---|---|---|
| A | 6257 | 40 | 0.639284% |
| B | 6258 | 38 | 0.607223% |
| C | 6258 | 74 | 1.182486% |
| D | 6258 | 161 | 2.572707% |
Noise dominated data is calculated using 1-second bins in cleaned event files. If a bin has >2000 counts, and if more than 50% of those come from <1% of pixels, then it is considered to be noise-dominated and hence unusable.
| Quadrant | # 1 sec bins | Bins with >0 counts | Bins with >2000 counts | High rate bins dominated by noise | Noise dominated (total time) | Noise dominated (detector-on time) | Marked lightcurve |
|---|---|---|---|---|---|---|---|
| A | 7517 | 6257 | 0 | 0 | 0.00% | 0.00% | 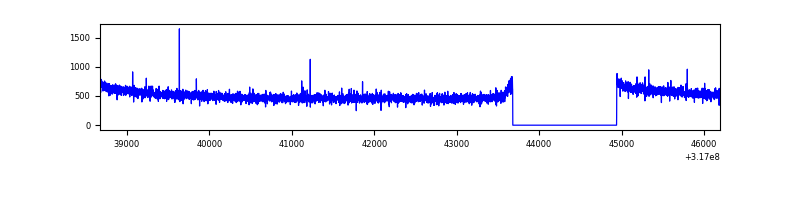 |
| B | 7518 | 6258 | 4 | 4 | 0.05% | 0.06% | 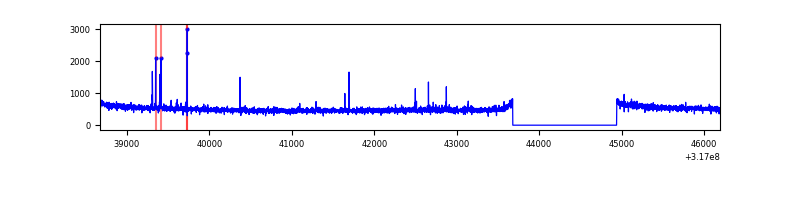 |
| C | 7518 | 6259 | 15 | 15 | 0.20% | 0.24% | 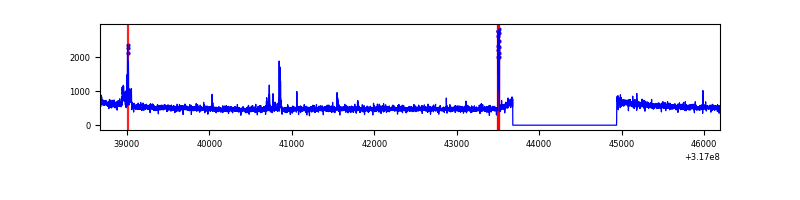 |
| D | 7518 | 6258 | 104 | 104 | 1.38% | 1.66% | 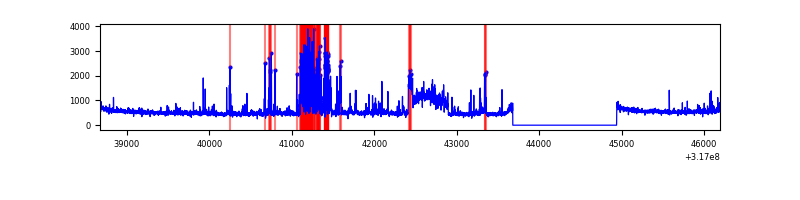 |
Top three noisy pixels from each quadrant. If the there are fewer than three noisy pixels in the level2.evt file, extra rows are filled as -1
| Pixel properties | Quadrant properties | ||||||
|---|---|---|---|---|---|---|---|
| Quadrant | DetID | PixID | Counts | Sigma | Mean | Median | Sigma |
| A | 13 | 254 | 9426 | 52.95 | 820 | 805 | 162.8 |
| A | 0 | 226 | 7173 | 39.11 | 820 | 805 | 162.8 |
| A | 3 | 137 | 6542 | 35.24 | 820 | 805 | 162.8 |
| B | 5 | 172 | 25081 | 165.27 | 799 | 781 | 147.0 |
| B | 0 | 229 | 20480 | 133.98 | 799 | 781 | 147.0 |
| B | 12 | 111 | 16972 | 110.12 | 799 | 781 | 147.0 |
| C | 14 | 238 | 126563 | 709.65 | 773 | 777 | 177.3 |
| C | 10 | 9 | 88087 | 492.58 | 773 | 777 | 177.3 |
| C | 0 | 239 | 29764 | 163.54 | 773 | 777 | 177.3 |
| D | 12 | 233 | 463116 | 2431.29 | 791 | 769 | 190.2 |
| D | 7 | 238 | 436279 | 2290.17 | 791 | 769 | 190.2 |
| D | 1 | 52 | 79374 | 413.35 | 791 | 769 | 190.2 |
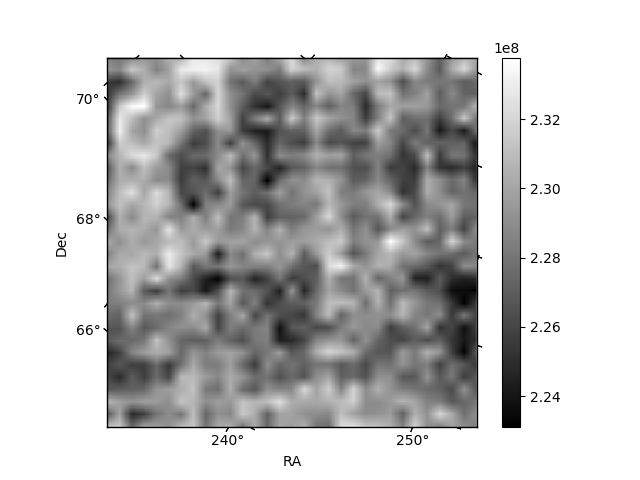
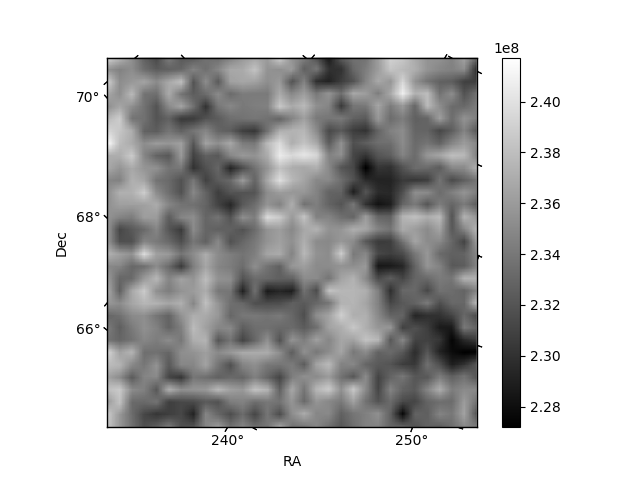
Histogram calculated using DETX and DETY for each event in the final _common_clean file
| Quadrant A |  |
 |
Quadrant B |
|---|---|---|---|
| Quadrant D |  |
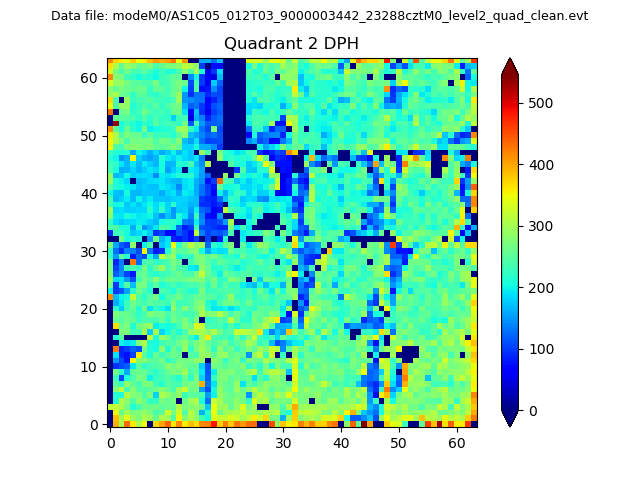 |
Quadrant C |
| Plot type | Count rate plots | Images |
|---|---|---|
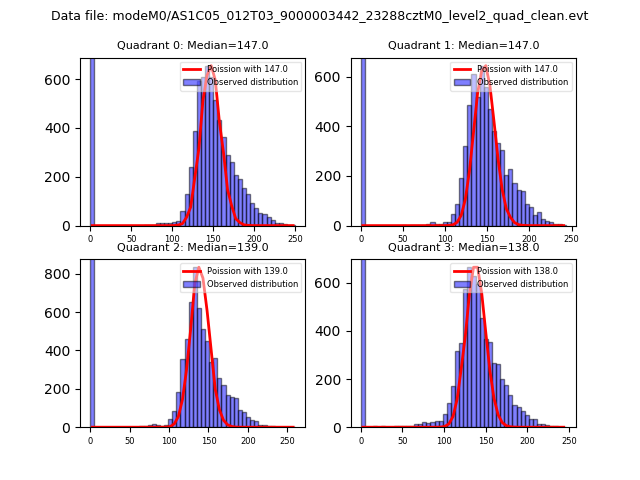
| Comparison with Poisson distribution Blue bars denote a histogram of data divided into 1 sec bins. Red curve is a Poisson curve with rate = median count rate of data. |
 |
 |
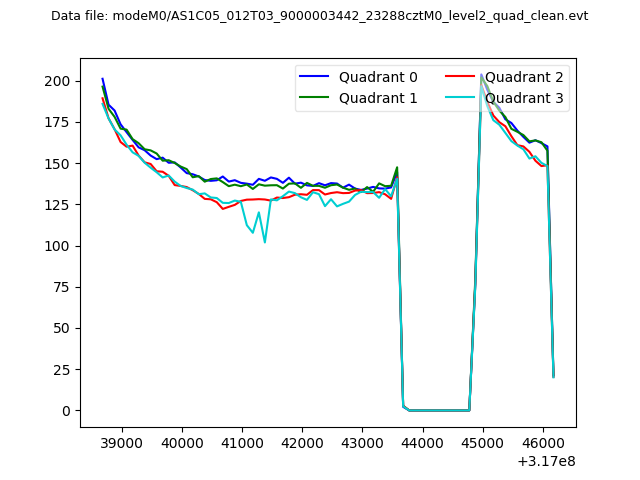
| Quadrant-wise count rates Data is divided into 100 sec bins |
 |
|
| Module-wise count rates for Quadrant A Data is divided into 100 sec bins |
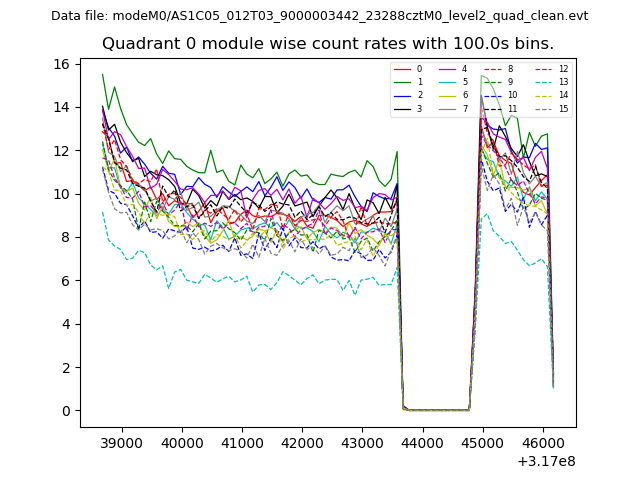 |
 |
| Module-wise count rates for Quadrant B Data is divided into 100 sec bins |
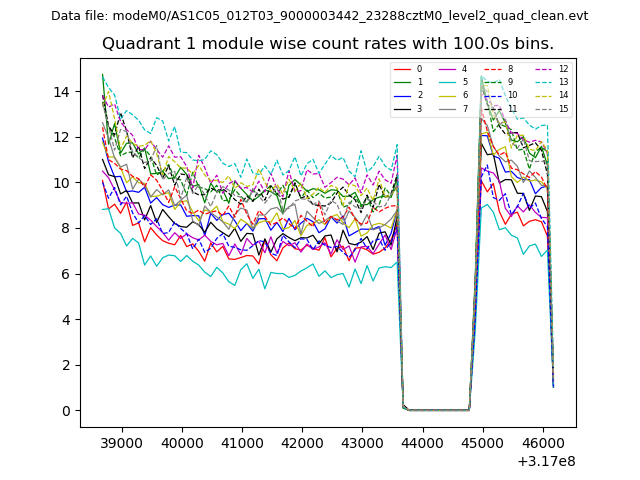 |
 |
| Module-wise count rates for Quadrant C Data is divided into 100 sec bins |
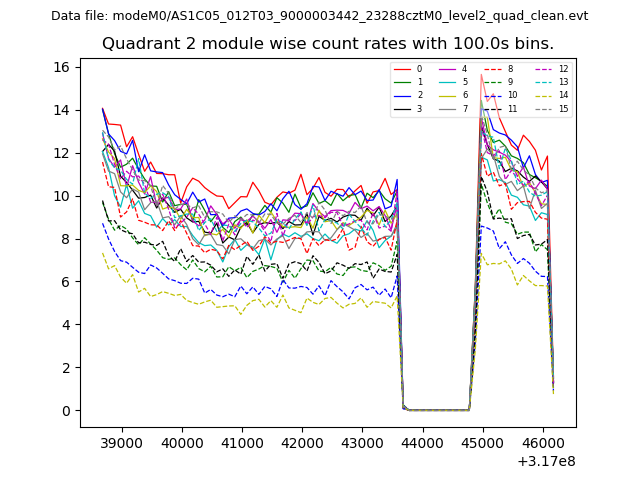 |
 |
| Module-wise count rates for Quadrant D Data is divided into 100 sec bins |
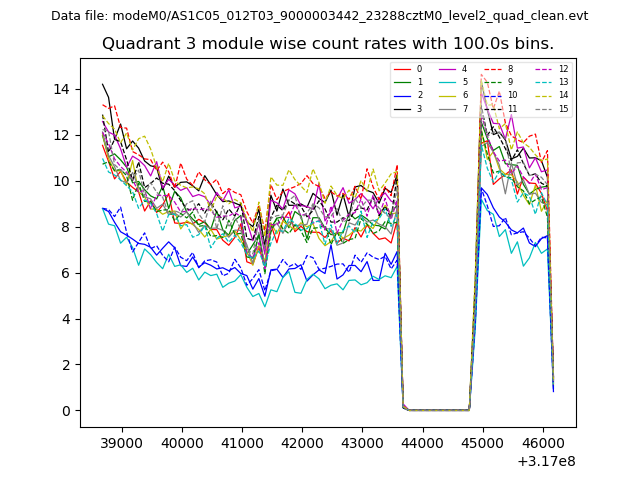 |
 |
| Parameter | Plot |
|---|---|
| CZT HV Monitor | 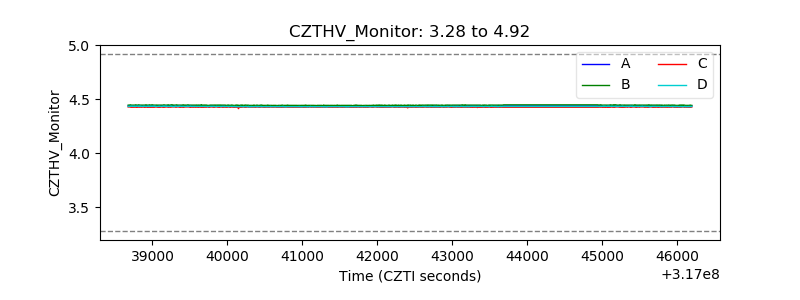 |
| D_VDD | 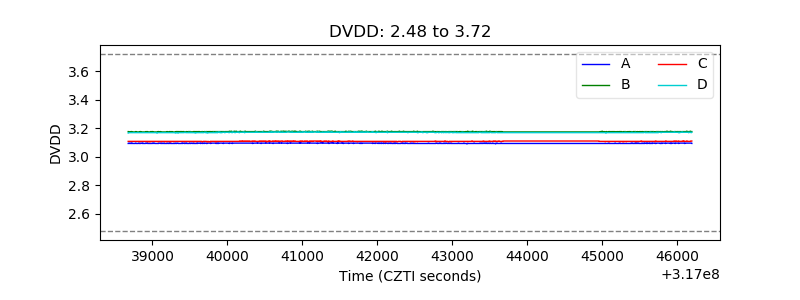 |
| Temperature 1 | 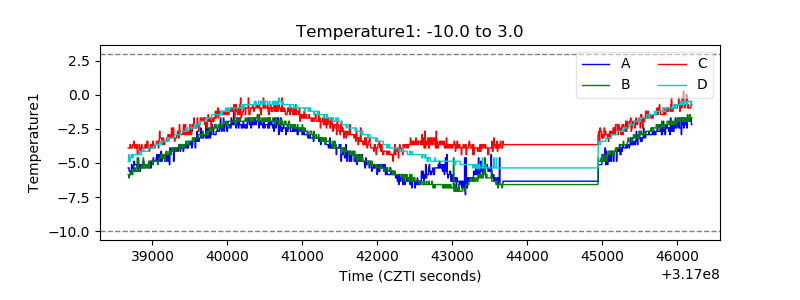 |
| Veto HV Monitor | 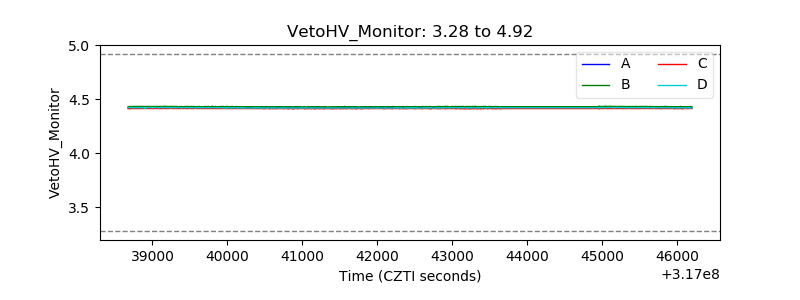 |
| Veto LLD | 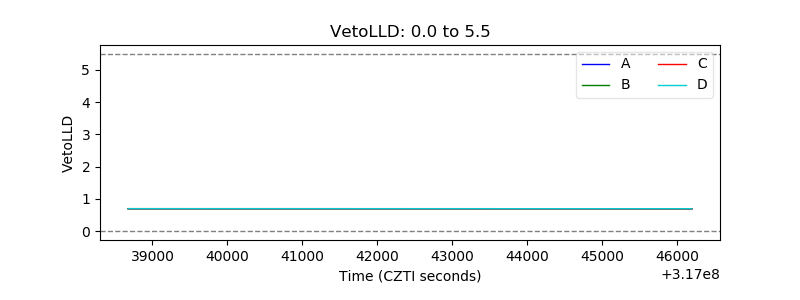 |
| Alpha Counter | 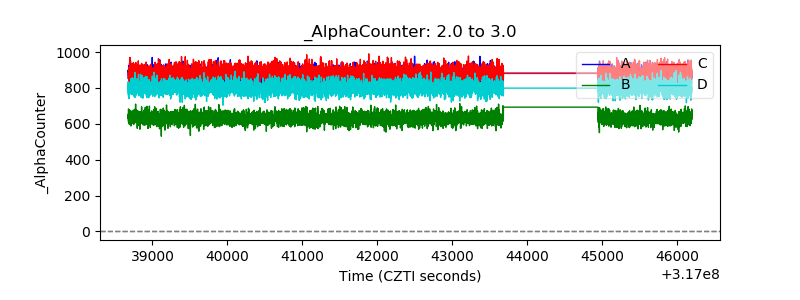 |
| _CPM_Rate | 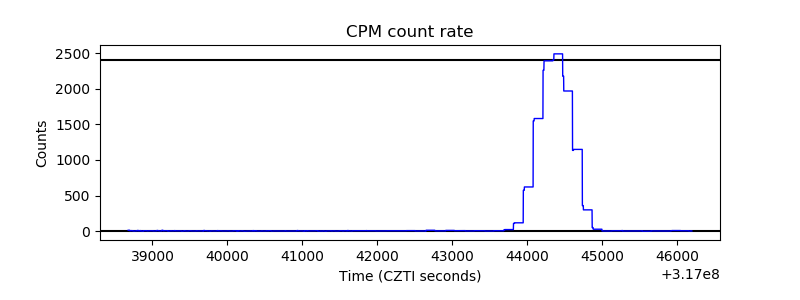 |
| CZT Counter | 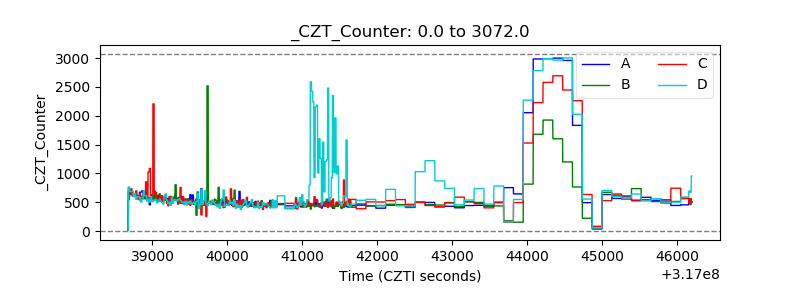 |
| +2.5 Volts monitor |  |
| +5 Volts monitor | 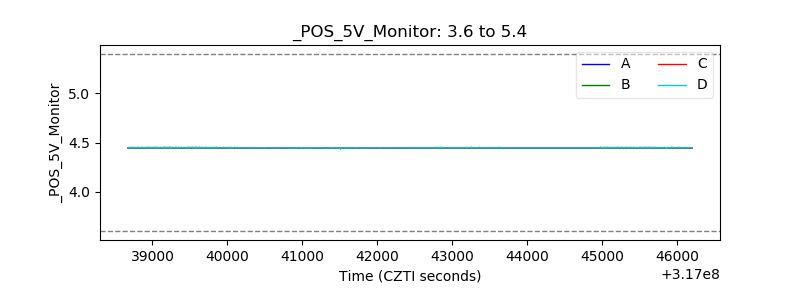 |
| _ROLL_ROT |  |
| _Roll_DEC | 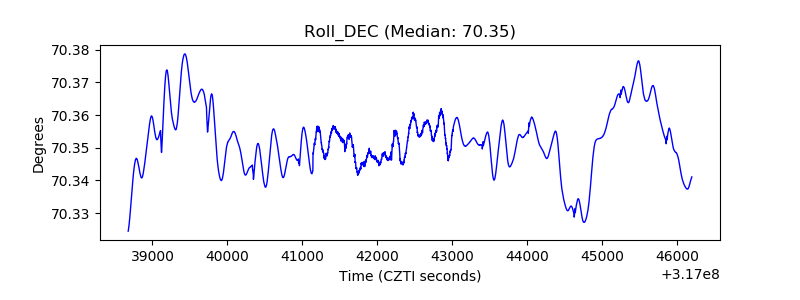 |
| _Roll_RA | 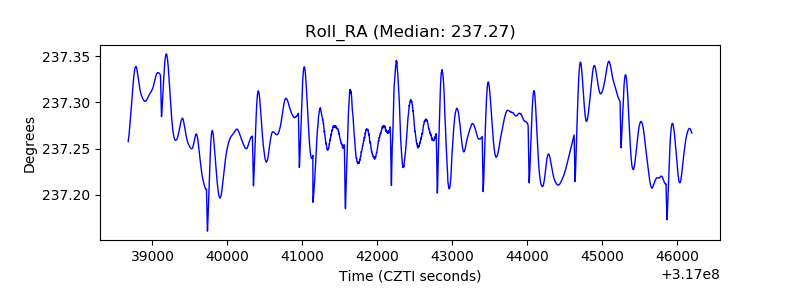 |
| Veto Counter | 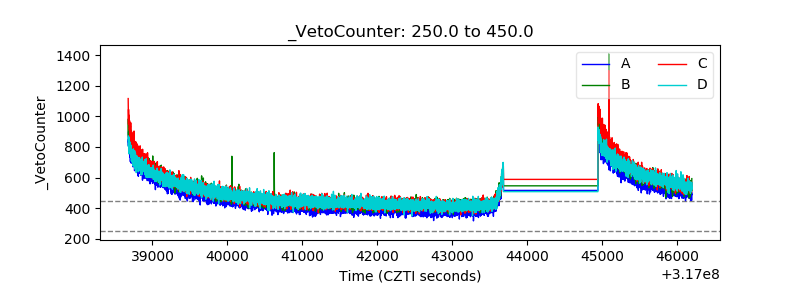 |