| Param | Original file | Final file |
|---|---|---|
| Filename | modeM0/AS1C05_012T03_9000003442_23289cztM0_level2.evt | modeM0/AS1C05_012T03_9000003442_23289cztM0_level2_quad_clean.evt |
| Size (bytes) | 508,043,520 | 143,778,240 |
| Size | 484.5 MB | 137.1 MB |
| Events in quadrant A | 3,313,494 | 1,002,131 |
| Events in quadrant B | 3,287,960 | 1,004,051 |
| Events in quadrant C | 3,350,819 | 958,464 |
| Events in quadrant D | 4,997,822 | 941,842 |
| Mode M9 | |||
|---|---|---|---|
| Quadrant | BADHDUFLAG | Total packets | Discarded packets |
| A | 0 | 15 | 0 |
| B | 0 | 16 | 0 |
| C | 0 | 16 | 0 |
| D | 0 | 16 | 0 |
| Mode SS | |||
|---|---|---|---|
| Quadrant | BADHDUFLAG | Total packets | Discarded packets |
| A | 0 | 130 | 0 |
| B | 0 | 130 | 0 |
| C | 0 | 130 | 0 |
| D | 0 | 130 | 0 |
| Mode M0 | |||
|---|---|---|---|
| Quadrant | BADHDUFLAG | Total packets | Discarded packets |
| A | 0 | 13894 | 2 |
| B | 0 | 13707 | 2 |
| C | 0 | 13832 | 2 |
| D | 0 | 19084 | 2 |
| Quadrant | Total seconds | Saturated seconds | Saturation percentage |
|---|---|---|---|
| A | 6433 | 49 | 0.761697% |
| B | 6433 | 51 | 0.792787% |
| C | 6433 | 59 | 0.917146% |
| D | 6433 | 142 | 2.207368% |
Noise dominated data is calculated using 1-second bins in cleaned event files. If a bin has >2000 counts, and if more than 50% of those come from <1% of pixels, then it is considered to be noise-dominated and hence unusable.
| Quadrant | # 1 sec bins | Bins with >0 counts | Bins with >2000 counts | High rate bins dominated by noise | Noise dominated (total time) | Noise dominated (detector-on time) | Marked lightcurve |
|---|---|---|---|---|---|---|---|
| A | 7763 | 6434 | 2 | 2 | 0.03% | 0.03% | 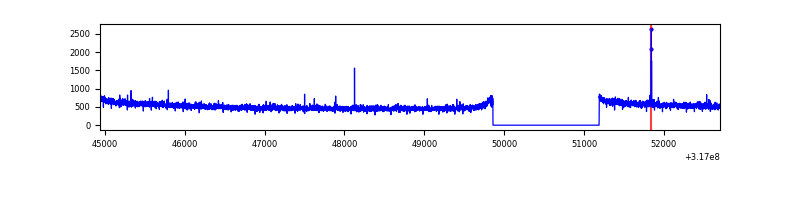 |
| B | 7763 | 6434 | 0 | 0 | 0.00% | 0.00% | 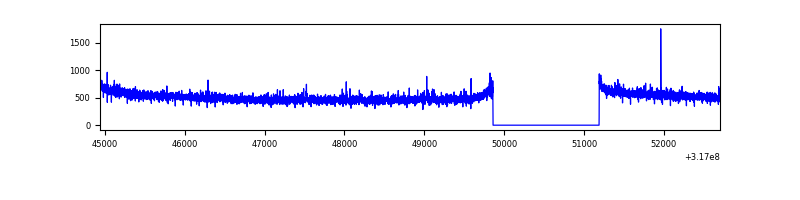 |
| C | 7763 | 6434 | 0 | 0 | 0.00% | 0.00% | 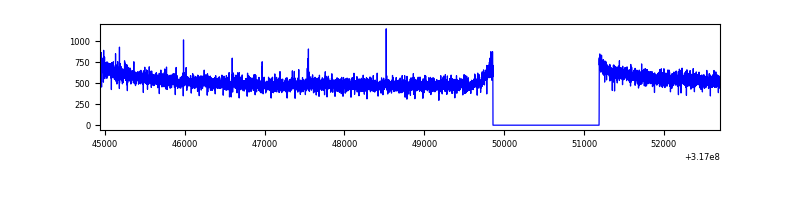 |
| D | 7763 | 6433 | 135 | 135 | 1.74% | 2.10% | 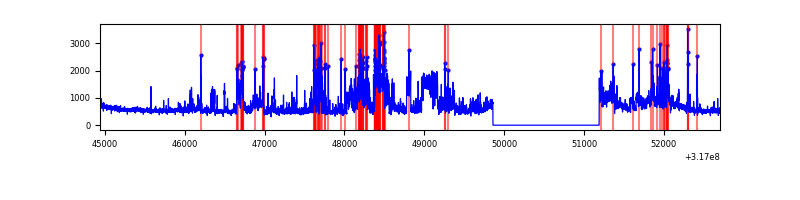 |
Top three noisy pixels from each quadrant. If the there are fewer than three noisy pixels in the level2.evt file, extra rows are filled as -1
| Pixel properties | Quadrant properties | ||||||
|---|---|---|---|---|---|---|---|
| Quadrant | DetID | PixID | Counts | Sigma | Mean | Median | Sigma |
| A | 13 | 254 | 9940 | 53.99 | 857 | 844 | 168.5 |
| A | 4 | 208 | 7410 | 38.97 | 857 | 844 | 168.5 |
| A | 0 | 226 | 7353 | 38.63 | 857 | 844 | 168.5 |
| B | 0 | 229 | 19077 | 119.27 | 836 | 818 | 153.1 |
| B | 12 | 111 | 17403 | 108.34 | 836 | 818 | 153.1 |
| B | 11 | 111 | 15728 | 97.4 | 836 | 818 | 153.1 |
| C | 14 | 238 | 131364 | 702.98 | 817 | 822 | 185.7 |
| C | 7 | 247 | 12831 | 64.67 | 817 | 822 | 185.7 |
| C | 0 | 239 | 12421 | 62.46 | 817 | 822 | 185.7 |
| D | 7 | 238 | 1035169 | 5163.24 | 837 | 813 | 200.3 |
| D | 1 | 52 | 383071 | 1908.13 | 837 | 813 | 200.3 |
| D | 12 | 233 | 298065 | 1483.8 | 837 | 813 | 200.3 |
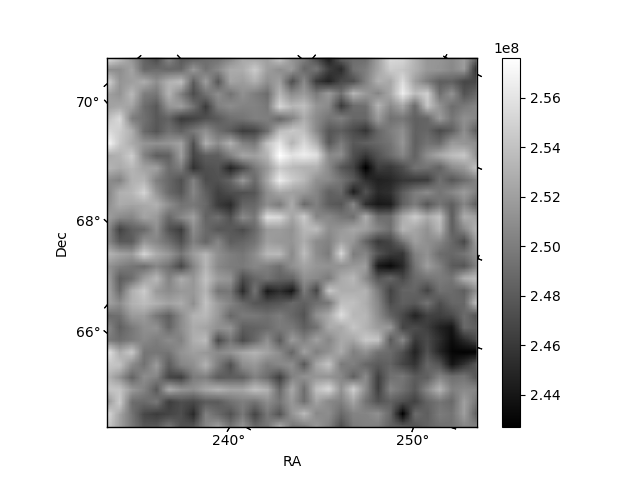
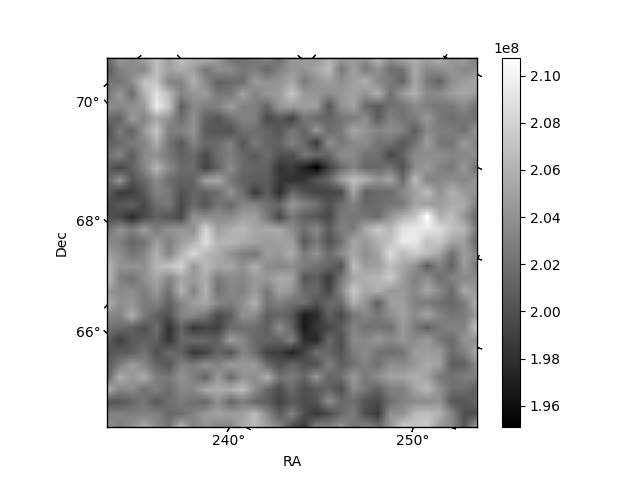
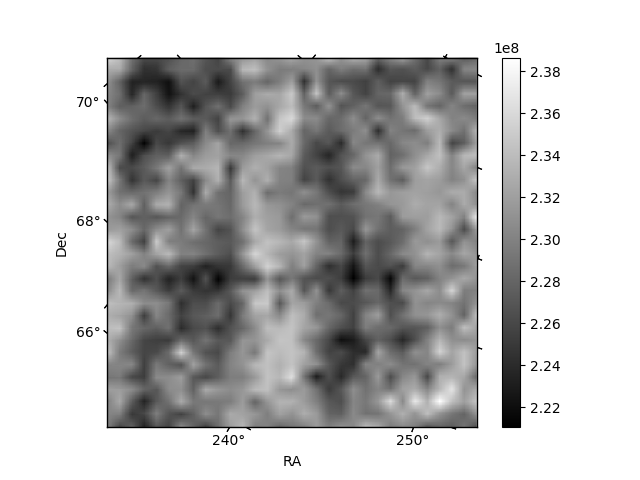
Histogram calculated using DETX and DETY for each event in the final _common_clean file
| Quadrant A | 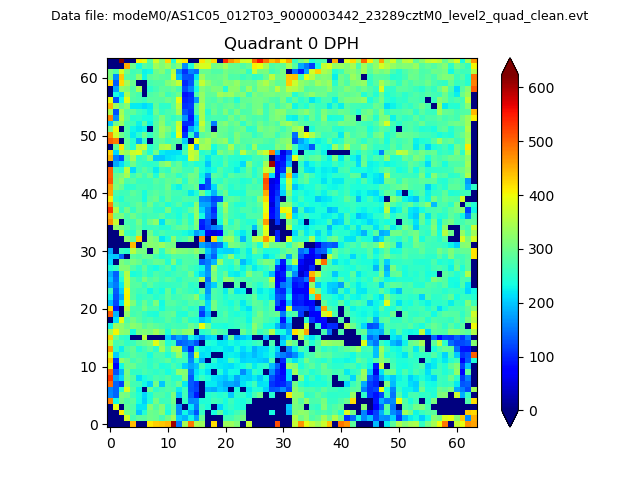 |
 |
Quadrant B |
|---|---|---|---|
| Quadrant D |  |
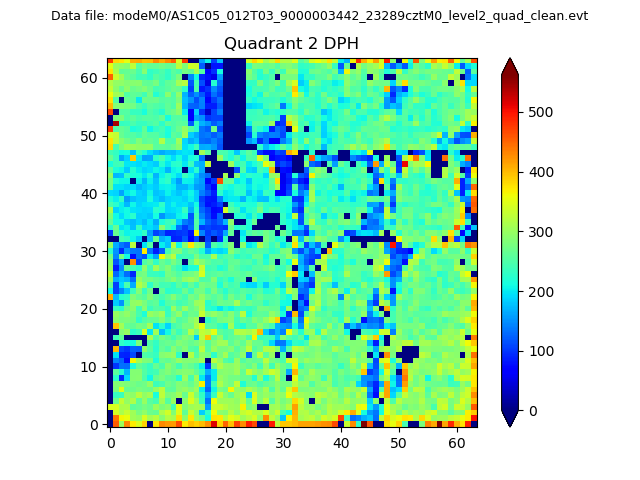 |
Quadrant C |
| Plot type | Count rate plots | Images |
|---|---|---|
| Comparison with Poisson distribution Blue bars denote a histogram of data divided into 1 sec bins. Red curve is a Poisson curve with rate = median count rate of data. |
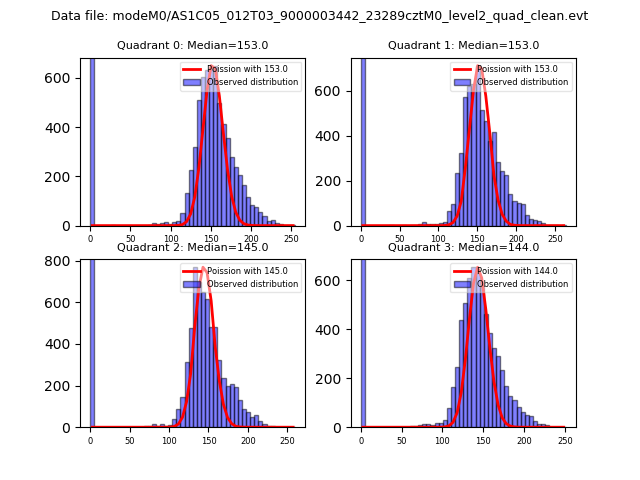 |
 |
| Quadrant-wise count rates Data is divided into 100 sec bins |
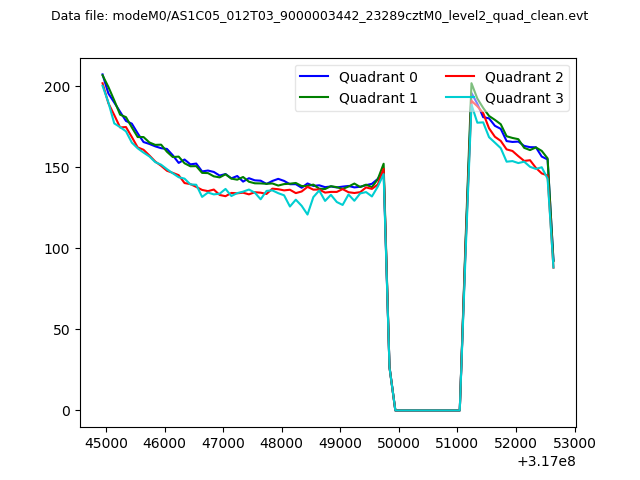 |
|
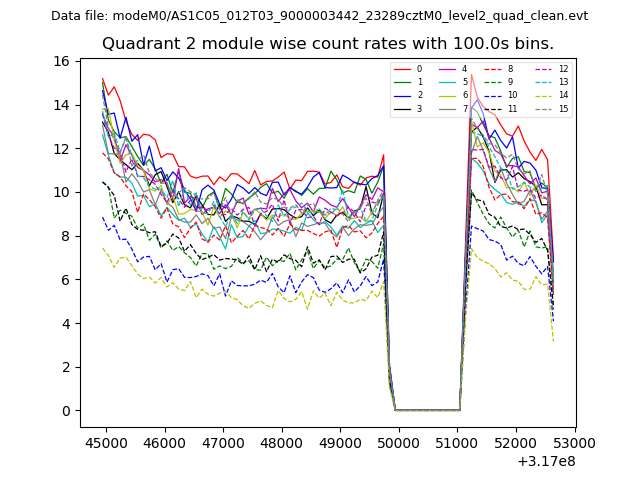
| Module-wise count rates for Quadrant A Data is divided into 100 sec bins |
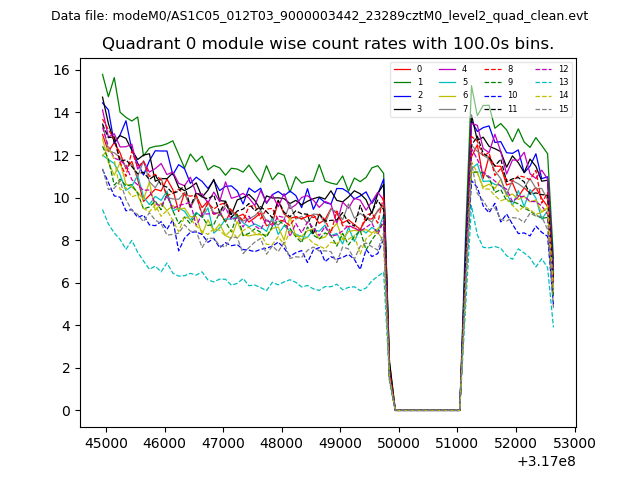 |
 |
| Module-wise count rates for Quadrant B Data is divided into 100 sec bins |
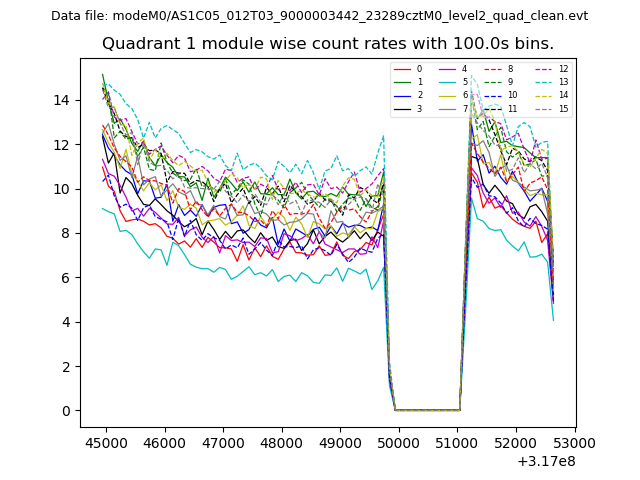 |
 |
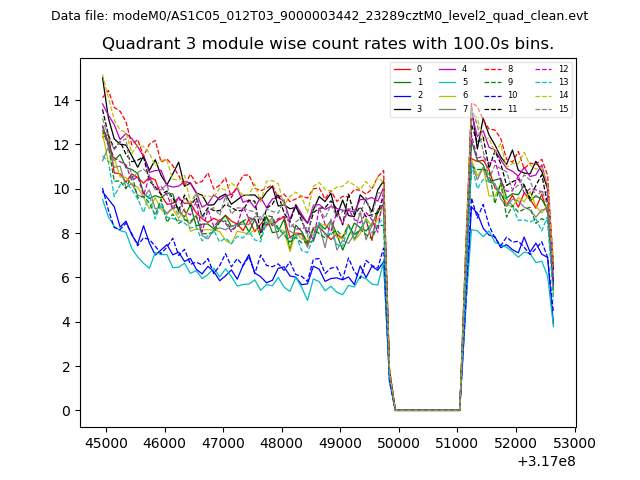
| Module-wise count rates for Quadrant C Data is divided into 100 sec bins |
 |
 |
| Module-wise count rates for Quadrant D Data is divided into 100 sec bins |
 |
 |
| Parameter | Plot |
|---|---|
| CZT HV Monitor | 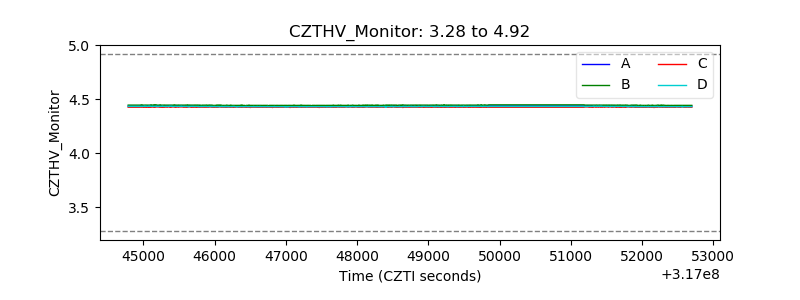 |
| D_VDD | 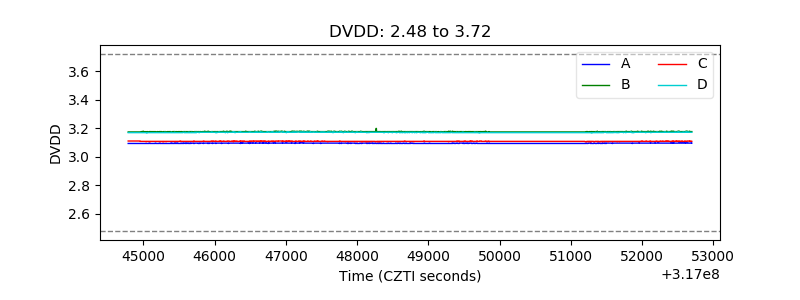 |
| Temperature 1 | 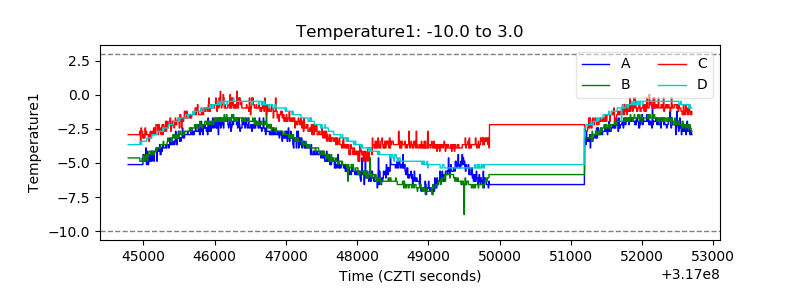 |
| Veto HV Monitor | 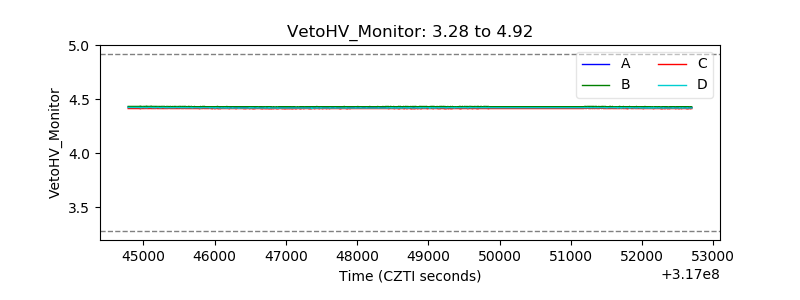 |
| Veto LLD | 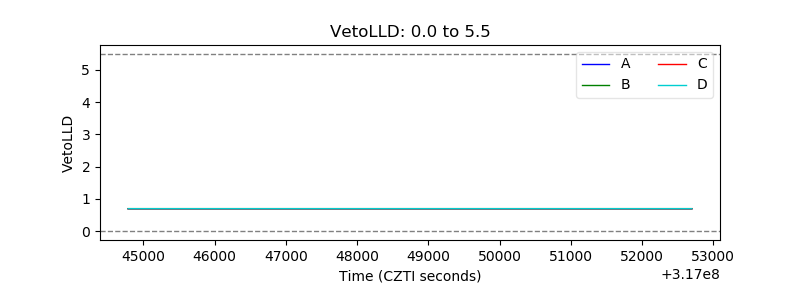 |
| Alpha Counter | 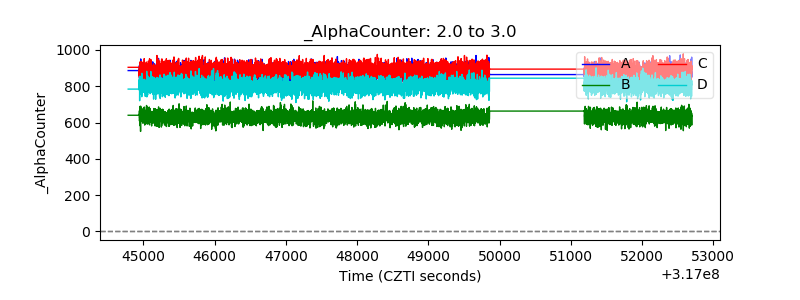 |
| _CPM_Rate | 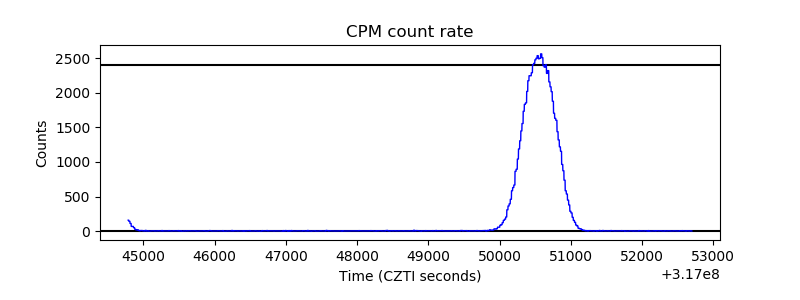 |
| CZT Counter | 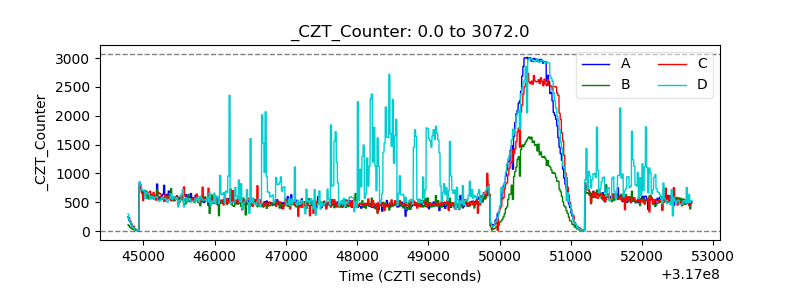 |
| +2.5 Volts monitor |  |
| +5 Volts monitor | 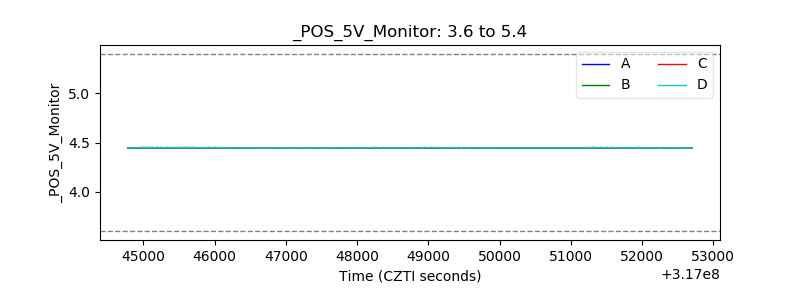 |
| _ROLL_ROT | 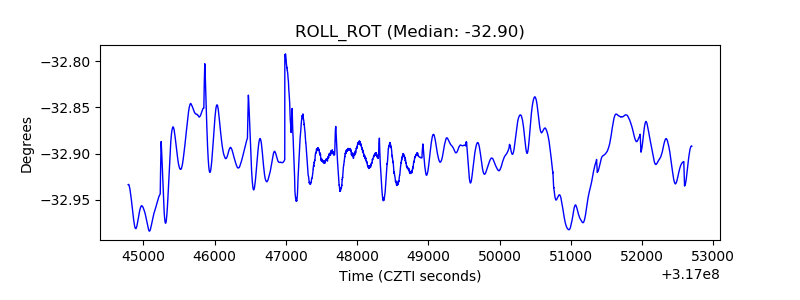 |
| _Roll_DEC | 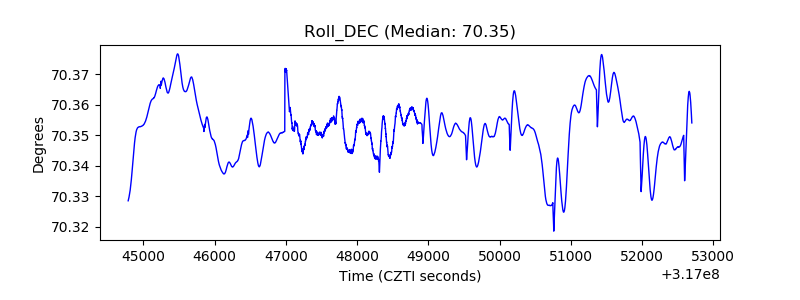 |
| _Roll_RA | 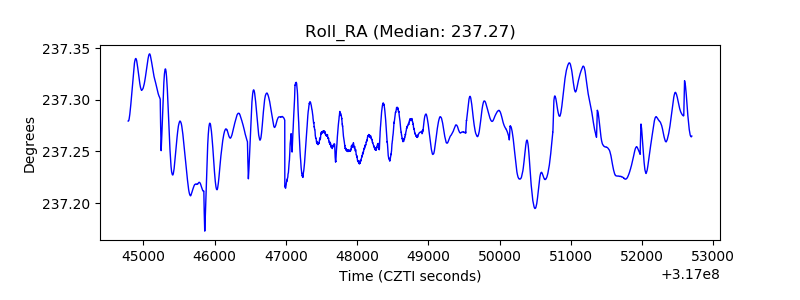 |
| Veto Counter | 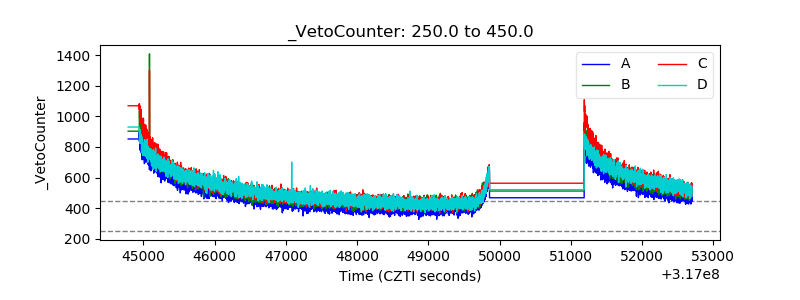 |