| Param | Original file | Final file |
|---|---|---|
| Filename | modeM0/AS1C05_012T03_9000003442_23290cztM0_level2.evt | modeM0/AS1C05_012T03_9000003442_23290cztM0_level2_quad_clean.evt |
| Size (bytes) | 451,382,400 | 126,417,600 |
| Size | 430.5 MB | 120.6 MB |
| Events in quadrant A | 2,925,313 | 875,289 |
| Events in quadrant B | 2,945,679 | 880,224 |
| Events in quadrant C | 2,986,003 | 846,144 |
| Events in quadrant D | 4,417,653 | 820,434 |
| Mode M9 | |||
|---|---|---|---|
| Quadrant | BADHDUFLAG | Total packets | Discarded packets |
| A | 0 | 13 | 0 |
| B | 0 | 13 | 0 |
| C | 0 | 13 | 0 |
| D | 0 | 13 | 0 |
| Mode SS | |||
|---|---|---|---|
| Quadrant | BADHDUFLAG | Total packets | Discarded packets |
| A | 0 | 118 | 0 |
| B | 0 | 118 | 0 |
| C | 0 | 120 | 0 |
| D | 0 | 120 | 0 |
| Mode M0 | |||
|---|---|---|---|
| Quadrant | BADHDUFLAG | Total packets | Discarded packets |
| A | 0 | 12260 | 1 |
| B | 0 | 12264 | 1 |
| C | 0 | 12307 | 2 |
| D | 0 | 17020 | 1 |
| Quadrant | Total seconds | Saturated seconds | Saturation percentage |
|---|---|---|---|
| A | 5821 | 83 | 1.425872% |
| B | 5821 | 93 | 1.597664% |
| C | 5821 | 116 | 1.992785% |
| D | 5821 | 429 | 7.369868% |
Noise dominated data is calculated using 1-second bins in cleaned event files. If a bin has >2000 counts, and if more than 50% of those come from <1% of pixels, then it is considered to be noise-dominated and hence unusable.
| Quadrant | # 1 sec bins | Bins with >0 counts | Bins with >2000 counts | High rate bins dominated by noise | Noise dominated (total time) | Noise dominated (detector-on time) | Marked lightcurve |
|---|---|---|---|---|---|---|---|
| A | 7126 | 5822 | 2 | 2 | 0.03% | 0.03% | 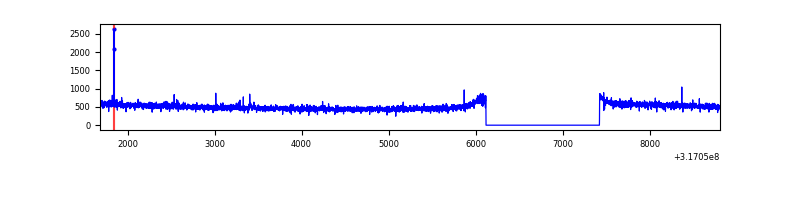 |
| B | 7126 | 5821 | 1 | 1 | 0.01% | 0.02% | 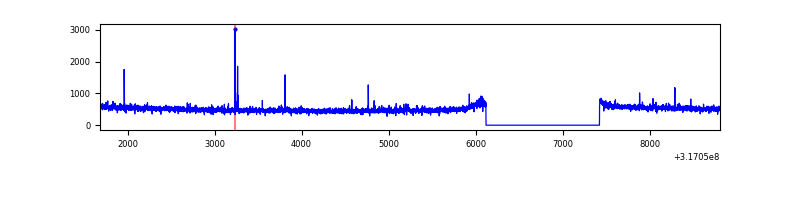 |
| C | 7126 | 5821 | 0 | 0 | 0.00% | 0.00% | 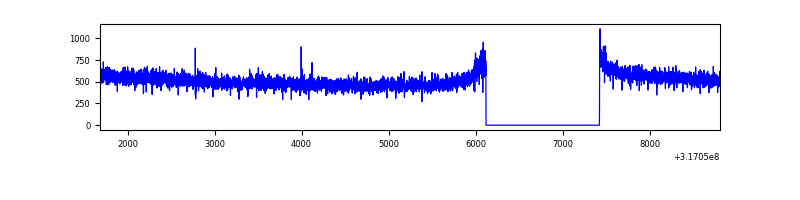 |
| D | 7126 | 5822 | 301 | 301 | 4.22% | 5.17% | 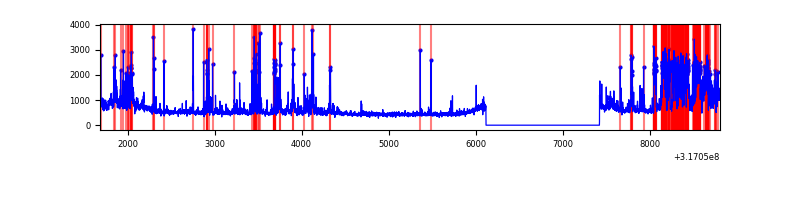 |
Top three noisy pixels from each quadrant. If the there are fewer than three noisy pixels in the level2.evt file, extra rows are filled as -1
| Pixel properties | Quadrant properties | ||||||
|---|---|---|---|---|---|---|---|
| Quadrant | DetID | PixID | Counts | Sigma | Mean | Median | Sigma |
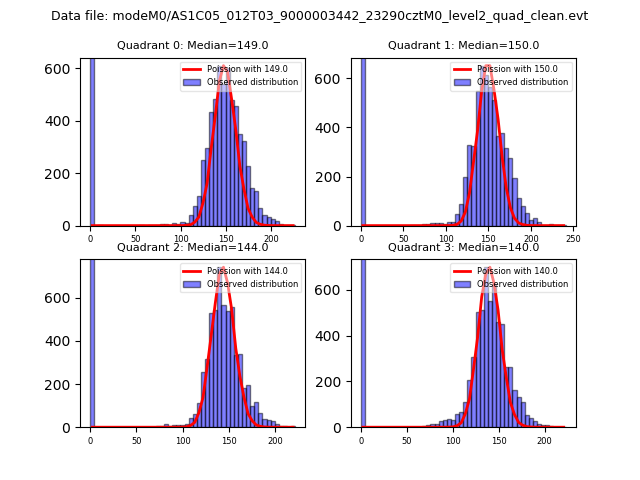
| A | 6 | 16 | 9371 | 57.39 | 755 | 740 | 150.4 |
| A | 13 | 254 | 8708 | 52.98 | 755 | 740 | 150.4 |
| A | 4 | 208 | 7278 | 43.47 | 755 | 740 | 150.4 |
| B | 12 | 111 | 15421 | 106.59 | 745 | 727 | 137.9 |
| B | 11 | 111 | 13825 | 95.01 | 745 | 727 | 137.9 |
| B | 14 | 111 | 11553 | 78.53 | 745 | 727 | 137.9 |
| C | 14 | 238 | 117896 | 702.99 | 729 | 734 | 166.7 |
| C | 7 | 247 | 10977 | 61.46 | 729 | 734 | 166.7 |
| C | 0 | 239 | 10853 | 60.72 | 729 | 734 | 166.7 |
| D | 7 | 238 | 992708 | 5578.65 | 735 | 714 | 177.8 |
| D | 1 | 52 | 367509 | 2062.73 | 735 | 714 | 177.8 |
| D | 12 | 233 | 159636 | 893.73 | 735 | 714 | 177.8 |
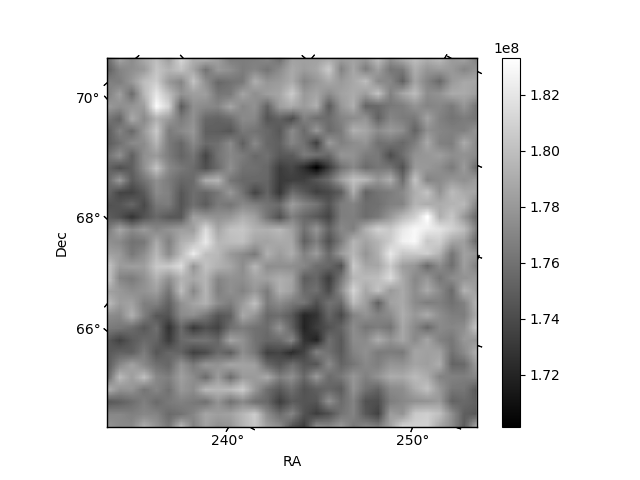
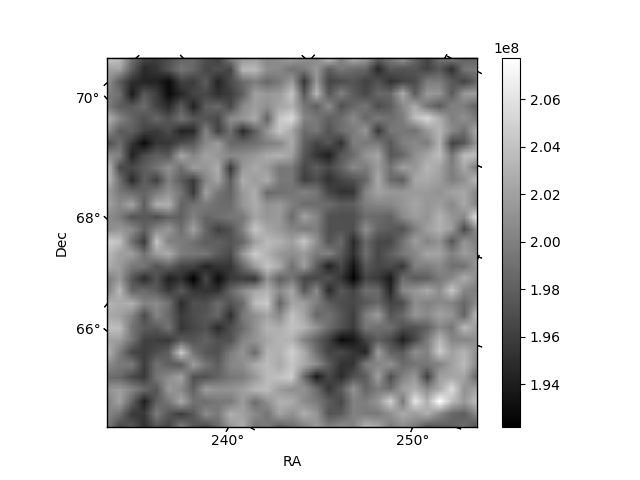
Histogram calculated using DETX and DETY for each event in the final _common_clean file
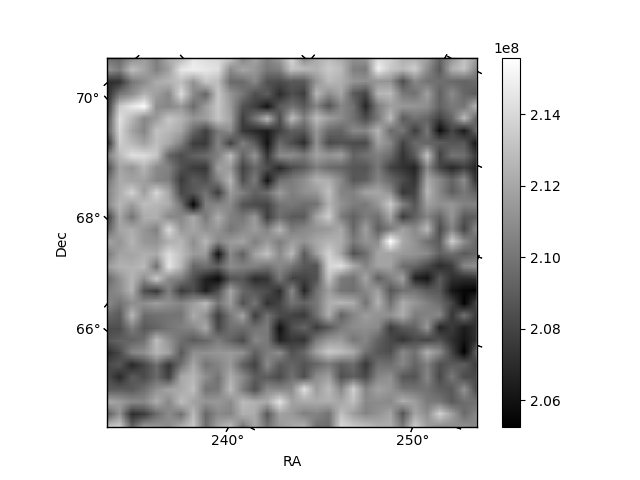
| Quadrant A |  |
 |
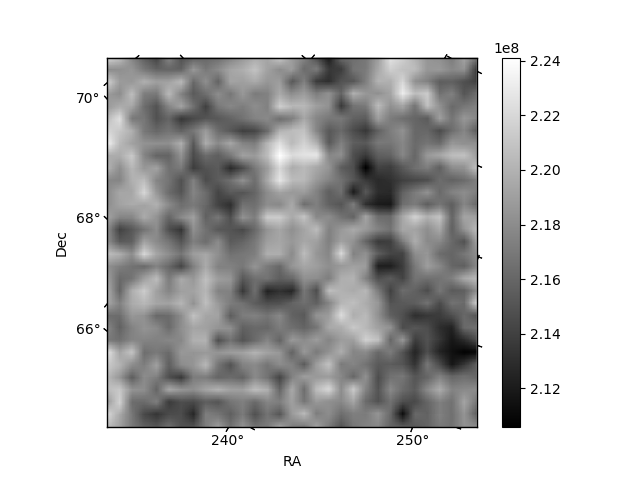
Quadrant B |
|---|---|---|---|
| Quadrant D |  |
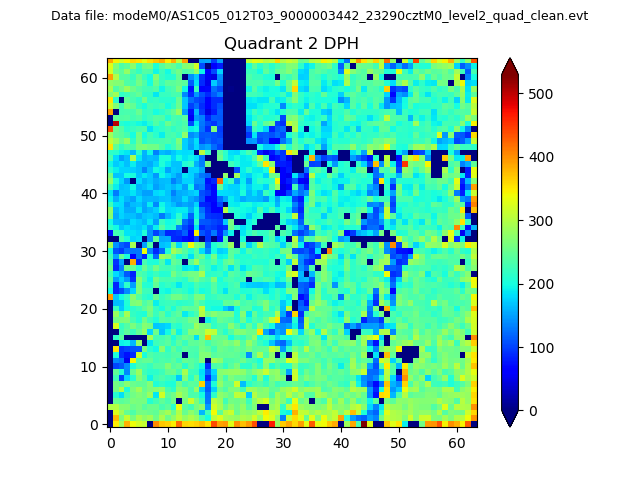 |
Quadrant C |
| Plot type | Count rate plots | Images |
|---|---|---|
| Comparison with Poisson distribution Blue bars denote a histogram of data divided into 1 sec bins. Red curve is a Poisson curve with rate = median count rate of data. |
 |
 |
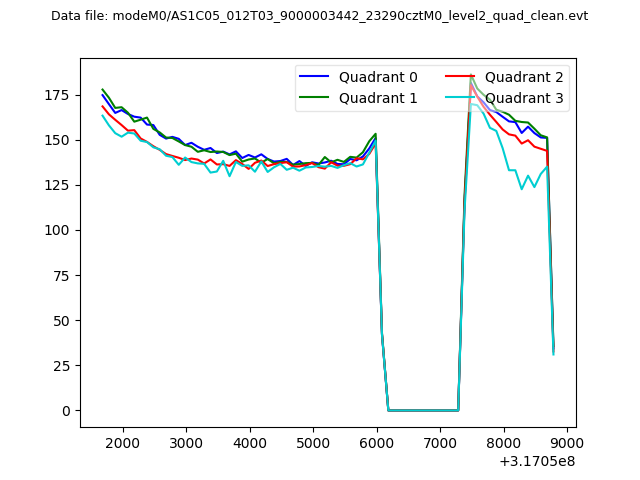
| Quadrant-wise count rates Data is divided into 100 sec bins |
 |
|
| Module-wise count rates for Quadrant A Data is divided into 100 sec bins |
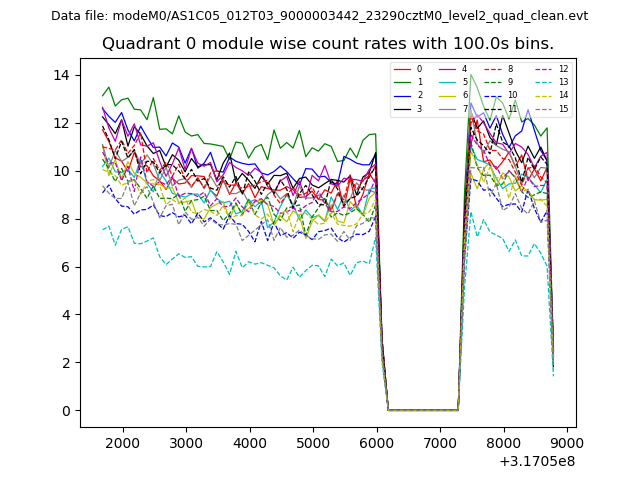 |
 |
| Module-wise count rates for Quadrant B Data is divided into 100 sec bins |
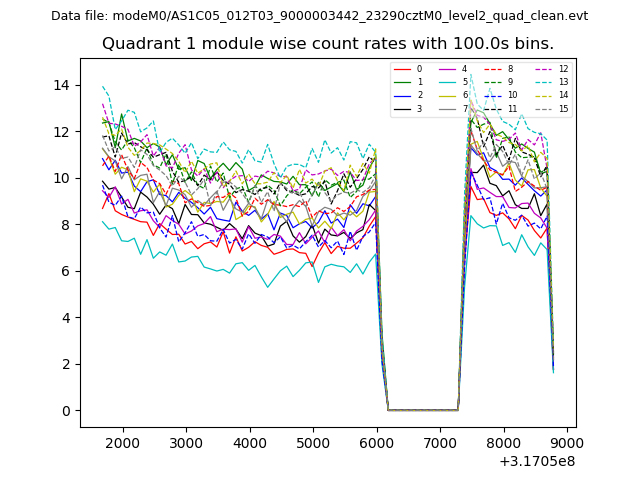 |
 |
| Module-wise count rates for Quadrant C Data is divided into 100 sec bins |
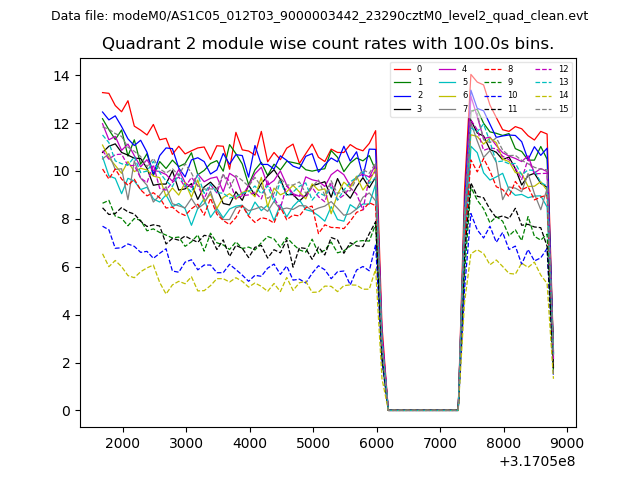 |
 |
| Module-wise count rates for Quadrant D Data is divided into 100 sec bins |
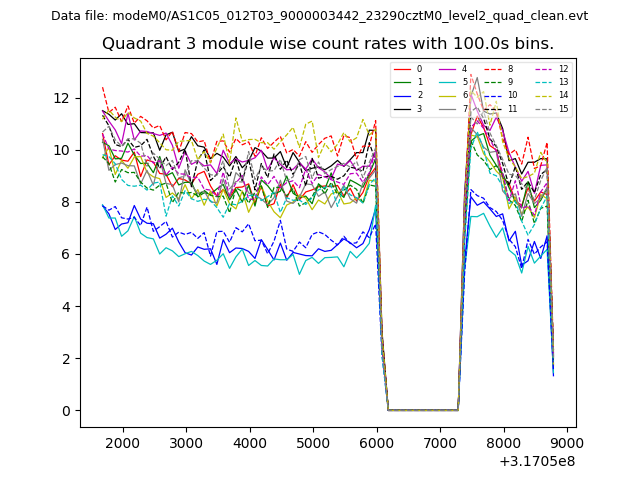 |
 |
| Parameter | Plot |
|---|---|
| CZT HV Monitor | 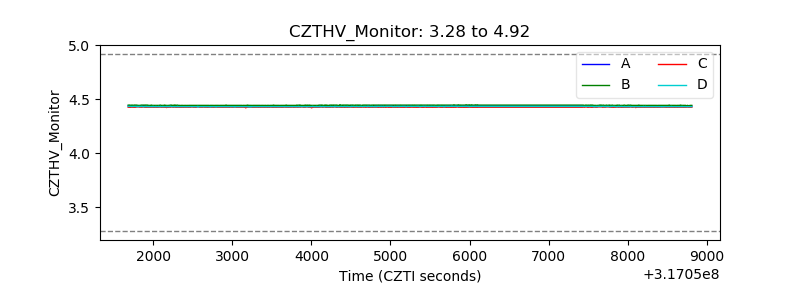 |
| D_VDD | 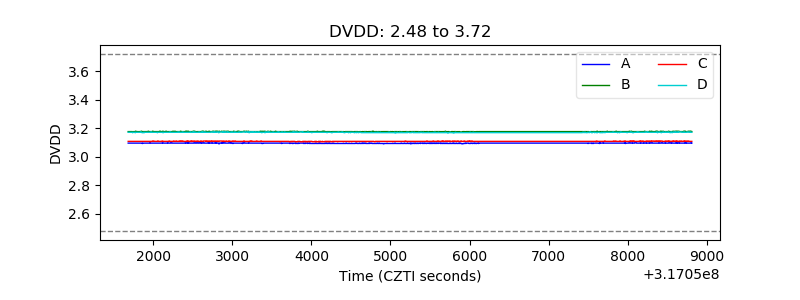 |
| Temperature 1 | 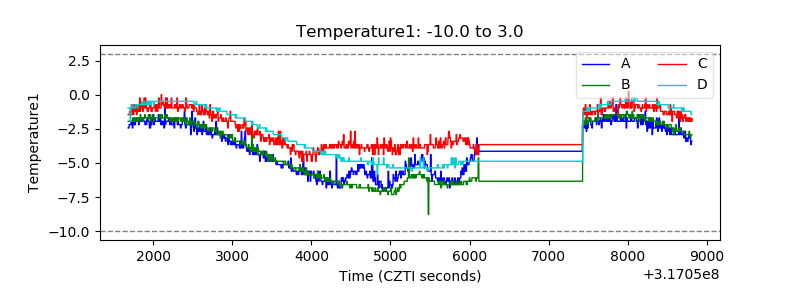 |
| Veto HV Monitor | 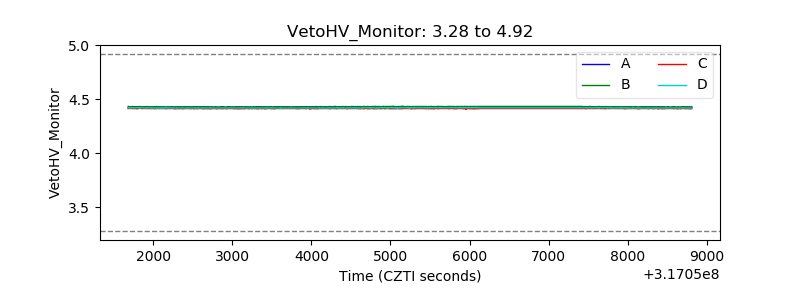 |
| Veto LLD | 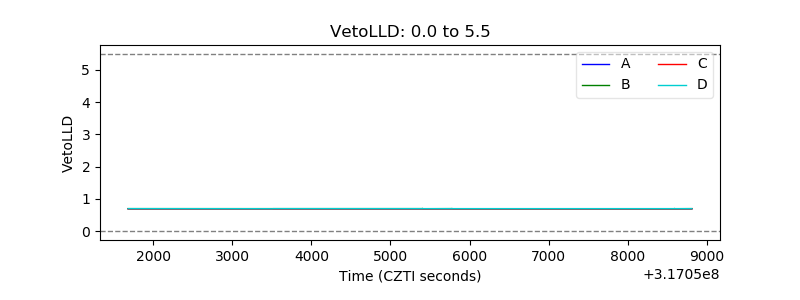 |
| Alpha Counter | 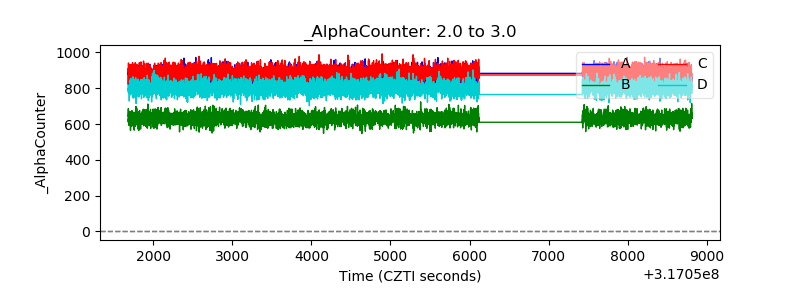 |
| _CPM_Rate | 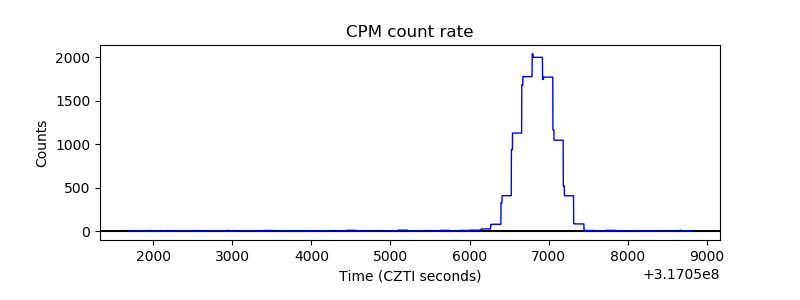 |
| CZT Counter | 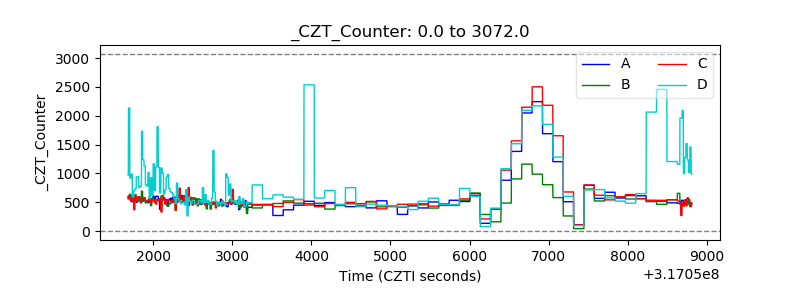 |
| +2.5 Volts monitor |  |
| +5 Volts monitor |  |
| _ROLL_ROT | 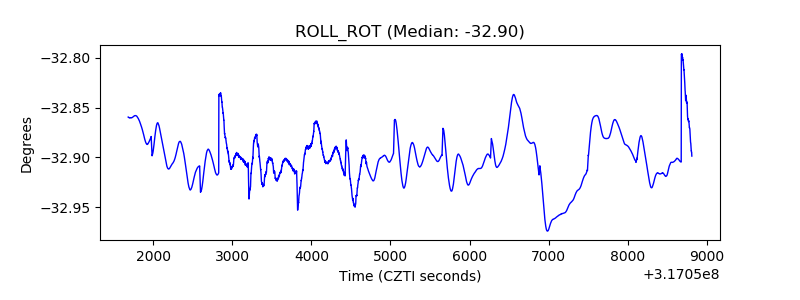 |
| _Roll_DEC | 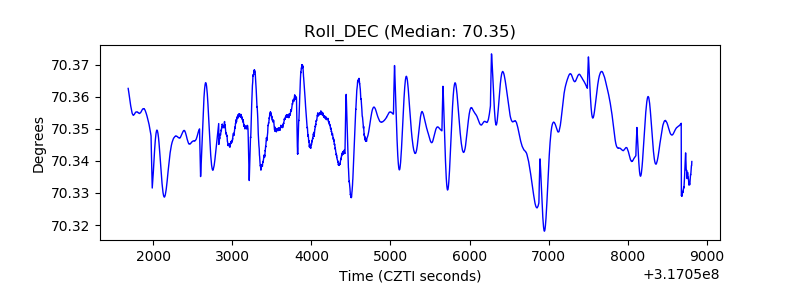 |
| _Roll_RA | 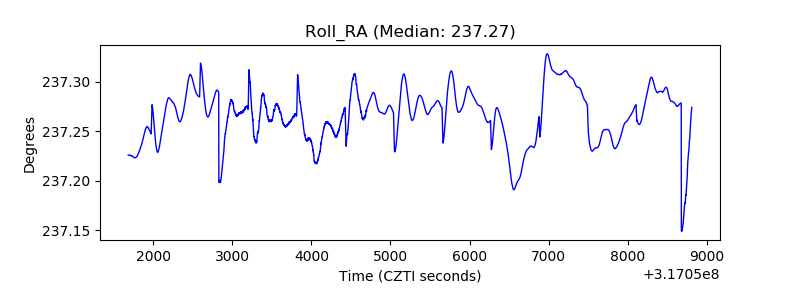 |
| Veto Counter | 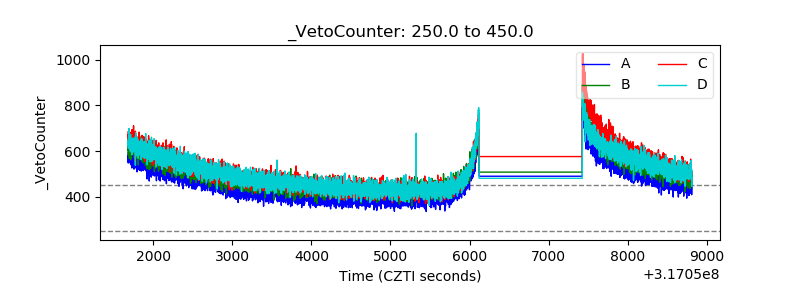 |