| Param | Original file | Final file |
|---|---|---|
| Filename | modeM0/AS1C05_012T03_9000003442_23291cztM0_level2.evt | modeM0/AS1C05_012T03_9000003442_23291cztM0_level2_quad_clean.evt |
| Size (bytes) | 498,072,960 | 118,972,800 |
| Size | 475.0 MB | 113.5 MB |
| Events in quadrant A | 2,831,157 | 837,815 |
| Events in quadrant B | 2,959,678 | 844,459 |
| Events in quadrant C | 2,987,990 | 816,559 |
| Events in quadrant D | 5,908,427 | 695,655 |
| Mode M9 | |||
|---|---|---|---|
| Quadrant | BADHDUFLAG | Total packets | Discarded packets |
| A | 0 | 13 | 0 |
| B | 0 | 13 | 0 |
| C | 0 | 13 | 0 |
| D | 0 | 13 | 0 |
| Mode SS | |||
|---|---|---|---|
| Quadrant | BADHDUFLAG | Total packets | Discarded packets |
| A | 0 | 118 | 0 |
| B | 0 | 118 | 0 |
| C | 0 | 118 | 0 |
| D | 0 | 118 | 0 |
| Mode M0 | |||
|---|---|---|---|
| Quadrant | BADHDUFLAG | Total packets | Discarded packets |
| A | 0 | 12090 | 2 |
| B | 0 | 12389 | 1 |
| C | 0 | 12343 | 1 |
| D | 0 | 21547 | 1 |
| Quadrant | Total seconds | Saturated seconds | Saturation percentage |
|---|---|---|---|
| A | 5845 | 67 | 1.146279% |
| B | 5846 | 89 | 1.522408% |
| C | 5846 | 98 | 1.676360% |
| D | 5846 | 1277 | 21.843996% |
Noise dominated data is calculated using 1-second bins in cleaned event files. If a bin has >2000 counts, and if more than 50% of those come from <1% of pixels, then it is considered to be noise-dominated and hence unusable.
| Quadrant | # 1 sec bins | Bins with >0 counts | Bins with >2000 counts | High rate bins dominated by noise | Noise dominated (total time) | Noise dominated (detector-on time) | Marked lightcurve |
|---|---|---|---|---|---|---|---|
| A | 7100 | 5846 | 0 | 0 | 0.00% | 0.00% | 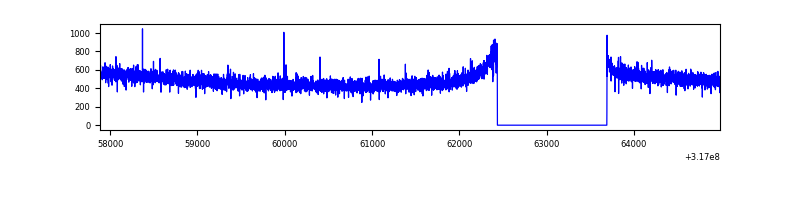 |
| B | 7101 | 5846 | 13 | 13 | 0.18% | 0.22% | 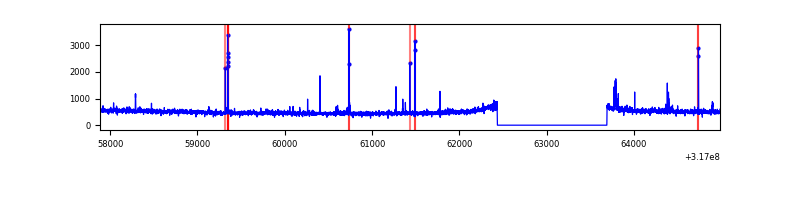 |
| C | 7101 | 5847 | 1 | 1 | 0.01% | 0.02% | 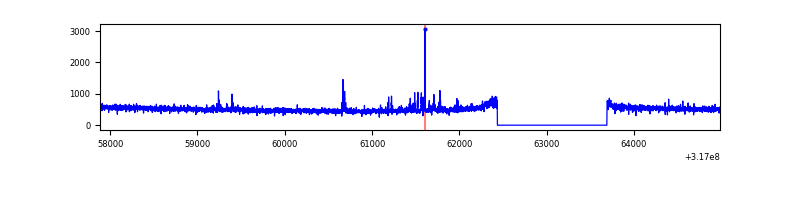 |
| D | 7101 | 5847 | 1052 | 1052 | 14.81% | 17.99% | 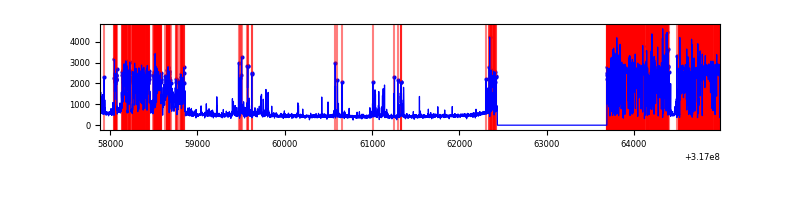 |
Top three noisy pixels from each quadrant. If the there are fewer than three noisy pixels in the level2.evt file, extra rows are filled as -1
| Pixel properties | Quadrant properties | ||||||
|---|---|---|---|---|---|---|---|
| Quadrant | DetID | PixID | Counts | Sigma | Mean | Median | Sigma |
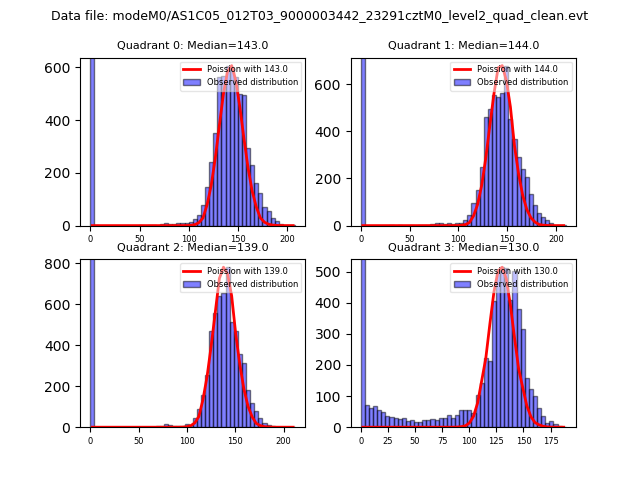
| A | 13 | 254 | 8939 | 56.24 | 733 | 718 | 146.2 |
| A | 0 | 226 | 6477 | 39.4 | 733 | 718 | 146.2 |
| A | 3 | 137 | 5821 | 34.91 | 733 | 718 | 146.2 |
| B | 5 | 172 | 54486 | 395.67 | 728 | 710 | 135.9 |
| B | 0 | 190 | 33460 | 240.97 | 728 | 710 | 135.9 |
| B | 12 | 111 | 15434 | 108.34 | 728 | 710 | 135.9 |
| C | 14 | 238 | 116170 | 706.1 | 713 | 717 | 163.5 |
| C | 5 | 4 | 52909 | 319.2 | 713 | 717 | 163.5 |
| C | 7 | 247 | 27969 | 166.67 | 713 | 717 | 163.5 |
| D | 1 | 52 | 2501988 | 16354.94 | 636 | 619 | 152.9 |
| D | 7 | 238 | 871537 | 5694.4 | 636 | 619 | 152.9 |
| D | 1 | 239 | 55123 | 356.37 | 636 | 619 | 152.9 |
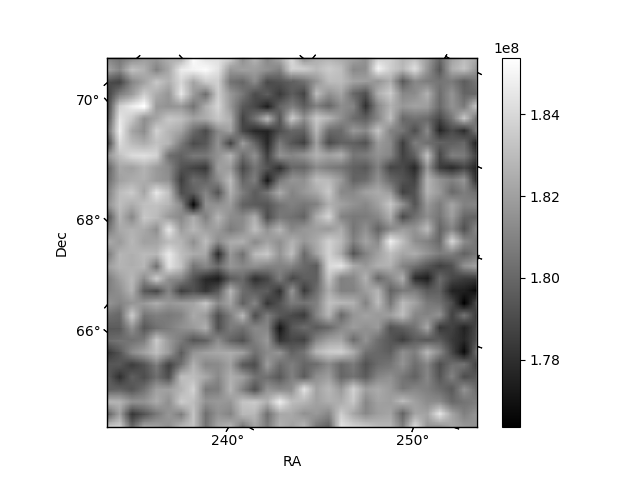
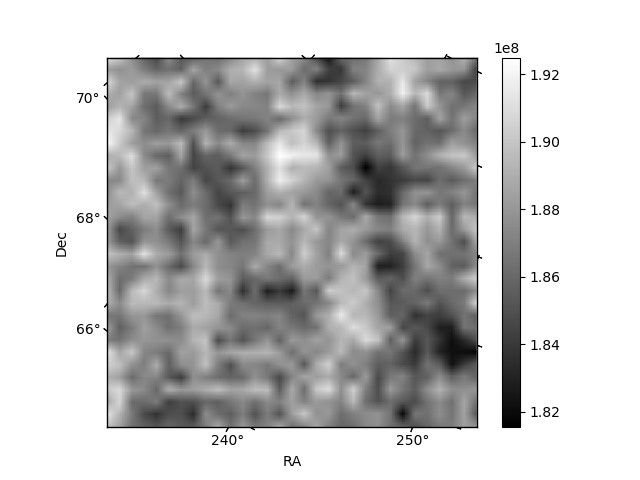
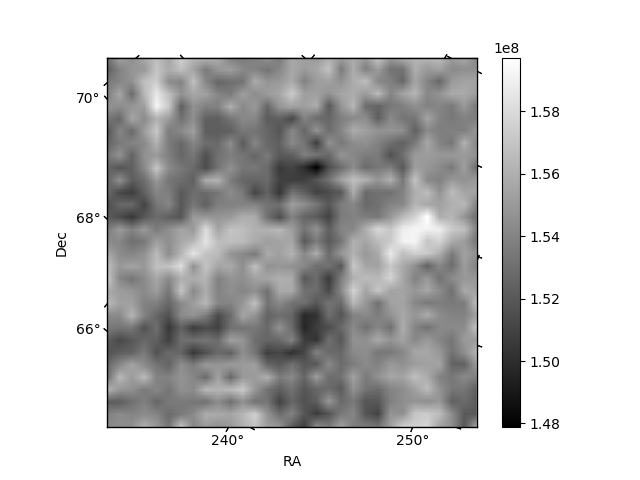
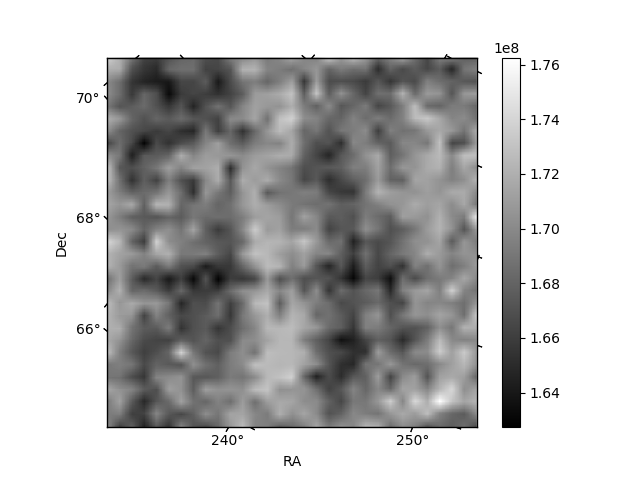
Histogram calculated using DETX and DETY for each event in the final _common_clean file
| Quadrant A |  |
 |
Quadrant B |
|---|---|---|---|
| Quadrant D |  |
 |
Quadrant C |
| Plot type | Count rate plots | Images |
|---|---|---|
| Comparison with Poisson distribution Blue bars denote a histogram of data divided into 1 sec bins. Red curve is a Poisson curve with rate = median count rate of data. |
 |
 |
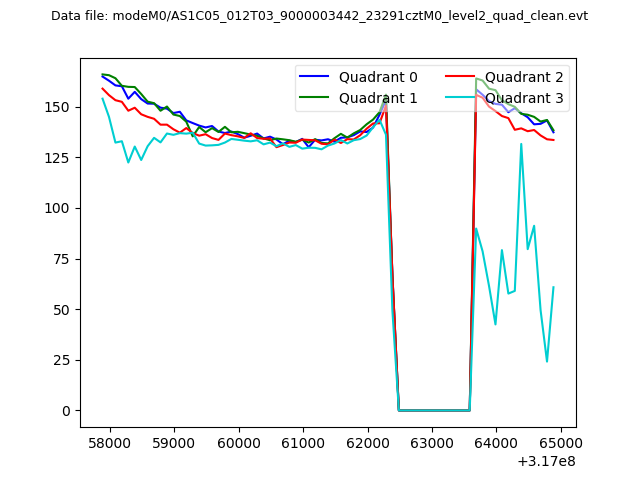
| Quadrant-wise count rates Data is divided into 100 sec bins |
 |
|
| Module-wise count rates for Quadrant A Data is divided into 100 sec bins |
 |
 |
| Module-wise count rates for Quadrant B Data is divided into 100 sec bins |
 |
 |
| Module-wise count rates for Quadrant C Data is divided into 100 sec bins |
 |
 |
| Module-wise count rates for Quadrant D Data is divided into 100 sec bins |
 |
 |
| Parameter | Plot |
|---|---|
| CZT HV Monitor |  |
| D_VDD |  |
| Temperature 1 |  |
| Veto HV Monitor |  |
| Veto LLD |  |
| Alpha Counter | 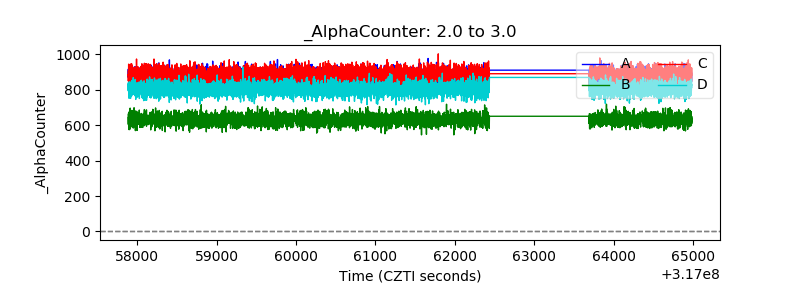 |
| _CPM_Rate | 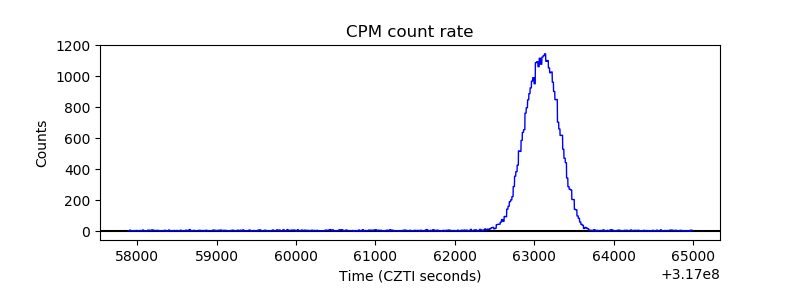 |
| CZT Counter |  |
| +2.5 Volts monitor |  |
| +5 Volts monitor |  |
| _ROLL_ROT |  |
| _Roll_DEC |  |
| _Roll_RA |  |
| Veto Counter |  |