| Param | Original file | Final file |
|---|---|---|
| Filename | modeM0/AS1C05_012T03_9000003442_23294cztM0_level2.evt | modeM0/AS1C05_012T03_9000003442_23294cztM0_level2_quad_clean.evt |
| Size (bytes) | 1,303,637,760 | 322,381,440 |
| Size | 1.2 GB | 307.4 MB |
| Events in quadrant A | 7,725,537 | 2,200,677 |
| Events in quadrant B | 8,155,093 | 2,224,036 |
| Events in quadrant C | 8,275,564 | 2,155,985 |
| Events in quadrant D | 14,170,326 | 2,006,356 |
| Mode M9 | |||
|---|---|---|---|
| Quadrant | BADHDUFLAG | Total packets | Discarded packets |
| A | 0 | 20 | 0 |
| B | 0 | 20 | 0 |
| C | 0 | 20 | 0 |
| D | 0 | 20 | 0 |
| Mode SS | |||
|---|---|---|---|
| Quadrant | BADHDUFLAG | Total packets | Discarded packets |
| A | 0 | 346 | 0 |
| B | 0 | 346 | 0 |
| C | 0 | 346 | 0 |
| D | 0 | 346 | 0 |
| Mode M0 | |||
|---|---|---|---|
| Quadrant | BADHDUFLAG | Total packets | Discarded packets |
| A | 0 | 34871 | 4 |
| B | 0 | 35803 | 3 |
| C | 0 | 35770 | 3 |
| D | 0 | 53959 | 3 |
| Quadrant | Total seconds | Saturated seconds | Saturation percentage |
|---|---|---|---|
| A | 17087 | 85 | 0.497454% |
| B | 17087 | 201 | 1.176333% |
| C | 17088 | 244 | 1.427903% |
| D | 17088 | 1617 | 9.462781% |
Noise dominated data is calculated using 1-second bins in cleaned event files. If a bin has >2000 counts, and if more than 50% of those come from <1% of pixels, then it is considered to be noise-dominated and hence unusable.
| Quadrant | # 1 sec bins | Bins with >0 counts | Bins with >2000 counts | High rate bins dominated by noise | Noise dominated (total time) | Noise dominated (detector-on time) | Marked lightcurve |
|---|---|---|---|---|---|---|---|
| A | 19007 | 17090 | 1 | 1 | 0.01% | 0.01% | 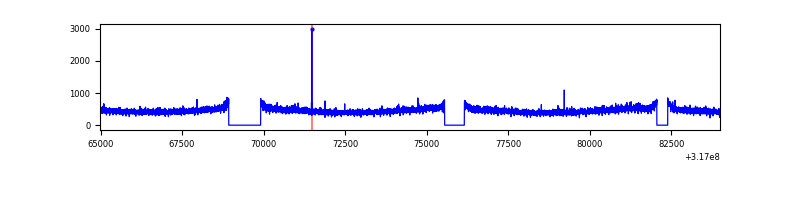 |
| B | 19007 | 17090 | 55 | 55 | 0.29% | 0.32% | 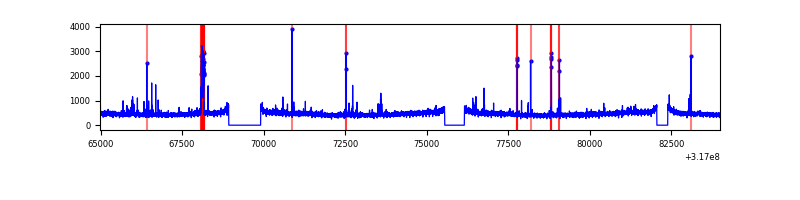 |
| C | 19008 | 17091 | 8 | 8 | 0.04% | 0.05% | 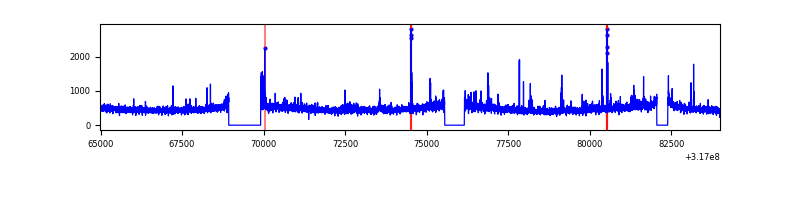 |
| D | 19008 | 17090 | 1366 | 1366 | 7.19% | 7.99% | 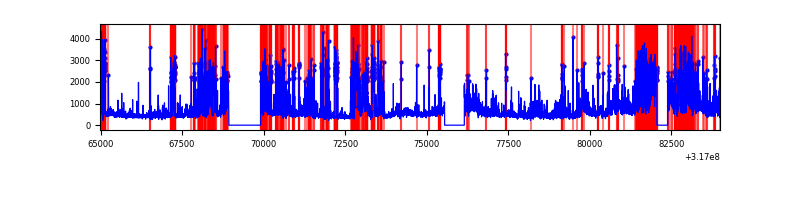 |
Top three noisy pixels from each quadrant. If the there are fewer than three noisy pixels in the level2.evt file, extra rows are filled as -1
| Pixel properties | Quadrant properties | ||||||
|---|---|---|---|---|---|---|---|
| Quadrant | DetID | PixID | Counts | Sigma | Mean | Median | Sigma |
| A | 13 | 254 | 26611 | 61.86 | 2003 | 1959 | 398.5 |
| A | 3 | 137 | 17688 | 39.47 | 2003 | 1959 | 398.5 |
| A | 0 | 226 | 17362 | 38.65 | 2003 | 1959 | 398.5 |
| B | 14 | 207 | 146660 | 388.07 | 1993 | 1942 | 372.9 |
| B | 0 | 229 | 104100 | 273.95 | 1993 | 1942 | 372.9 |
| B | 5 | 172 | 50742 | 130.86 | 1993 | 1942 | 372.9 |
| C | 14 | 238 | 307117 | 681.73 | 1941 | 1949 | 447.6 |
| C | 10 | 9 | 131739 | 289.94 | 1941 | 1949 | 447.6 |
| C | 0 | 239 | 124912 | 274.69 | 1941 | 1949 | 447.6 |
| D | 1 | 52 | 6495776 | 14295.18 | 1877 | 1820 | 454.3 |
| D | 7 | 238 | 252108 | 550.96 | 1877 | 1820 | 454.3 |
| D | 1 | 239 | 181487 | 395.5 | 1877 | 1820 | 454.3 |
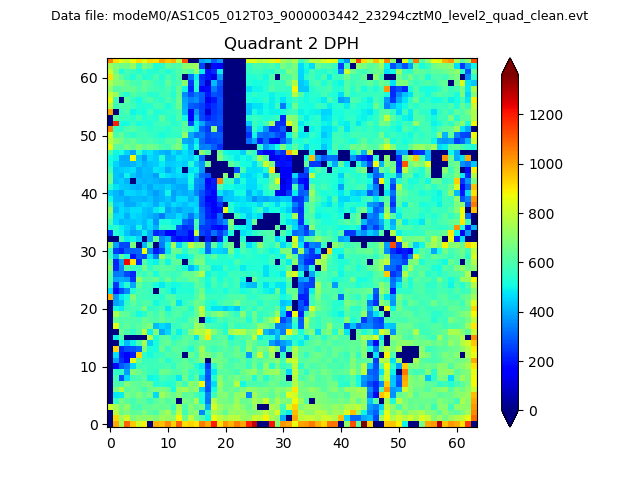
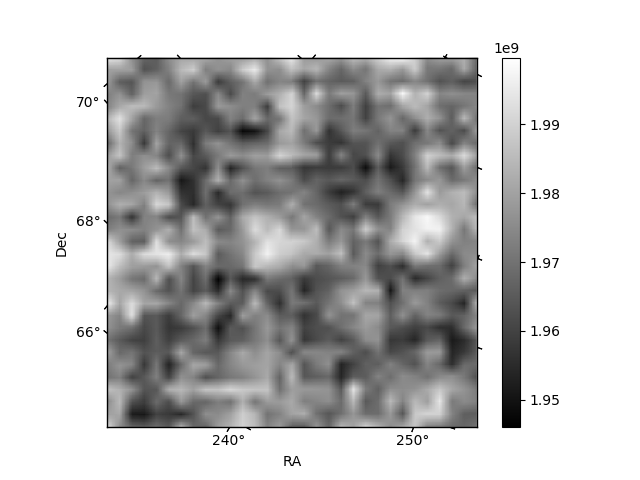
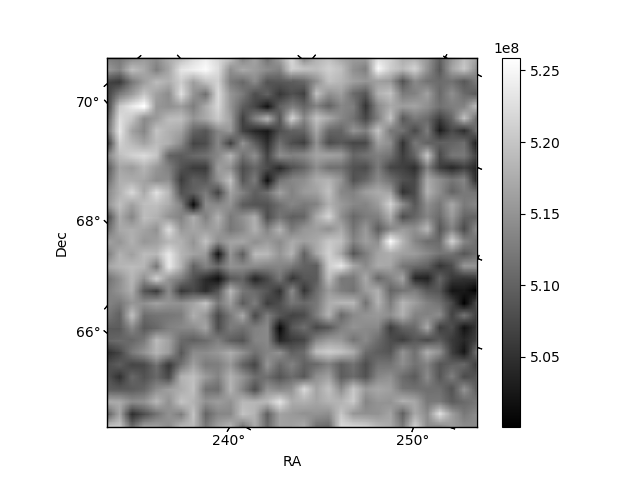
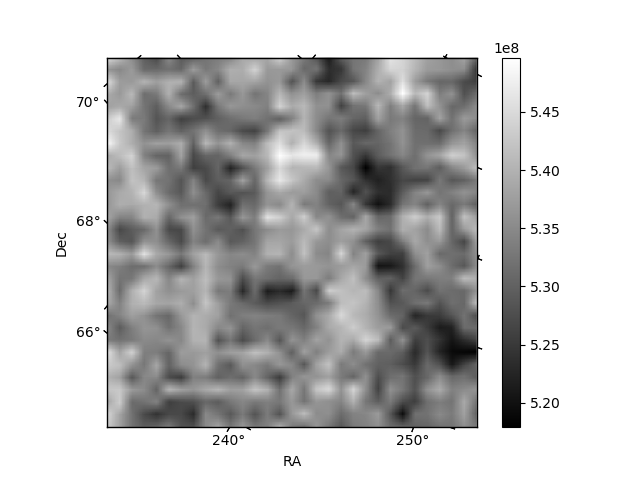
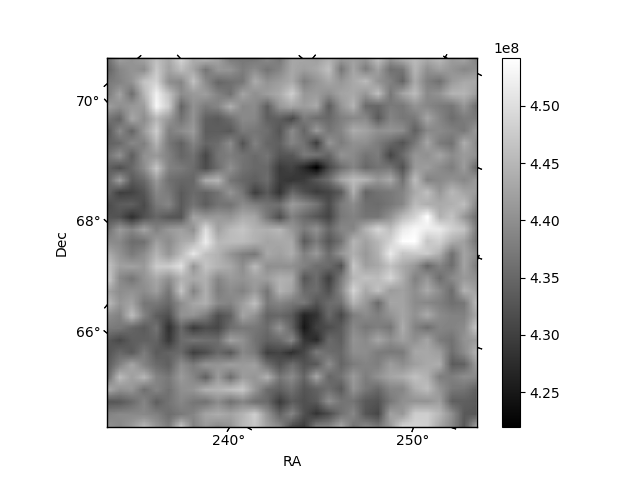
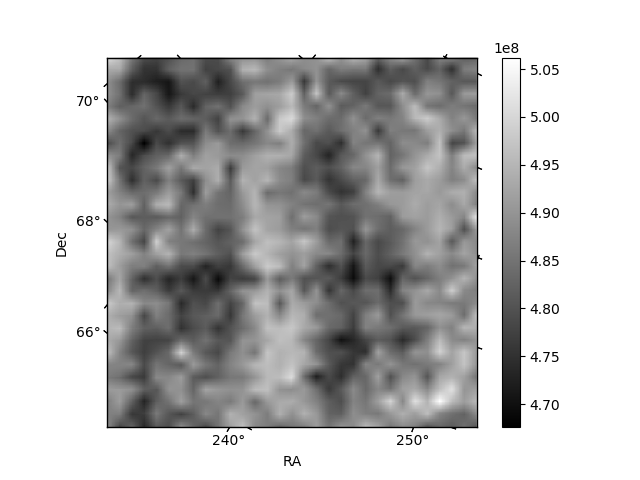
Histogram calculated using DETX and DETY for each event in the final _common_clean file
| Quadrant A | 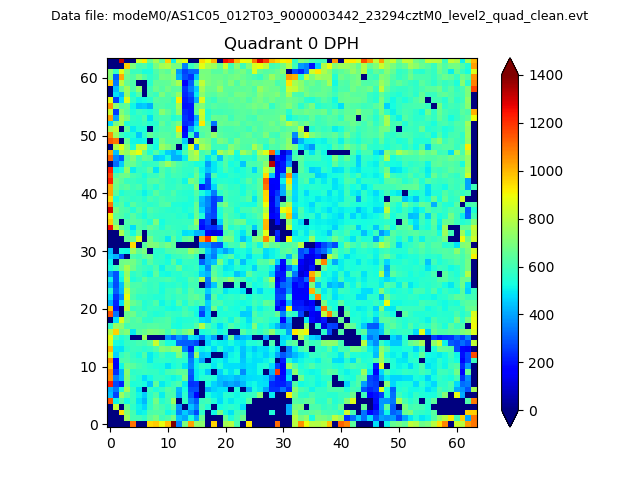 |
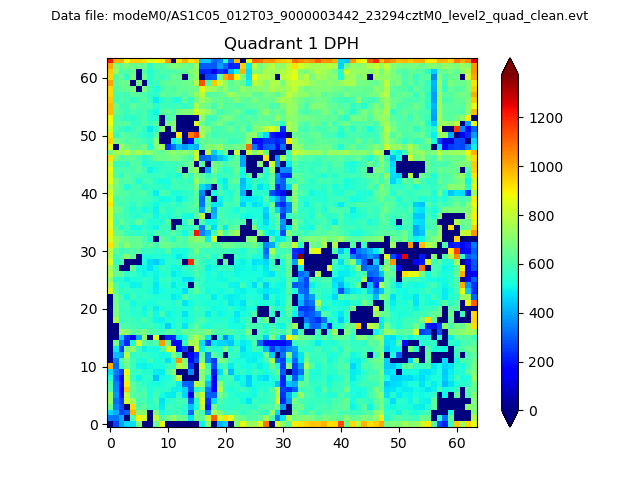 |
Quadrant B |
|---|---|---|---|
| Quadrant D | 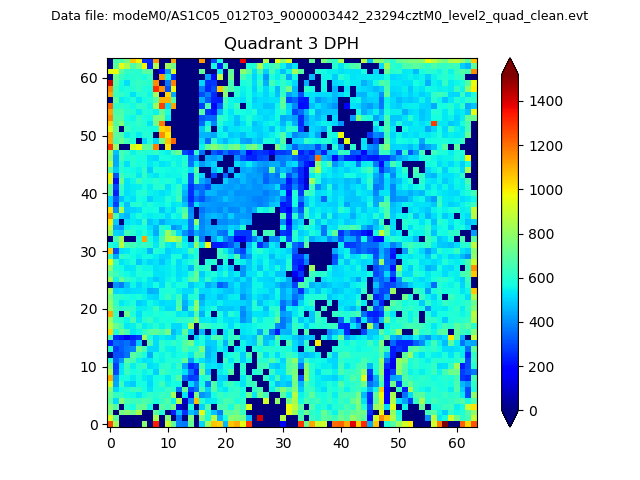 |
 |
Quadrant C |
| Plot type | Count rate plots | Images |
|---|---|---|
| Comparison with Poisson distribution Blue bars denote a histogram of data divided into 1 sec bins. Red curve is a Poisson curve with rate = median count rate of data. |
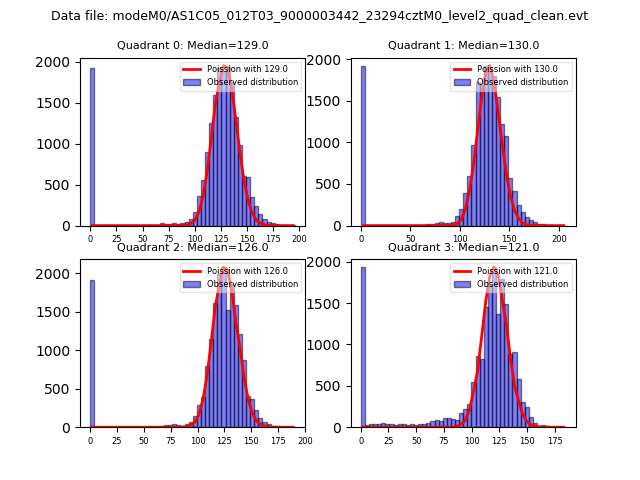 |
 |
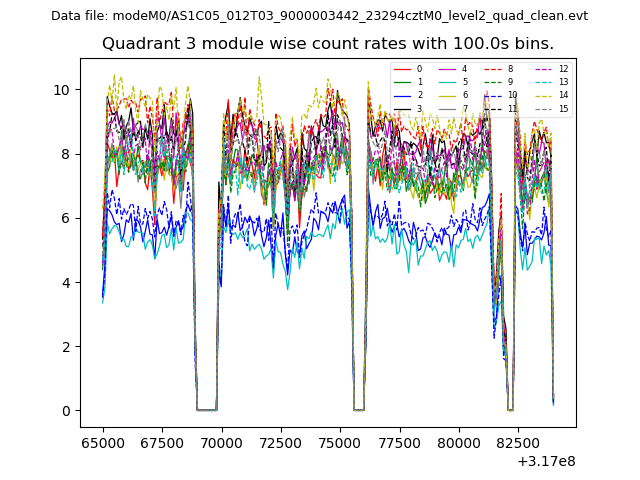
| Quadrant-wise count rates Data is divided into 100 sec bins |
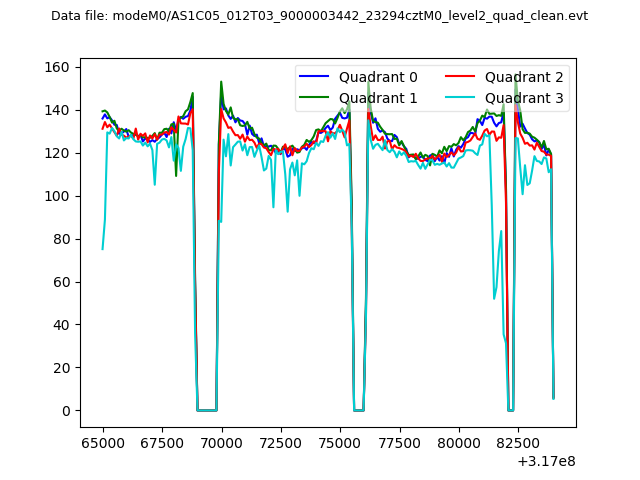 |
|
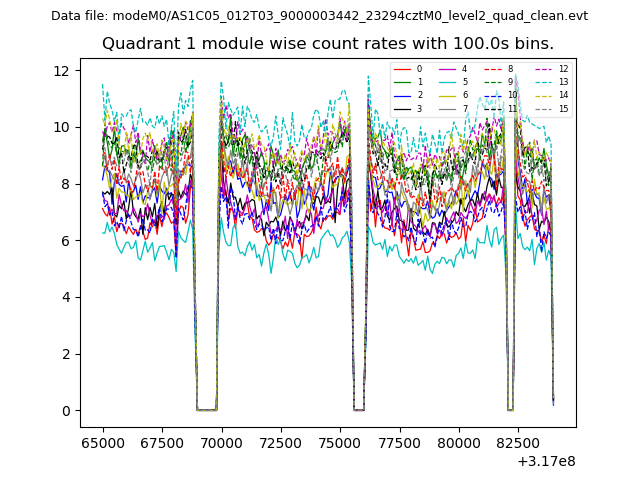
| Module-wise count rates for Quadrant A Data is divided into 100 sec bins |
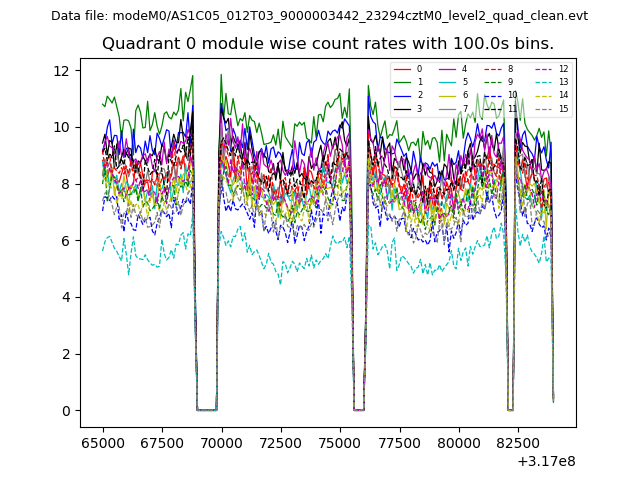 |
 |
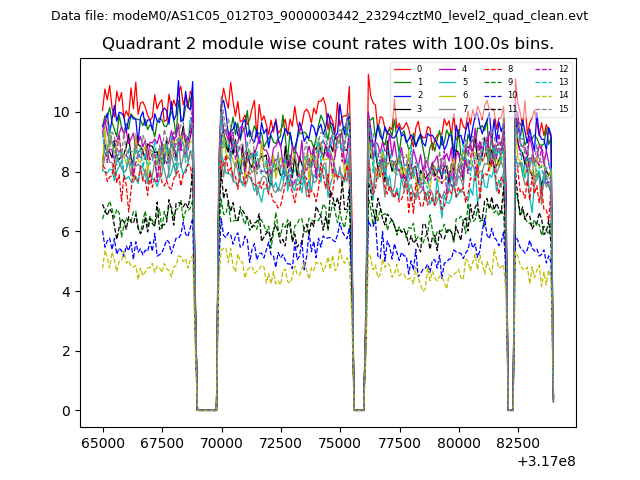
| Module-wise count rates for Quadrant B Data is divided into 100 sec bins |
 |
 |
| Module-wise count rates for Quadrant C Data is divided into 100 sec bins |
 |
 |
| Module-wise count rates for Quadrant D Data is divided into 100 sec bins |
 |
 |
| Parameter | Plot |
|---|---|
| CZT HV Monitor | 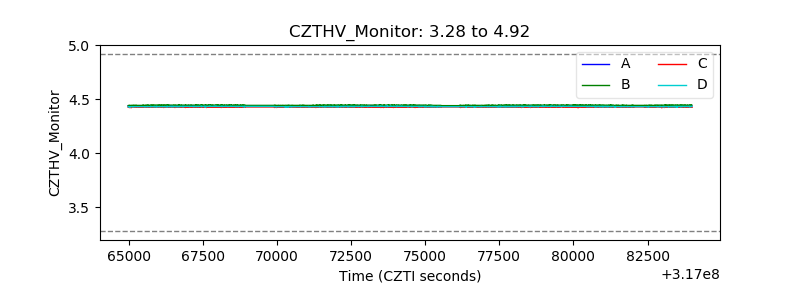 |
| D_VDD | 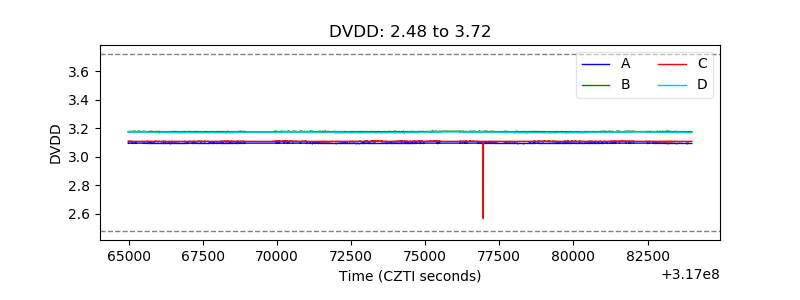 |
| Temperature 1 | 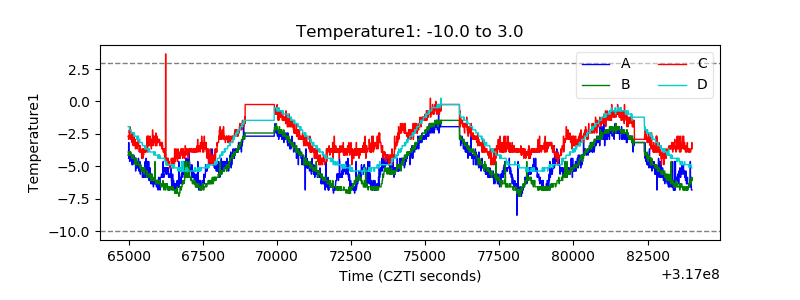 |
| Veto HV Monitor | 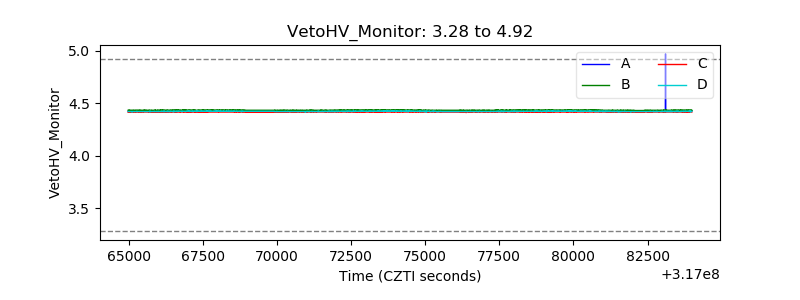 |
| Veto LLD |  |
| Alpha Counter | 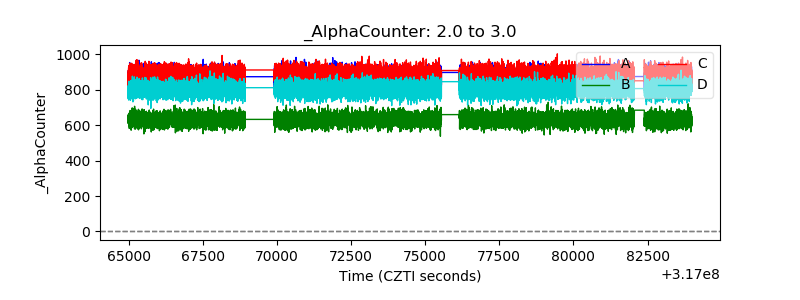 |
| _CPM_Rate | 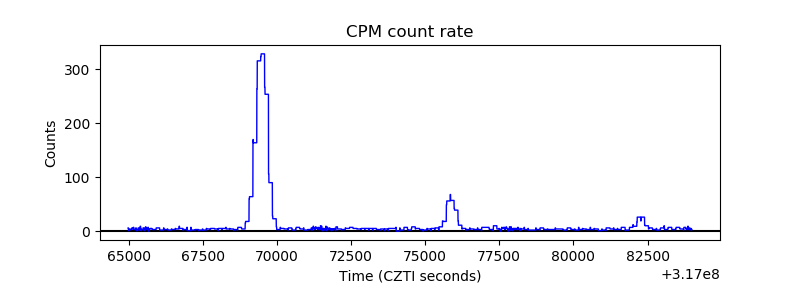 |
| CZT Counter | 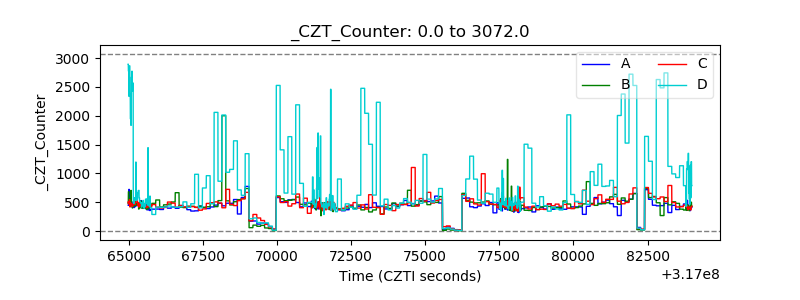 |
| +2.5 Volts monitor |  |
| +5 Volts monitor |  |
| _ROLL_ROT | 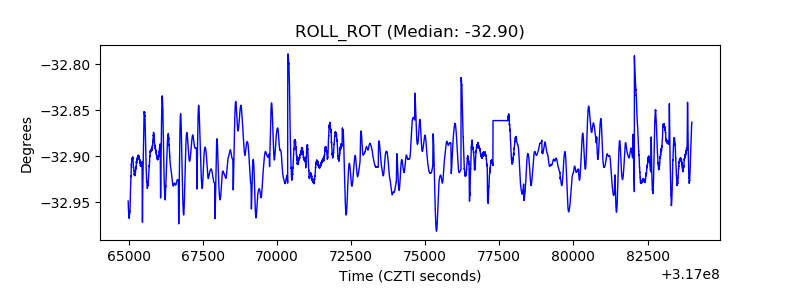 |
| _Roll_DEC | 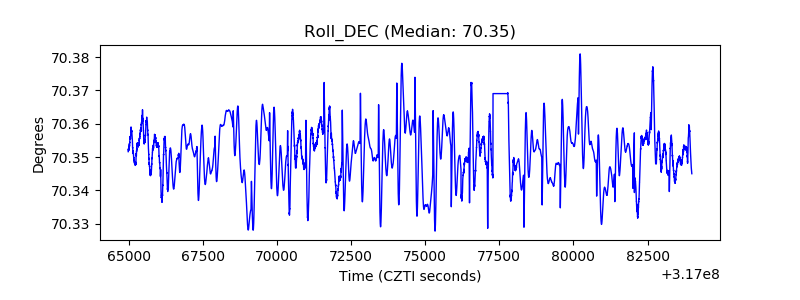 |
| _Roll_RA | 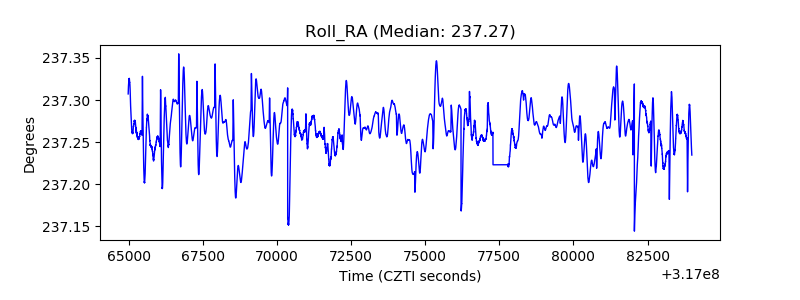 |
| Veto Counter | 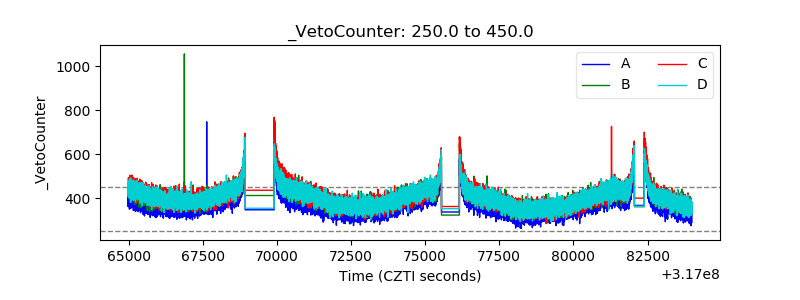 |