| Param | Original file | Final file |
|---|---|---|
| Filename | modeM0/AS1C05_012T03_9000003442_23295cztM0_level2.evt | modeM0/AS1C05_012T03_9000003442_23295cztM0_level2_quad_clean.evt |
| Size (bytes) | 605,666,880 | 144,057,600 |
| Size | 577.6 MB | 137.4 MB |
| Events in quadrant A | 3,550,898 | 980,005 |
| Events in quadrant B | 3,632,227 | 990,957 |
| Events in quadrant C | 3,972,740 | 953,013 |
| Events in quadrant D | 6,658,888 | 897,529 |
| Mode M9 | |||
|---|---|---|---|
| Quadrant | BADHDUFLAG | Total packets | Discarded packets |
| A | 0 | 8 | 0 |
| B | 0 | 8 | 0 |
| C | 0 | 8 | 0 |
| D | 0 | 8 | 0 |
| Mode SS | |||
|---|---|---|---|
| Quadrant | BADHDUFLAG | Total packets | Discarded packets |
| A | 0 | 160 | 0 |
| B | 0 | 160 | 0 |
| C | 0 | 160 | 0 |
| D | 0 | 160 | 0 |
| Mode M0 | |||
|---|---|---|---|
| Quadrant | BADHDUFLAG | Total packets | Discarded packets |
| A | 0 | 16039 | 30 |
| B | 0 | 16133 | 29 |
| C | 0 | 17128 | 24 |
| D | 0 | 25198 | 73 |
| Quadrant | Total seconds | Saturated seconds | Saturation percentage |
|---|---|---|---|
| A | 7786 | 31 | 0.398151% |
| B | 7787 | 64 | 0.821883% |
| C | 7790 | 137 | 1.758665% |
| D | 7786 | 652 | 8.374005% |
Noise dominated data is calculated using 1-second bins in cleaned event files. If a bin has >2000 counts, and if more than 50% of those come from <1% of pixels, then it is considered to be noise-dominated and hence unusable.
| Quadrant | # 1 sec bins | Bins with >0 counts | Bins with >2000 counts | High rate bins dominated by noise | Noise dominated (total time) | Noise dominated (detector-on time) | Marked lightcurve |
|---|---|---|---|---|---|---|---|
| A | 8614 | 7790 | 0 | 0 | 0.00% | 0.00% | 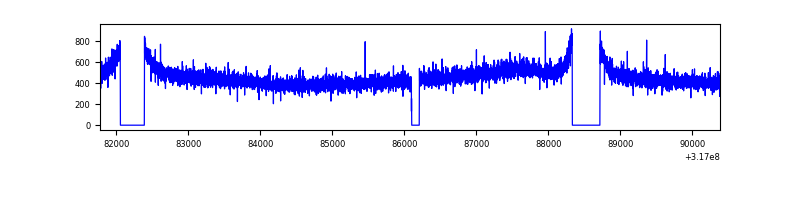 |
| B | 8615 | 7791 | 1 | 1 | 0.01% | 0.01% | 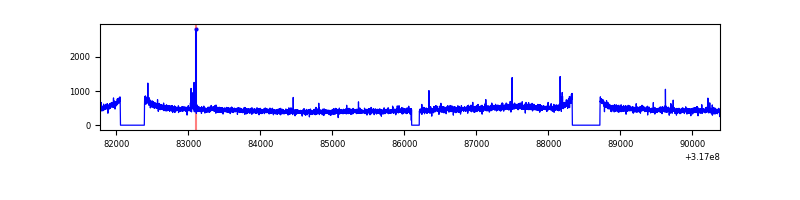 |
| C | 8615 | 7793 | 8 | 8 | 0.09% | 0.10% |  |
| D | 8614 | 7788 | 521 | 521 | 6.05% | 6.69% | 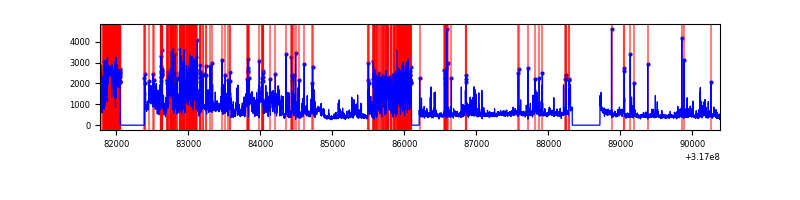 |
Top three noisy pixels from each quadrant. If the there are fewer than three noisy pixels in the level2.evt file, extra rows are filled as -1
| Pixel properties | Quadrant properties | ||||||
|---|---|---|---|---|---|---|---|
| Quadrant | DetID | PixID | Counts | Sigma | Mean | Median | Sigma |
| A | 13 | 254 | 12020 | 60.04 | 920 | 898 | 185.2 |
| A | 3 | 137 | 8397 | 40.48 | 920 | 898 | 185.2 |
| A | 0 | 226 | 7974 | 38.2 | 920 | 898 | 185.2 |
| B | 0 | 229 | 26827 | 147.63 | 918 | 892 | 175.7 |
| B | 12 | 111 | 21745 | 118.7 | 918 | 892 | 175.7 |
| B | 11 | 111 | 19093 | 103.61 | 918 | 892 | 175.7 |
| C | 10 | 9 | 224096 | 1078.0 | 892 | 897 | 207.0 |
| C | 14 | 238 | 140360 | 673.58 | 892 | 897 | 207.0 |
| C | 7 | 247 | 96309 | 460.82 | 892 | 897 | 207.0 |
| D | 1 | 52 | 3139840 | 15096.91 | 867 | 840 | 207.9 |
| D | 7 | 238 | 102149 | 487.24 | 867 | 840 | 207.9 |
| D | 2 | 136 | 65484 | 310.9 | 867 | 840 | 207.9 |
Histogram calculated using DETX and DETY for each event in the final _common_clean file
| Quadrant A |  |
 |
Quadrant B |
|---|---|---|---|
| Quadrant D |  |
 |
Quadrant C |
| Plot type | Count rate plots | Images |
|---|---|---|
| Comparison with Poisson distribution Blue bars denote a histogram of data divided into 1 sec bins. Red curve is a Poisson curve with rate = median count rate of data. |
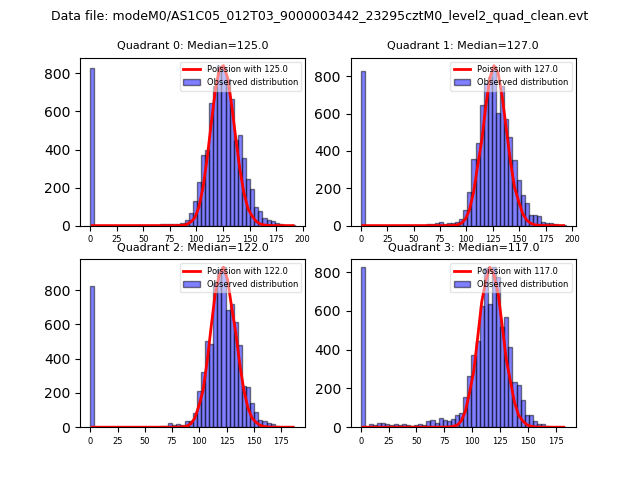 |
 |
| Quadrant-wise count rates Data is divided into 100 sec bins |
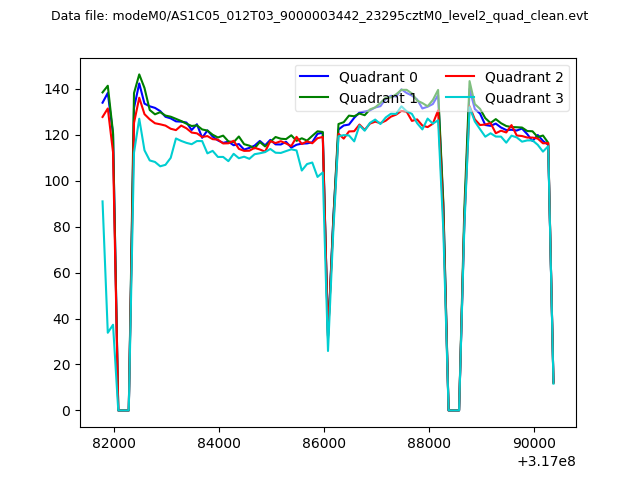 |
|
| Module-wise count rates for Quadrant A Data is divided into 100 sec bins |
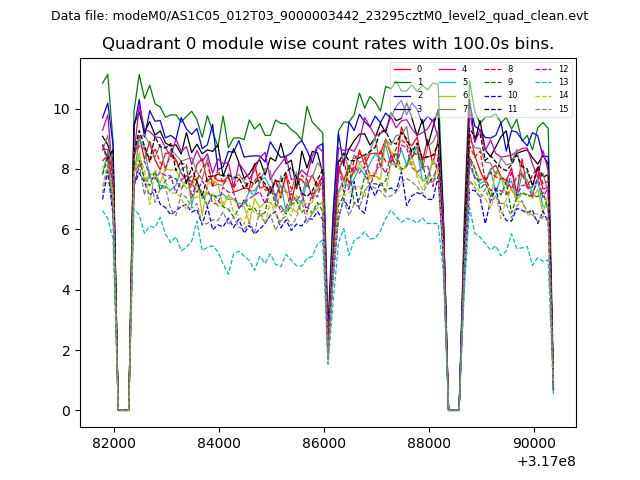 |
 |
| Module-wise count rates for Quadrant B Data is divided into 100 sec bins |
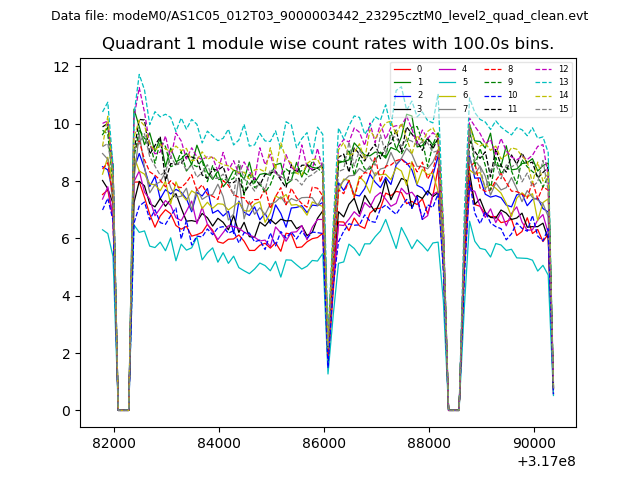 |
 |
| Module-wise count rates for Quadrant C Data is divided into 100 sec bins |
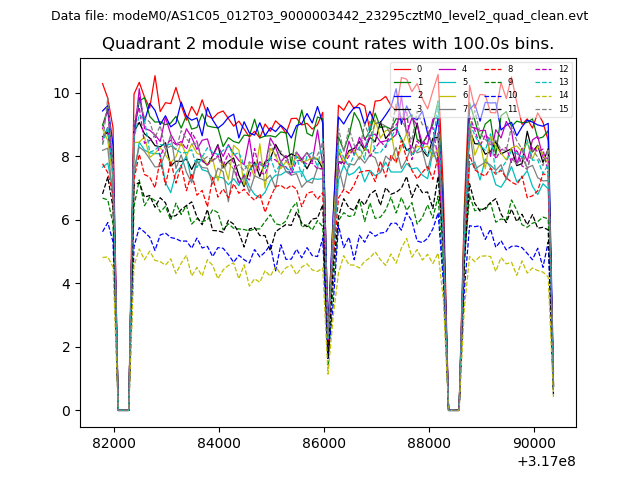 |
 |
| Module-wise count rates for Quadrant D Data is divided into 100 sec bins |
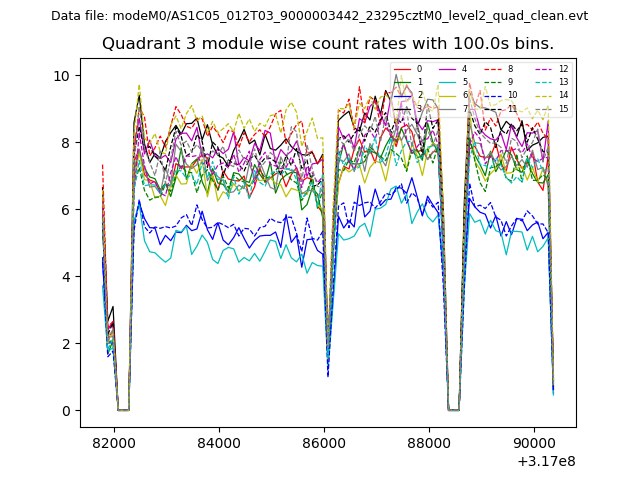 |
 |
| Parameter | Plot |
|---|---|
| CZT HV Monitor | 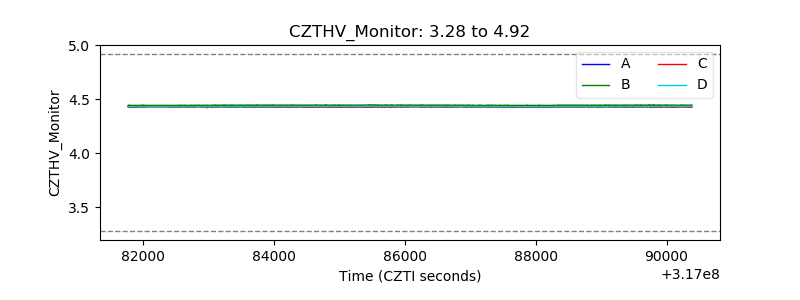 |
| D_VDD |  |
| Temperature 1 |  |
| Veto HV Monitor |  |
| Veto LLD |  |
| Alpha Counter | 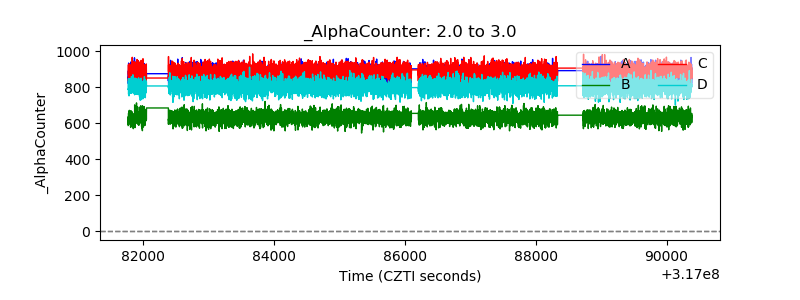 |
| _CPM_Rate | 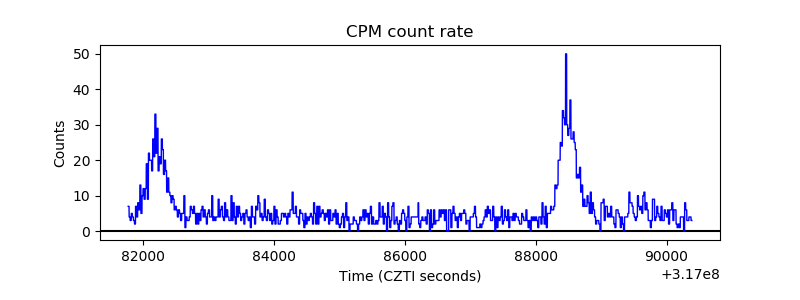 |
| CZT Counter |  |
| +2.5 Volts monitor |  |
| +5 Volts monitor |  |
| _ROLL_ROT |  |
| _Roll_DEC |  |
| _Roll_RA |  |
| Veto Counter | 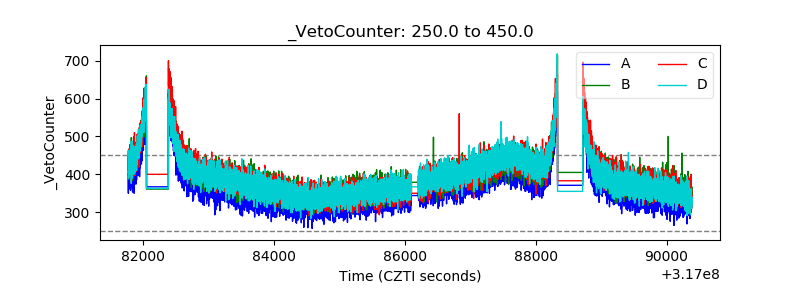 |