| Param | Original file | Final file |
|---|---|---|
| Filename | modeM0/AS1C05_012T03_9000003442_23298cztM0_level2.evt | modeM0/AS1C05_012T03_9000003442_23298cztM0_level2_quad_clean.evt |
| Size (bytes) | 2,072,013,120 | 531,676,800 |
| Size | 1.9 GB | 507.0 MB |
| Events in quadrant A | 13,027,477 | 3,602,723 |
| Events in quadrant B | 13,396,747 | 3,650,190 |
| Events in quadrant C | 14,082,547 | 3,508,597 |
| Events in quadrant D | 20,289,949 | 3,353,931 |
| Mode M9 | |||
|---|---|---|---|
| Quadrant | BADHDUFLAG | Total packets | Discarded packets |
| A | 0 | 28 | 0 |
| B | 0 | 28 | 0 |
| C | 0 | 28 | 0 |
| D | 0 | 28 | 0 |
| Mode SS | |||
|---|---|---|---|
| Quadrant | BADHDUFLAG | Total packets | Discarded packets |
| A | 0 | 586 | 0 |
| B | 0 | 586 | 0 |
| C | 0 | 586 | 0 |
| D | 0 | 586 | 0 |
| Mode M0 | |||
|---|---|---|---|
| Quadrant | BADHDUFLAG | Total packets | Discarded packets |
| A | 0 | 58901 | 5 |
| B | 0 | 59514 | 5 |
| C | 0 | 61391 | 5 |
| D | 0 | 80595 | 5 |
| Quadrant | Total seconds | Saturated seconds | Saturation percentage |
|---|---|---|---|
| A | 28956 | 101 | 0.348805% |
| B | 28956 | 205 | 0.707971% |
| C | 28956 | 370 | 1.277801% |
| D | 28956 | 1495 | 5.163006% |
Noise dominated data is calculated using 1-second bins in cleaned event files. If a bin has >2000 counts, and if more than 50% of those come from <1% of pixels, then it is considered to be noise-dominated and hence unusable.
| Quadrant | # 1 sec bins | Bins with >0 counts | Bins with >2000 counts | High rate bins dominated by noise | Noise dominated (total time) | Noise dominated (detector-on time) | Marked lightcurve |
|---|---|---|---|---|---|---|---|
| A | 31661 | 28960 | 0 | 0 | 0.00% | 0.00% | 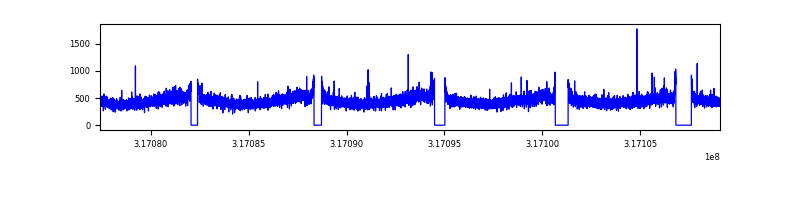 |
| B | 31661 | 28960 | 21 | 21 | 0.07% | 0.07% | 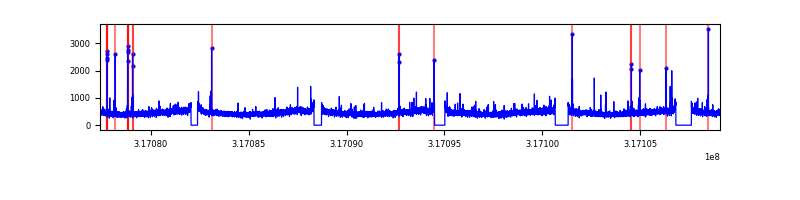 |
| C | 31661 | 28961 | 31 | 31 | 0.10% | 0.11% | 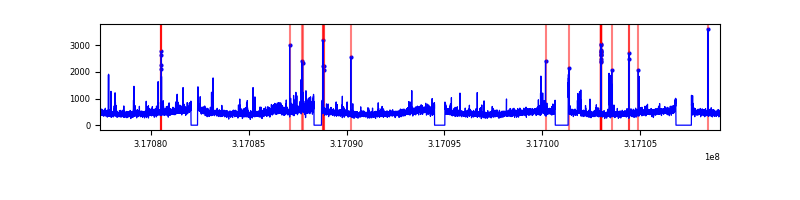 |
| D | 31661 | 28959 | 1219 | 1219 | 3.85% | 4.21% | 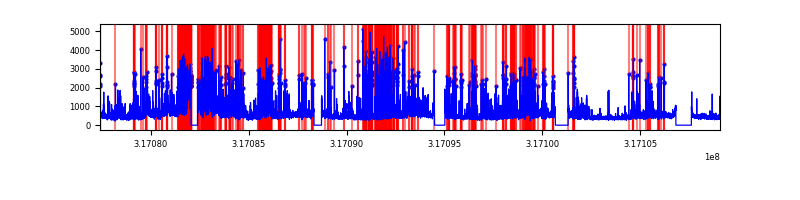 |
Top three noisy pixels from each quadrant. If the there are fewer than three noisy pixels in the level2.evt file, extra rows are filled as -1
| Pixel properties | Quadrant properties | ||||||
|---|---|---|---|---|---|---|---|
| Quadrant | DetID | PixID | Counts | Sigma | Mean | Median | Sigma |
| A | 13 | 254 | 42986 | 58.78 | 3378 | 3297 | 675.2 |
| A | 3 | 137 | 30389 | 40.13 | 3378 | 3297 | 675.2 |
| A | 0 | 226 | 29157 | 38.3 | 3378 | 3297 | 675.2 |
| B | 0 | 229 | 84388 | 126.93 | 3363 | 3273 | 639.1 |
| B | 12 | 111 | 78742 | 118.09 | 3363 | 3273 | 639.1 |
| B | 11 | 111 | 70195 | 104.72 | 3363 | 3273 | 639.1 |
| C | 10 | 9 | 572684 | 758.54 | 3239 | 3252 | 750.7 |
| C | 14 | 238 | 514636 | 681.22 | 3239 | 3252 | 750.7 |
| C | 7 | 247 | 255794 | 336.41 | 3239 | 3252 | 750.7 |
| D | 1 | 52 | 7154395 | 9336.28 | 3205 | 3110 | 766.0 |
| D | 7 | 238 | 417993 | 541.65 | 3205 | 3110 | 766.0 |
| D | 12 | 218 | 127871 | 162.88 | 3205 | 3110 | 766.0 |
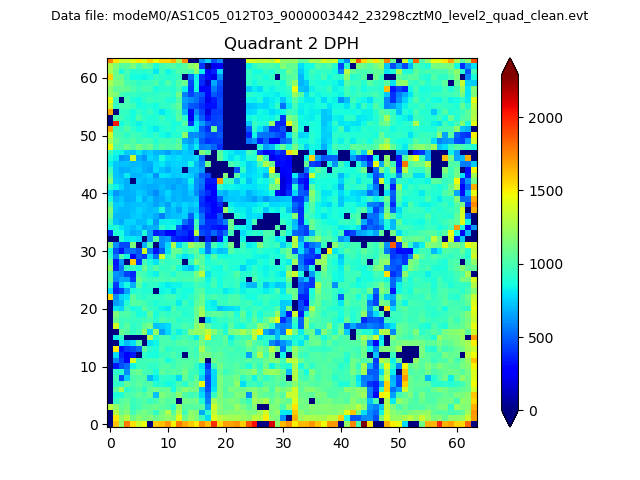
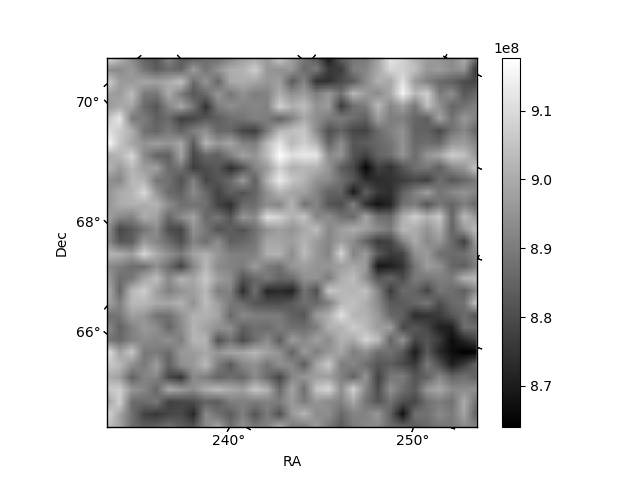
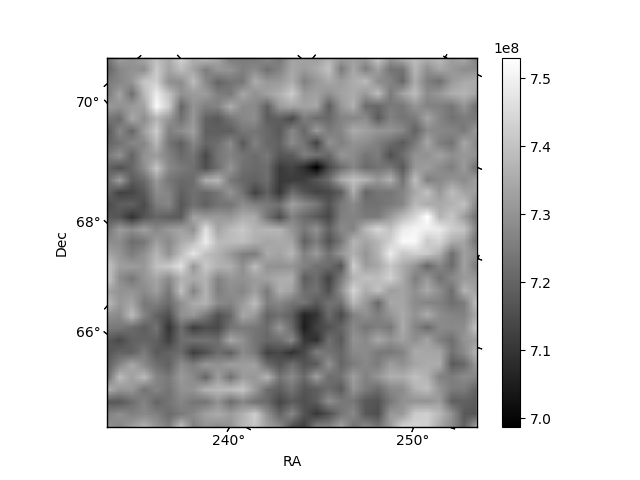
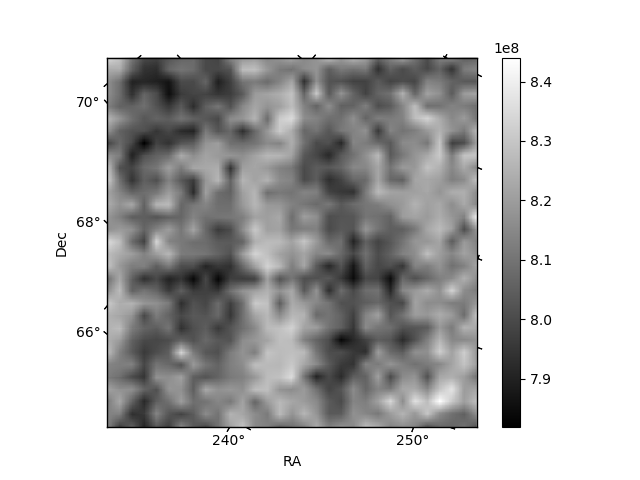
Histogram calculated using DETX and DETY for each event in the final _common_clean file
| Quadrant A |  |
 |
Quadrant B |
|---|---|---|---|
| Quadrant D | 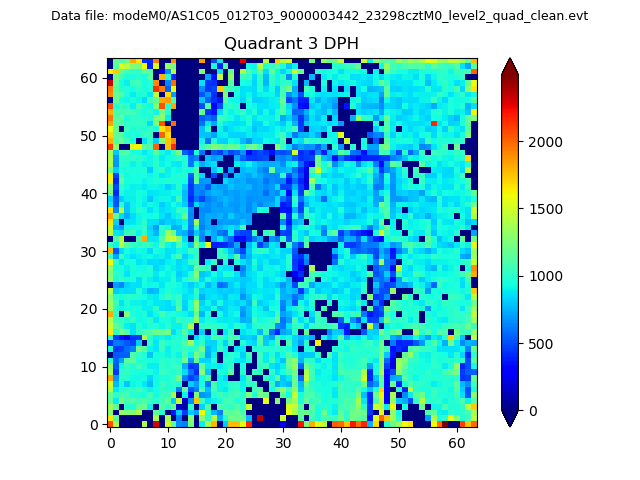 |
 |
Quadrant C |
| Plot type | Count rate plots | Images |
|---|---|---|
| Comparison with Poisson distribution Blue bars denote a histogram of data divided into 1 sec bins. Red curve is a Poisson curve with rate = median count rate of data. |
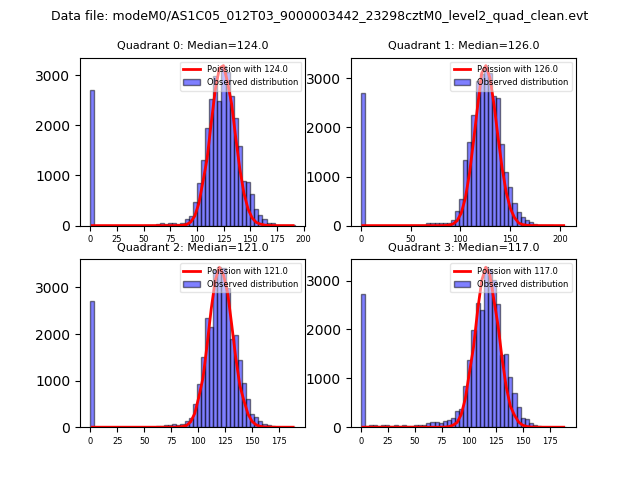 |
 |
| Quadrant-wise count rates Data is divided into 100 sec bins |
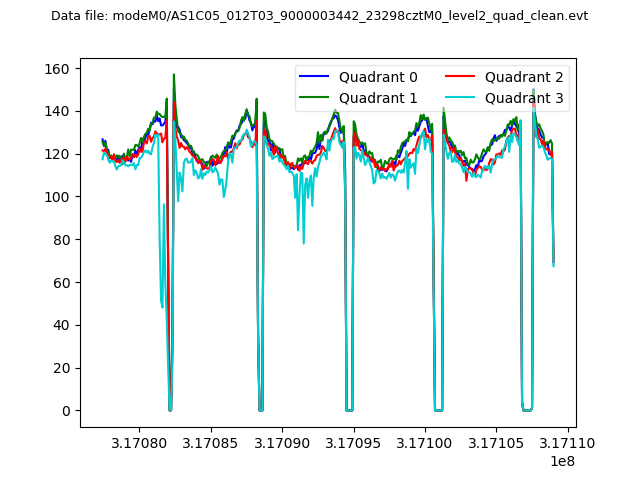 |
|
| Module-wise count rates for Quadrant A Data is divided into 100 sec bins |
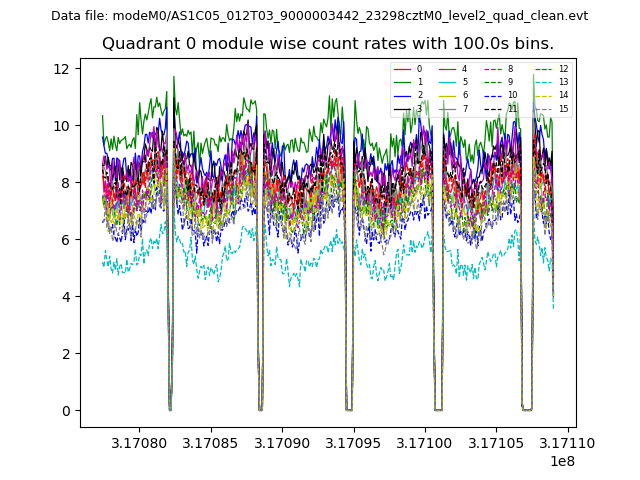 |
 |
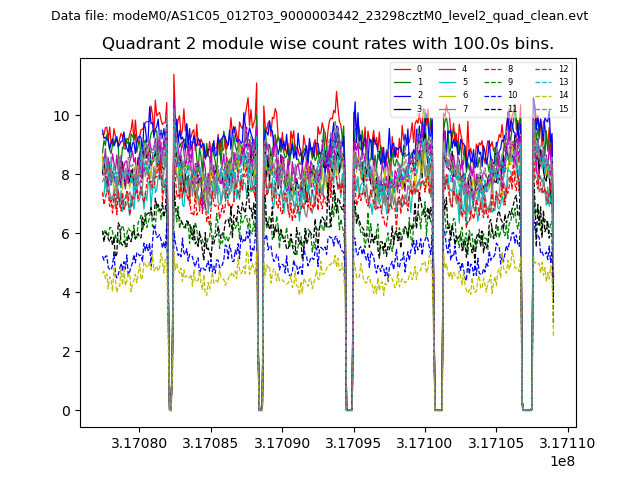
| Module-wise count rates for Quadrant B Data is divided into 100 sec bins |
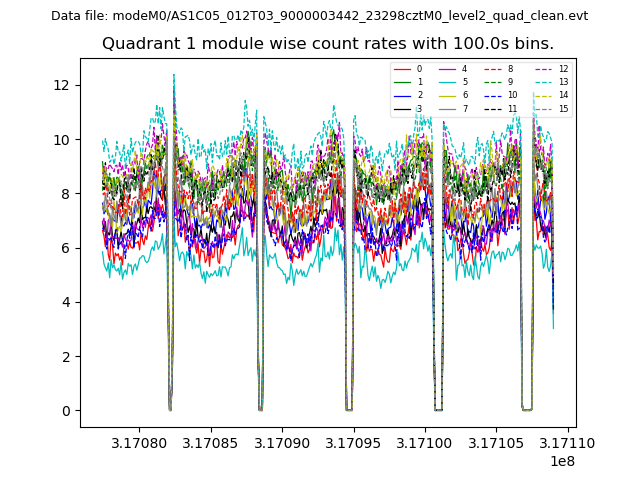 |
 |
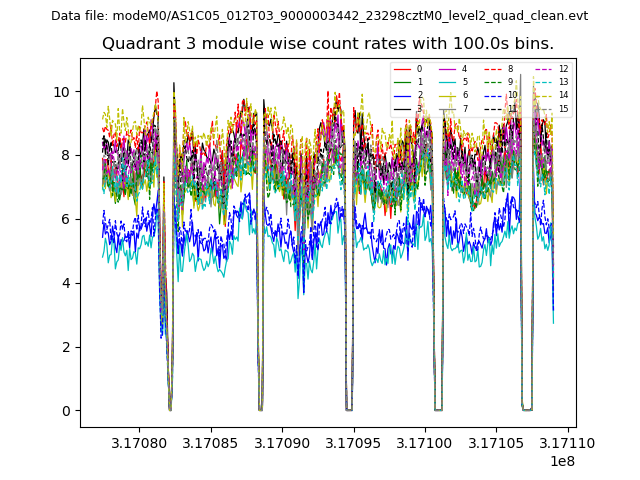
| Module-wise count rates for Quadrant C Data is divided into 100 sec bins |
 |
 |
| Module-wise count rates for Quadrant D Data is divided into 100 sec bins |
 |
 |
| Parameter | Plot |
|---|---|
| CZT HV Monitor | 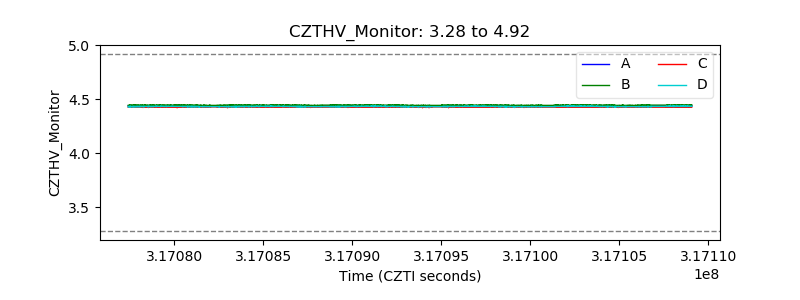 |
| D_VDD | 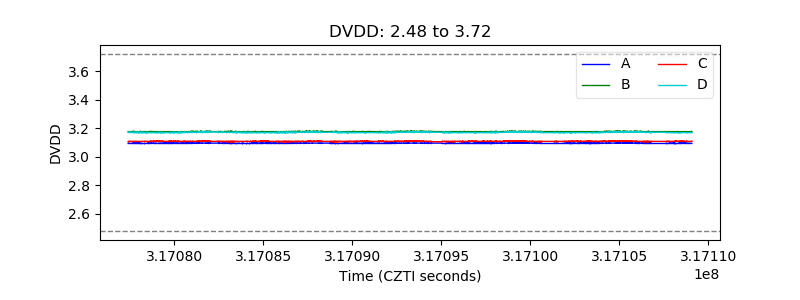 |
| Temperature 1 | 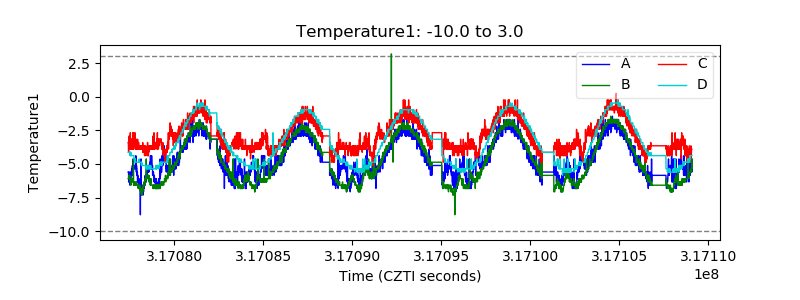 |
| Veto HV Monitor | 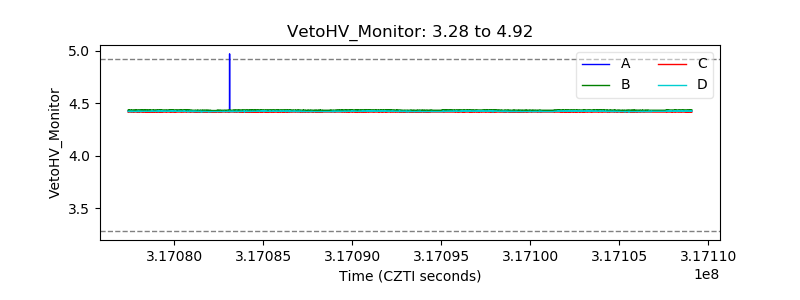 |
| Veto LLD | 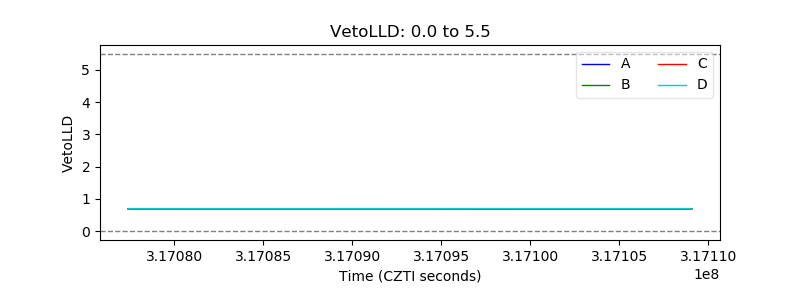 |
| Alpha Counter | 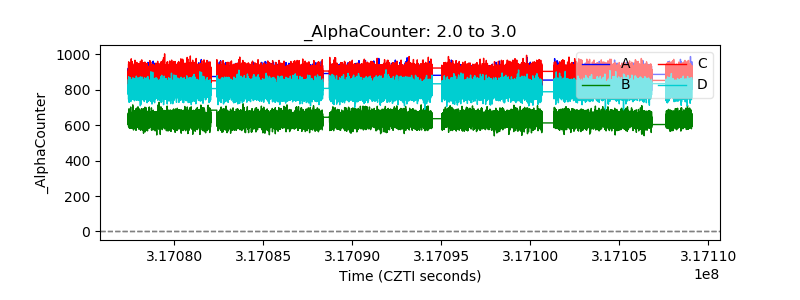 |
| _CPM_Rate | 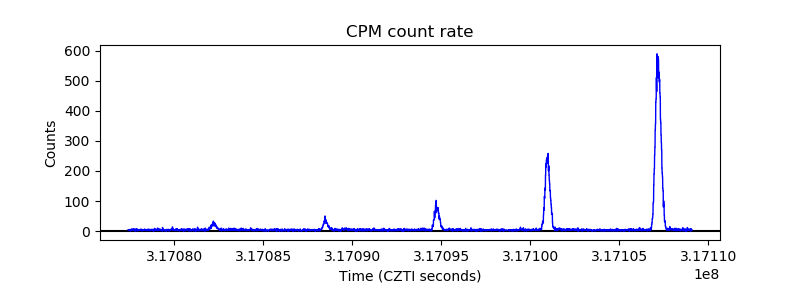 |
| CZT Counter | 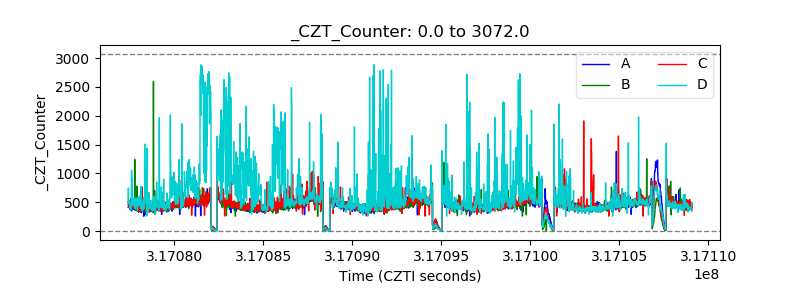 |
| +2.5 Volts monitor |  |
| +5 Volts monitor | 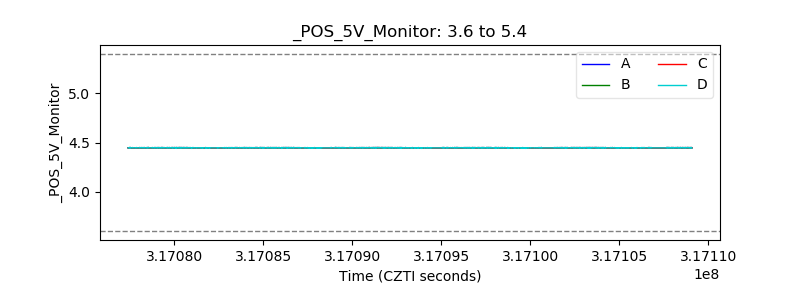 |
| _ROLL_ROT | 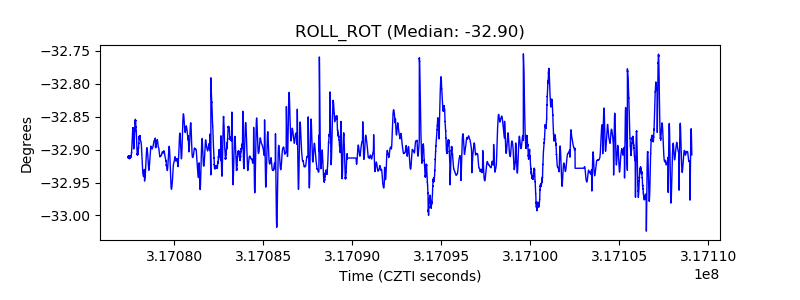 |
| _Roll_DEC | 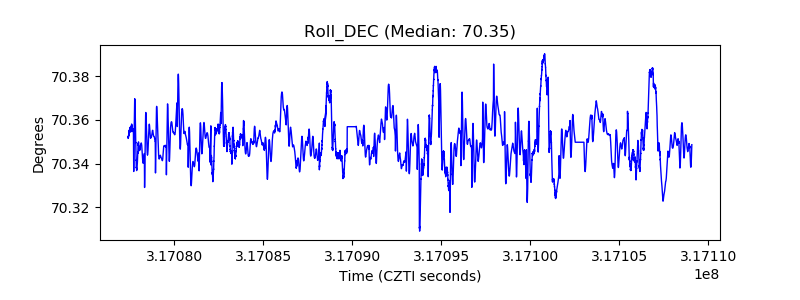 |
| _Roll_RA | 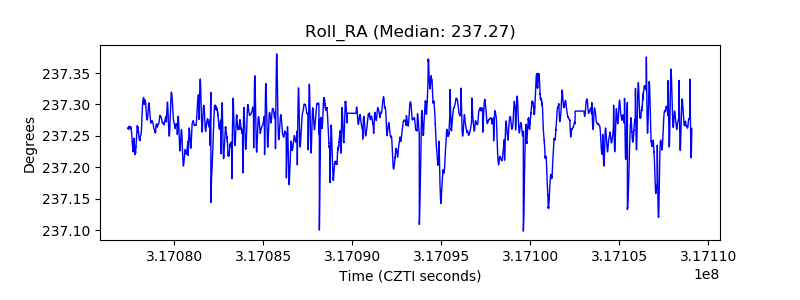 |
| Veto Counter | 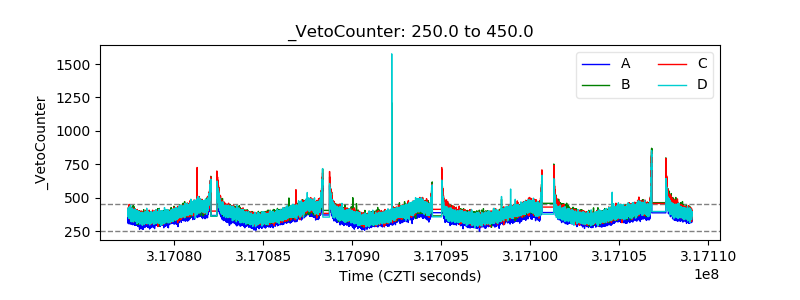 |