| Param | Original file | Final file |
|---|---|---|
| Filename | modeM0/AS1C05_012T03_9000003442_23301cztM0_level2.evt | modeM0/AS1C05_012T03_9000003442_23301cztM0_level2_quad_clean.evt |
| Size (bytes) | 86,791,680 | 26,760,960 |
| Size | 82.8 MB | 25.5 MB |
| Events in quadrant A | 618,622 | 175,381 |
| Events in quadrant B | 647,341 | 180,985 |
| Events in quadrant C | 621,644 | 174,699 |
| Events in quadrant D | 637,399 | 169,540 |
| Mode SS | |||
|---|---|---|---|
| Quadrant | BADHDUFLAG | Total packets | Discarded packets |
| A | 0 | 30 | 0 |
| B | 0 | 30 | 0 |
| C | 0 | 30 | 0 |
| D | 0 | 30 | 0 |
| Mode M0 | |||
|---|---|---|---|
| Quadrant | BADHDUFLAG | Total packets | Discarded packets |
| A | 0 | 2947 | 0 |
| B | 0 | 2990 | 0 |
| C | 0 | 2961 | 0 |
| D | 0 | 3073 | 0 |
| Quadrant | Total seconds | Saturated seconds | Saturation percentage |
|---|---|---|---|
| A | 1472 | 3 | 0.203804% |
| B | 1472 | 3 | 0.203804% |
| C | 1472 | 3 | 0.203804% |
| D | 1473 | 7 | 0.475221% |
Noise dominated data is calculated using 1-second bins in cleaned event files. If a bin has >2000 counts, and if more than 50% of those come from <1% of pixels, then it is considered to be noise-dominated and hence unusable.
| Quadrant | # 1 sec bins | Bins with >0 counts | Bins with >2000 counts | High rate bins dominated by noise | Noise dominated (total time) | Noise dominated (detector-on time) | Marked lightcurve |
|---|---|---|---|---|---|---|---|
| A | 1472 | 1472 | 0 | 0 | 0.00% | 0.00% | 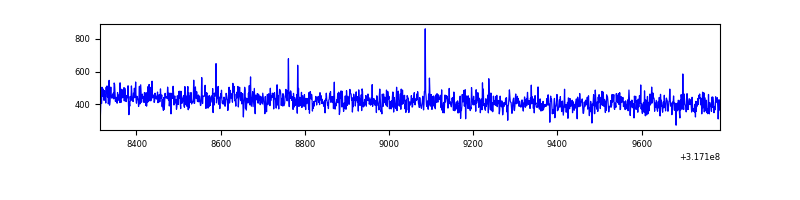 |
| B | 1472 | 1472 | 1 | 1 | 0.07% | 0.07% | 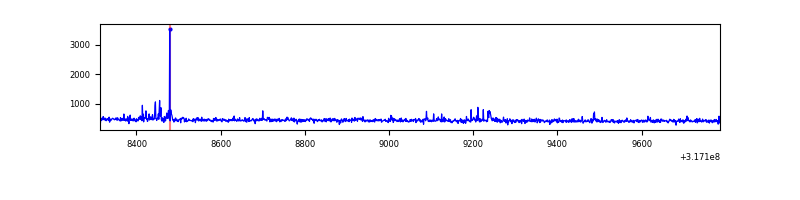 |
| C | 1472 | 1472 | 1 | 1 | 0.07% | 0.07% | 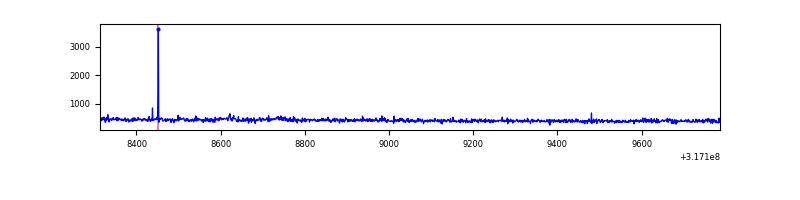 |
| D | 1473 | 1473 | 6 | 6 | 0.41% | 0.41% | 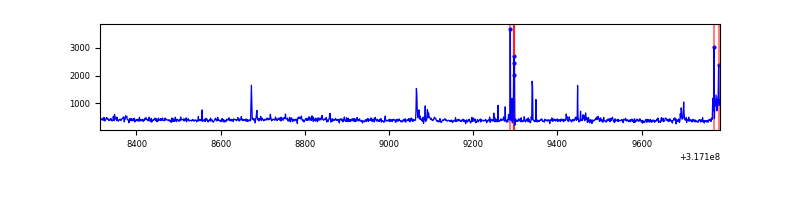 |
Top three noisy pixels from each quadrant. If the there are fewer than three noisy pixels in the level2.evt file, extra rows are filled as -1
| Pixel properties | Quadrant properties | ||||||
|---|---|---|---|---|---|---|---|
| Quadrant | DetID | PixID | Counts | Sigma | Mean | Median | Sigma |
| A | 13 | 254 | 2221 | 60.11 | 160 | 157 | 34.3 |
| A | 3 | 137 | 1461 | 37.98 | 160 | 157 | 34.3 |
| A | 0 | 226 | 1371 | 35.36 | 160 | 157 | 34.3 |
| B | 4 | 173 | 20052 | 607.25 | 159 | 154 | 32.8 |
| B | 12 | 111 | 3790 | 110.96 | 159 | 154 | 32.8 |
| B | 11 | 111 | 3291 | 95.74 | 159 | 154 | 32.8 |
| C | 14 | 238 | 24540 | 661.26 | 149 | 149 | 36.9 |
| C | 10 | 9 | 6796 | 180.21 | 149 | 149 | 36.9 |
| C | 7 | 247 | 6536 | 173.16 | 149 | 149 | 36.9 |
| D | 1 | 52 | 48865 | 1271.3 | 152 | 147 | 38.3 |
| D | 7 | 238 | 15948 | 412.33 | 152 | 147 | 38.3 |
| D | 2 | 234 | 3829 | 96.08 | 152 | 147 | 38.3 |
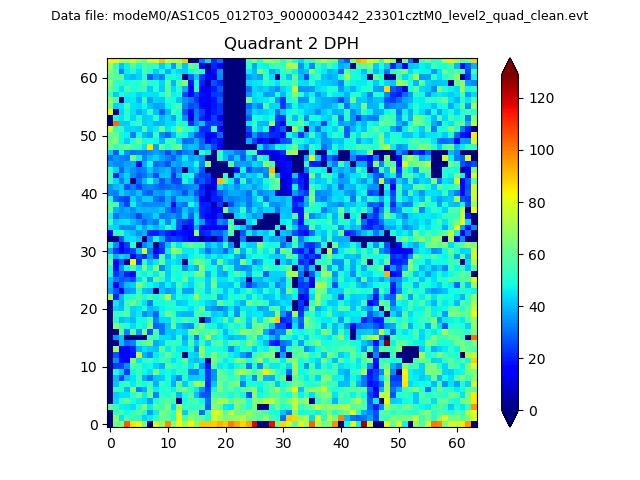
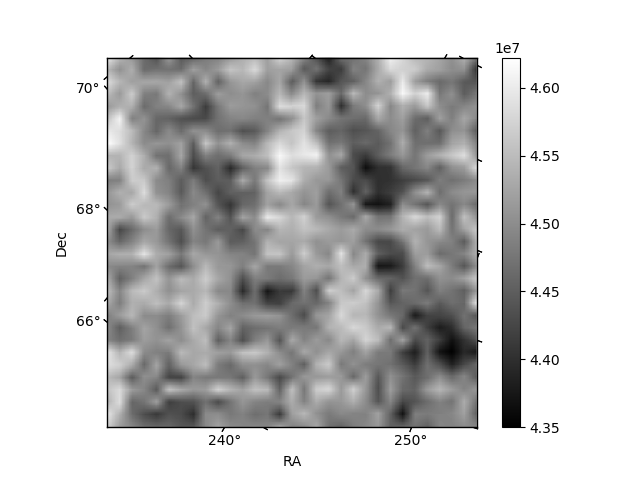
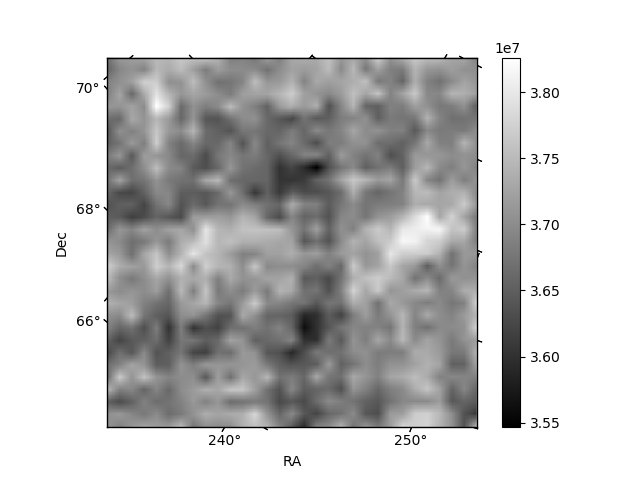
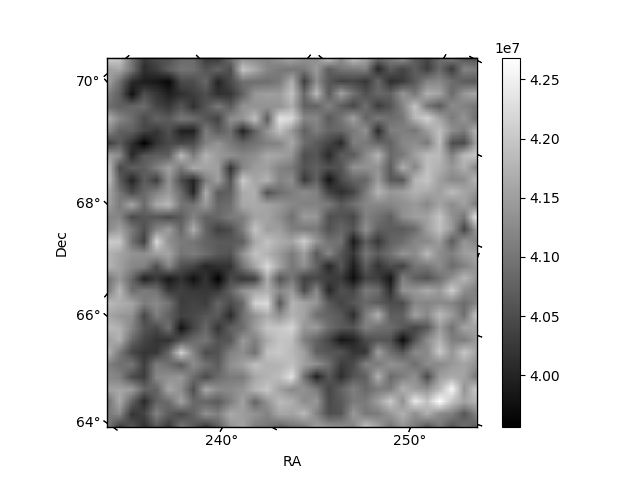
Histogram calculated using DETX and DETY for each event in the final _common_clean file
| Quadrant A | 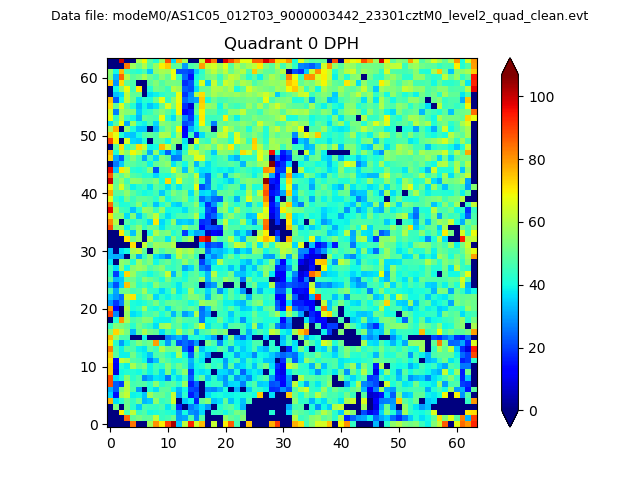 |
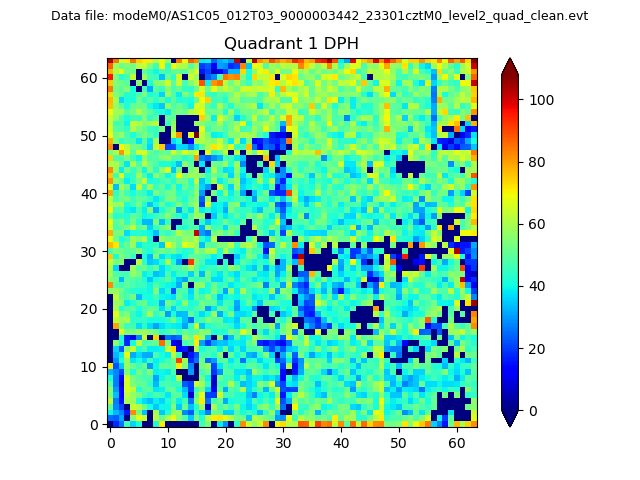 |
Quadrant B |
|---|---|---|---|
| Quadrant D | 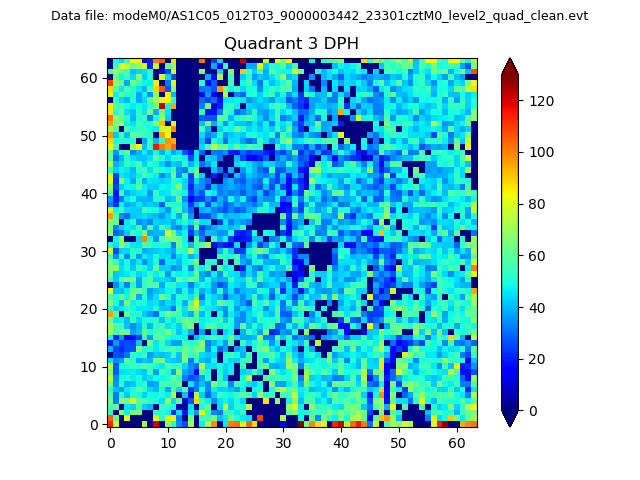 |
 |
Quadrant C |
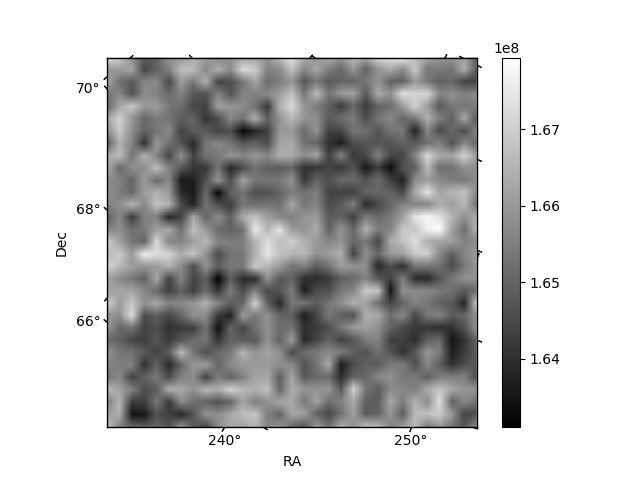
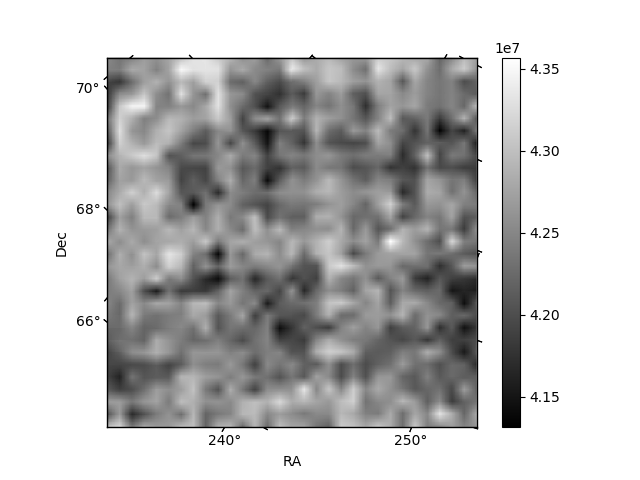
| Plot type | Count rate plots | Images |
|---|---|---|
| Comparison with Poisson distribution Blue bars denote a histogram of data divided into 1 sec bins. Red curve is a Poisson curve with rate = median count rate of data. |
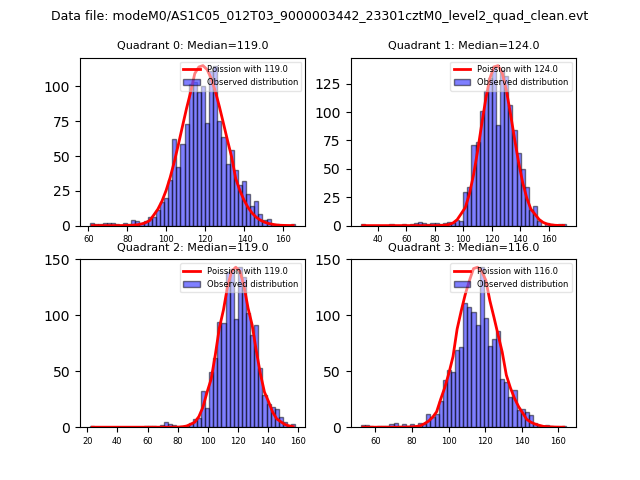 |
 |
| Quadrant-wise count rates Data is divided into 100 sec bins |
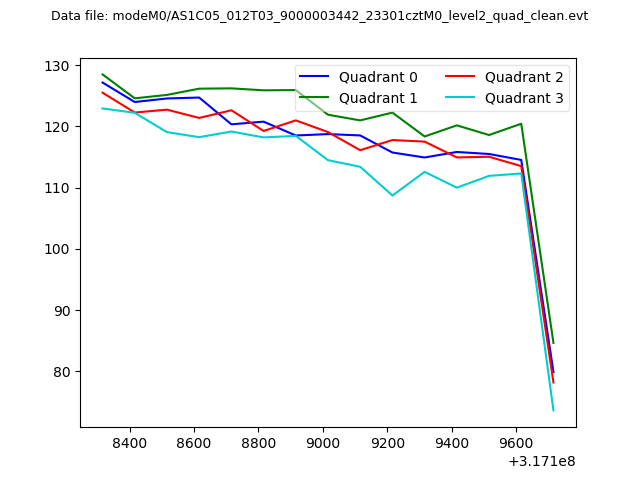 |
|
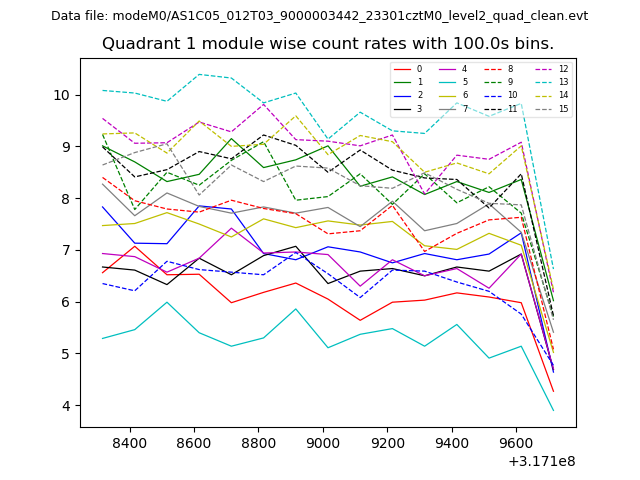
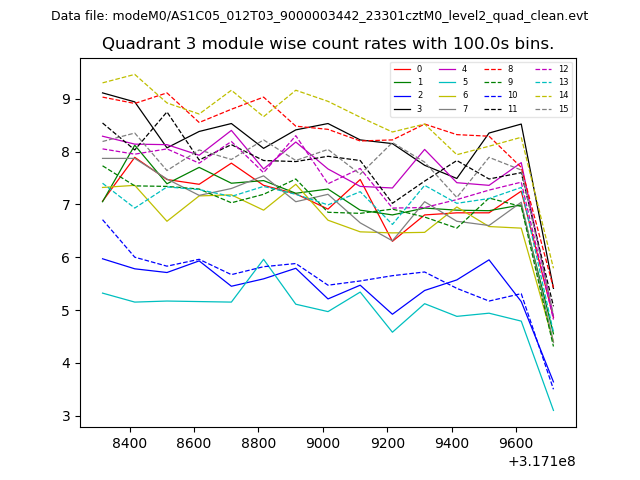
| Module-wise count rates for Quadrant A Data is divided into 100 sec bins |
 |
 |
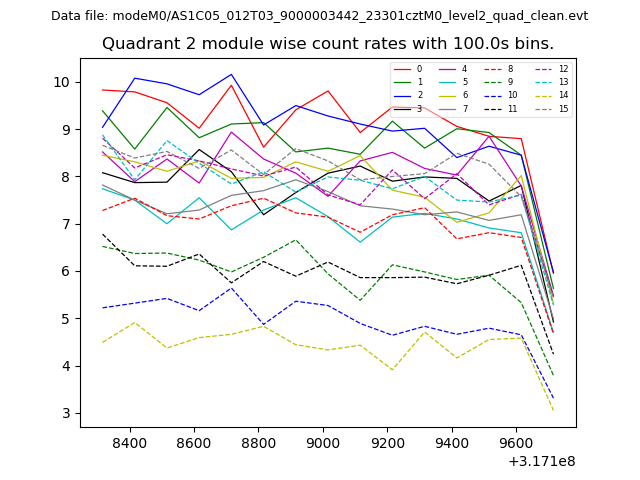
| Module-wise count rates for Quadrant B Data is divided into 100 sec bins |
 |
 |
| Module-wise count rates for Quadrant C Data is divided into 100 sec bins |
 |
 |
| Module-wise count rates for Quadrant D Data is divided into 100 sec bins |
 |
 |
| Parameter | Plot |
|---|---|
| CZT HV Monitor | 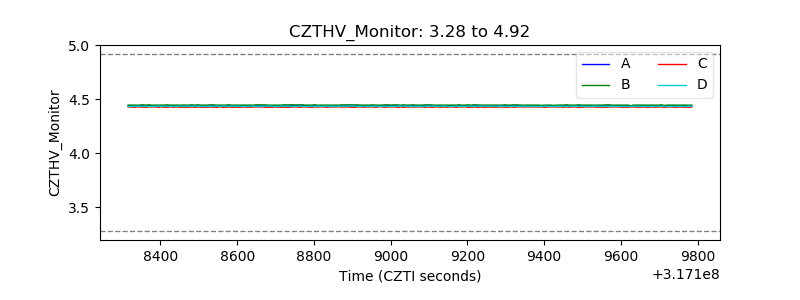 |
| D_VDD | 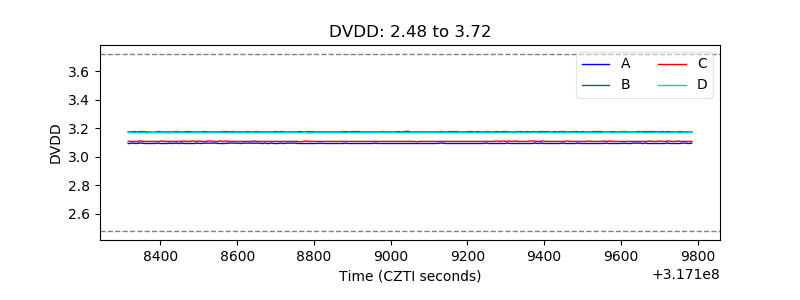 |
| Temperature 1 | 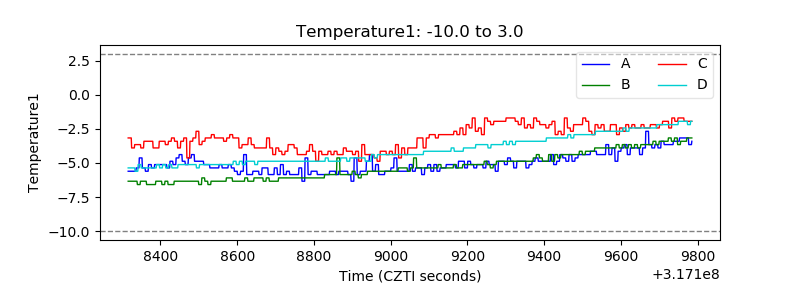 |
| Veto HV Monitor | 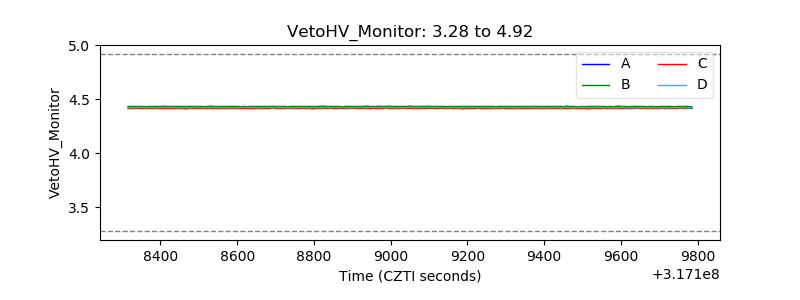 |
| Veto LLD | 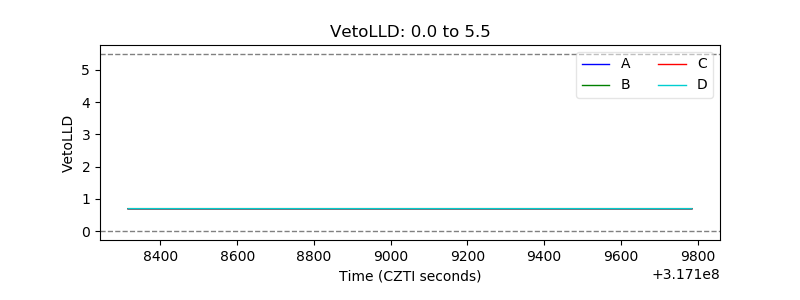 |
| Alpha Counter |  |
| _CPM_Rate | 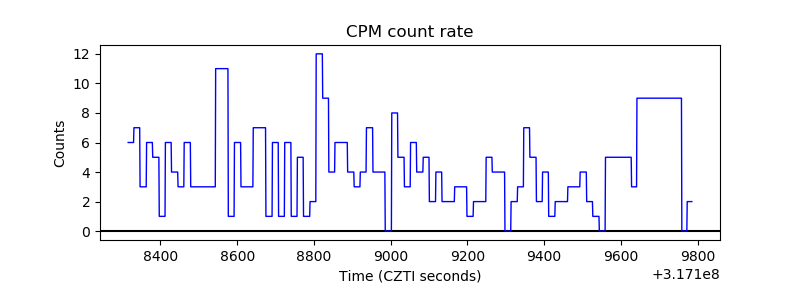 |
| CZT Counter | 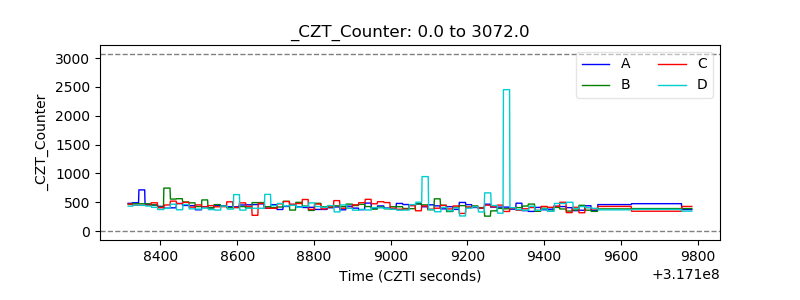 |
| +2.5 Volts monitor |  |
| +5 Volts monitor |  |
| _ROLL_ROT |  |
| _Roll_DEC | 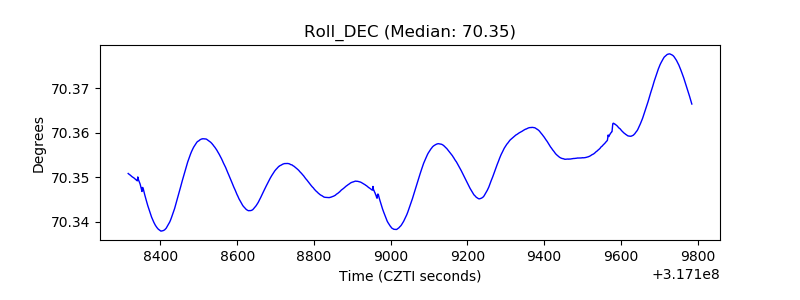 |
| _Roll_RA | 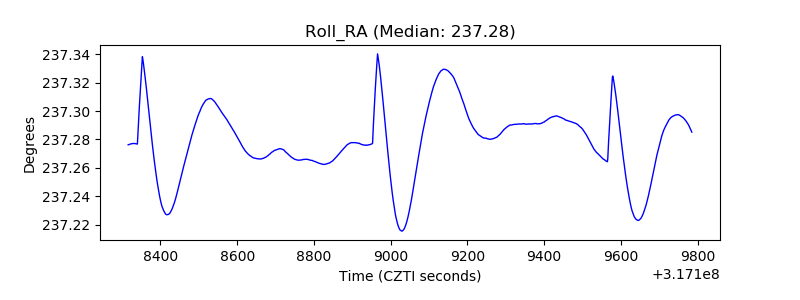 |
| Veto Counter | 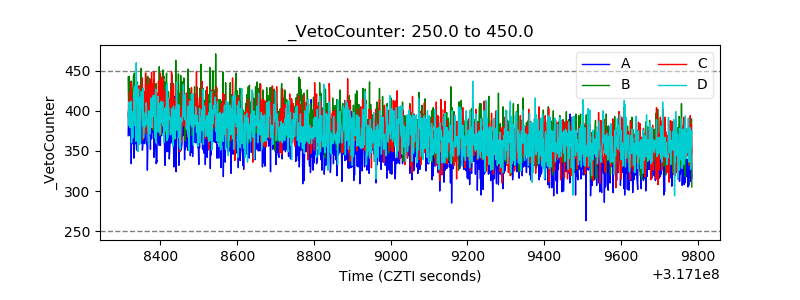 |