| Param | Original file | Final file |
|---|---|---|
| Filename | modeM0/AS1A07_148T02_9000003444_23301cztM0_level2.evt | modeM0/AS1A07_148T02_9000003444_23301cztM0_level2_quad_clean.evt |
| Size (bytes) | 731,787,840 | 114,289,920 |
| Size | 697.9 MB | 109.0 MB |
| Events in quadrant A | 4,278,068 | 733,700 |
| Events in quadrant B | 4,390,836 | 745,934 |
| Events in quadrant C | 5,070,175 | 719,418 |
| Events in quadrant D | 7,840,715 | 664,164 |
| Mode M9 | |||
|---|---|---|---|
| Quadrant | BADHDUFLAG | Total packets | Discarded packets |
| A | 0 | 22 | 0 |
| B | 0 | 22 | 0 |
| C | 0 | 22 | 0 |
| D | 0 | 22 | 0 |
| Mode SS | |||
|---|---|---|---|
| Quadrant | BADHDUFLAG | Total packets | Discarded packets |
| A | 0 | 174 | 0 |
| B | 0 | 174 | 0 |
| C | 0 | 174 | 0 |
| D | 0 | 174 | 0 |
| Mode M0 | |||
|---|---|---|---|
| Quadrant | BADHDUFLAG | Total packets | Discarded packets |
| A | 0 | 17805 | 2 |
| B | 0 | 18070 | 2 |
| C | 0 | 20168 | 2 |
| D | 0 | 29017 | 2 |
| Quadrant | Total seconds | Saturated seconds | Saturation percentage |
|---|---|---|---|
| A | 8618 | 61 | 0.707821% |
| B | 8618 | 73 | 0.847064% |
| C | 8618 | 386 | 4.478997% |
| D | 8618 | 922 | 10.698538% |
Noise dominated data is calculated using 1-second bins in cleaned event files. If a bin has >2000 counts, and if more than 50% of those come from <1% of pixels, then it is considered to be noise-dominated and hence unusable.
| Quadrant | # 1 sec bins | Bins with >0 counts | Bins with >2000 counts | High rate bins dominated by noise | Noise dominated (total time) | Noise dominated (detector-on time) | Marked lightcurve |
|---|---|---|---|---|---|---|---|
| A | 10693 | 8619 | 0 | 0 | 0.00% | 0.00% |  |
| B | 10693 | 8619 | 5 | 5 | 0.05% | 0.06% | 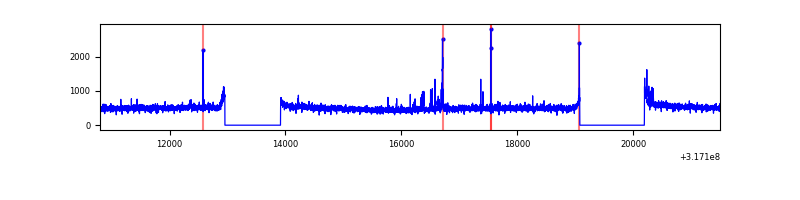 |
| C | 10693 | 8619 | 235 | 235 | 2.20% | 2.73% | 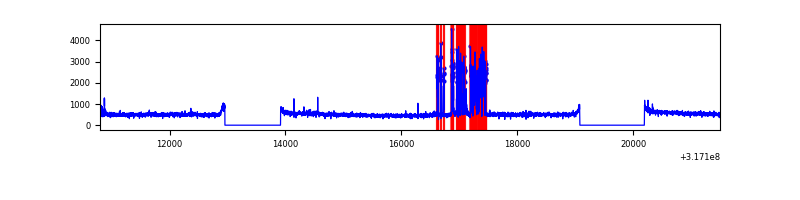 |
| D | 10693 | 8619 | 684 | 684 | 6.40% | 7.94% | 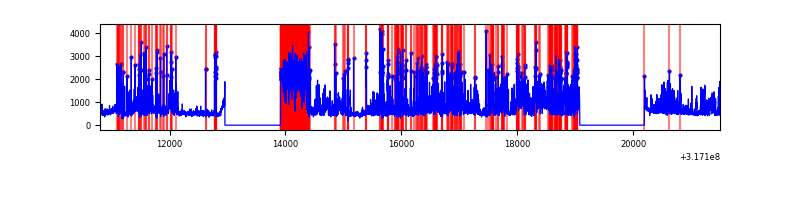 |
Top three noisy pixels from each quadrant. If the there are fewer than three noisy pixels in the level2.evt file, extra rows are filled as -1
| Pixel properties | Quadrant properties | ||||||
|---|---|---|---|---|---|---|---|
| Quadrant | DetID | PixID | Counts | Sigma | Mean | Median | Sigma |
| A | 13 | 254 | 13106 | 53.89 | 1110 | 1086 | 223.0 |
| A | 0 | 226 | 9672 | 38.49 | 1110 | 1086 | 223.0 |
| A | 3 | 137 | 9464 | 37.56 | 1110 | 1086 | 223.0 |
| B | 0 | 190 | 52846 | 247.5 | 1100 | 1072 | 209.2 |
| B | 12 | 111 | 25095 | 114.84 | 1100 | 1072 | 209.2 |
| B | 11 | 111 | 22388 | 101.9 | 1100 | 1072 | 209.2 |
| C | 0 | 10 | 744486 | 3005.57 | 1053 | 1062 | 247.3 |
| C | 14 | 238 | 165280 | 663.91 | 1053 | 1062 | 247.3 |
| C | 7 | 247 | 28543 | 111.1 | 1053 | 1062 | 247.3 |
| D | 1 | 52 | 2926530 | 11607.26 | 1044 | 1016 | 252.0 |
| D | 7 | 238 | 889734 | 3526.08 | 1044 | 1016 | 252.0 |
| D | 2 | 234 | 32391 | 124.48 | 1044 | 1016 | 252.0 |
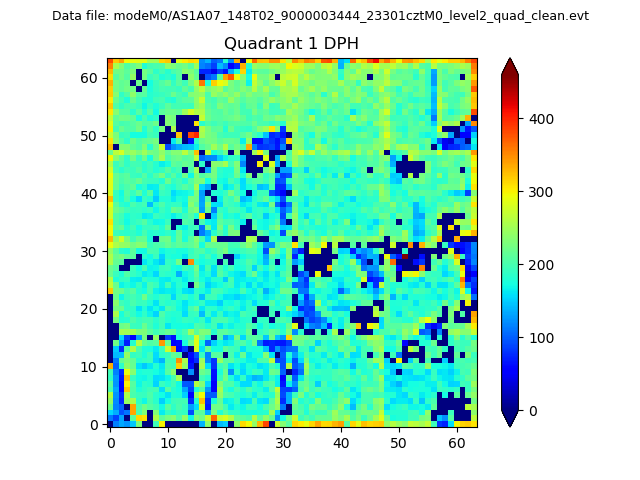
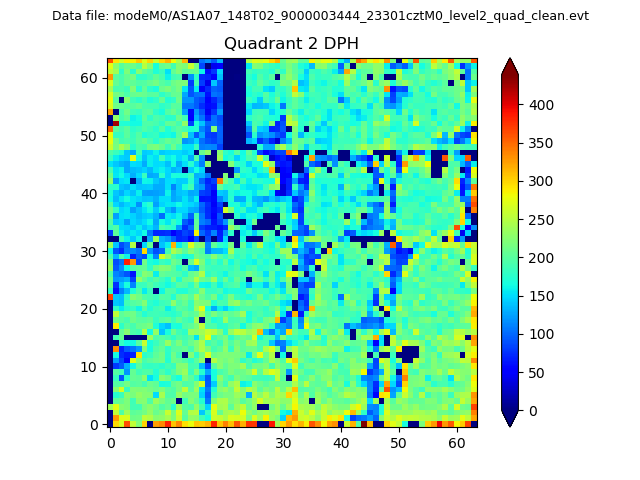
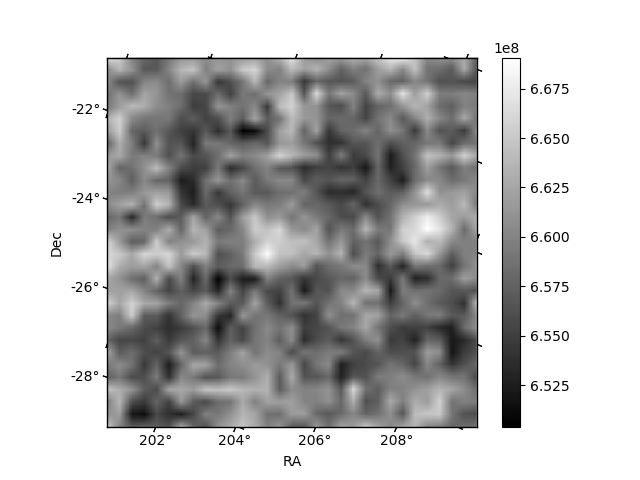
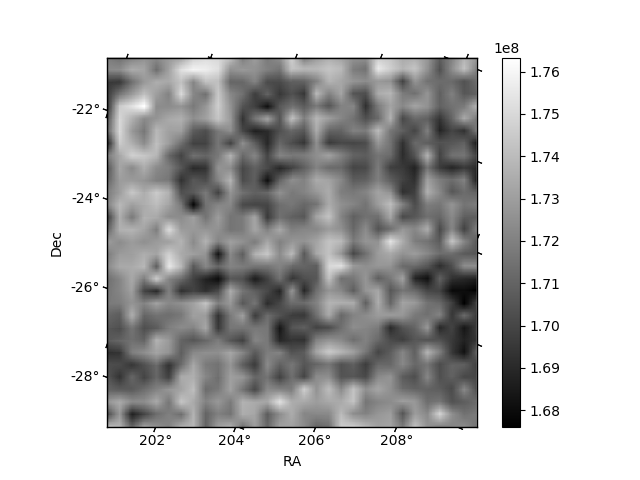
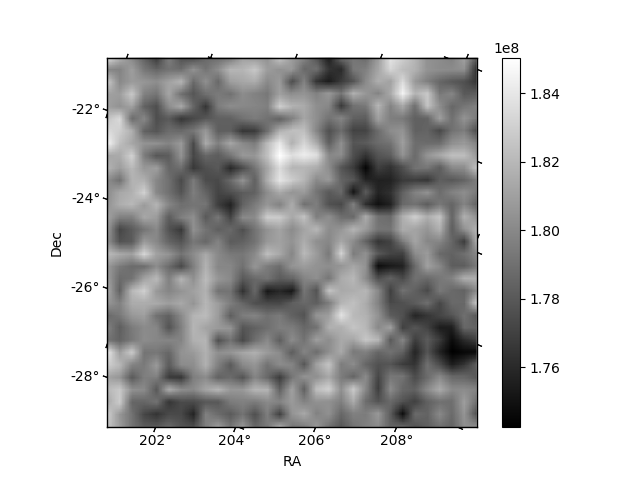
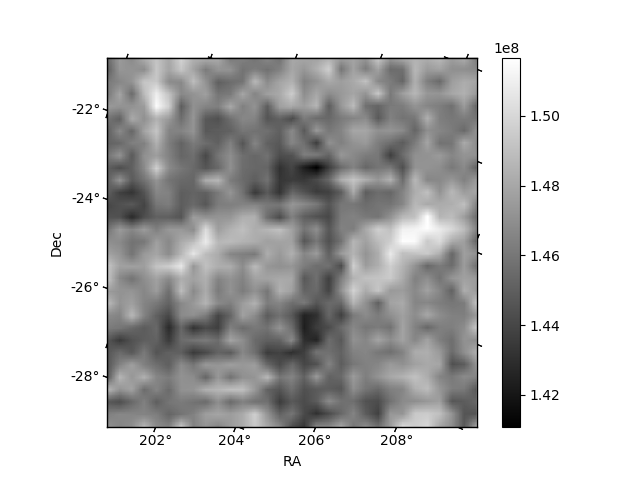
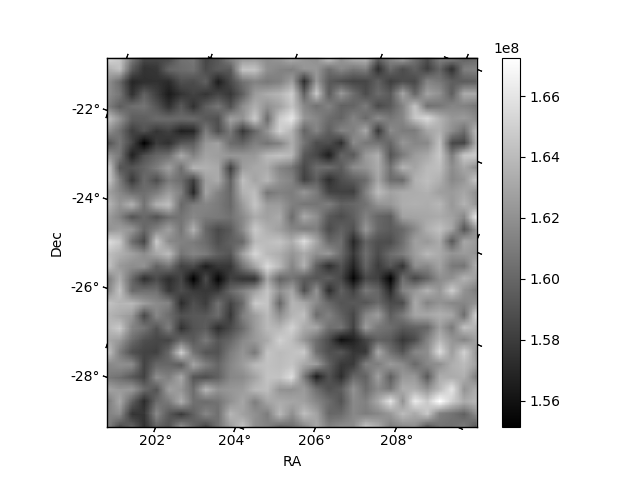
Histogram calculated using DETX and DETY for each event in the final _common_clean file
| Quadrant A | 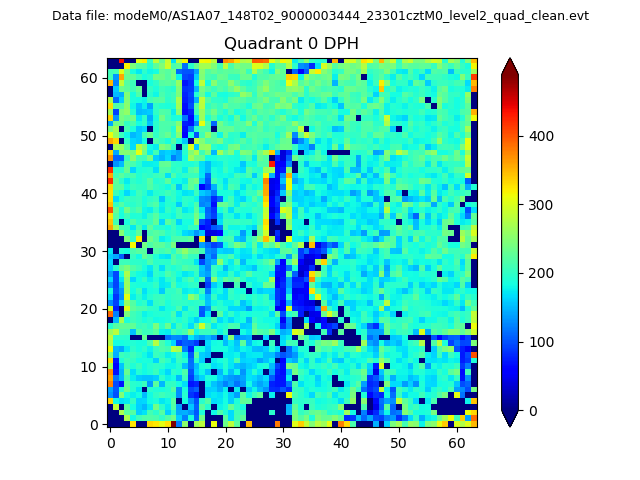 |
 |
Quadrant B |
|---|---|---|---|
| Quadrant D | 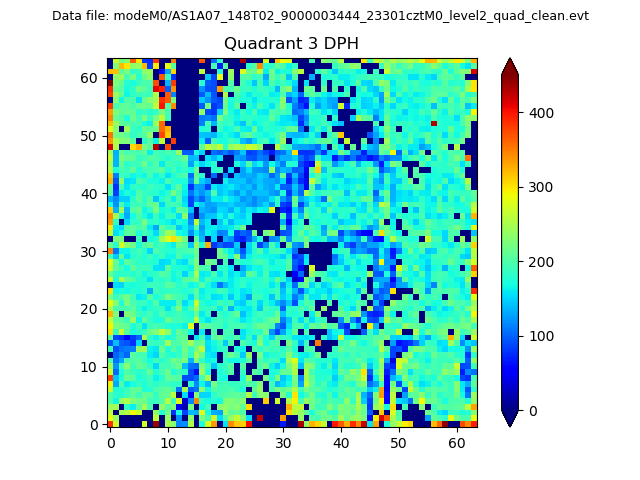 |
 |
Quadrant C |
| Plot type | Count rate plots | Images |
|---|---|---|
| Comparison with Poisson distribution Blue bars denote a histogram of data divided into 1 sec bins. Red curve is a Poisson curve with rate = median count rate of data. |
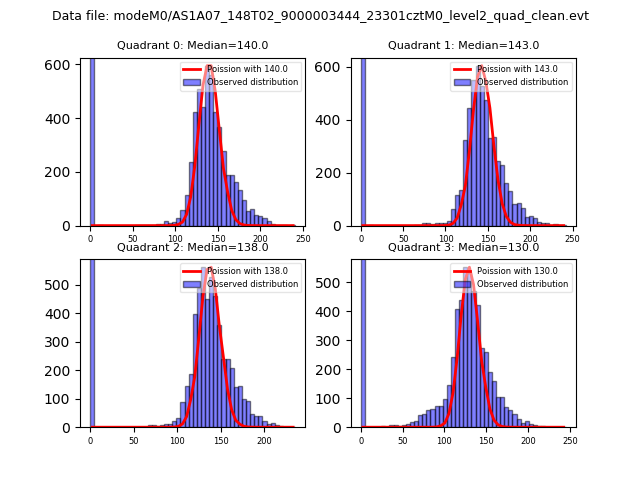 |
 |
| Quadrant-wise count rates Data is divided into 100 sec bins |
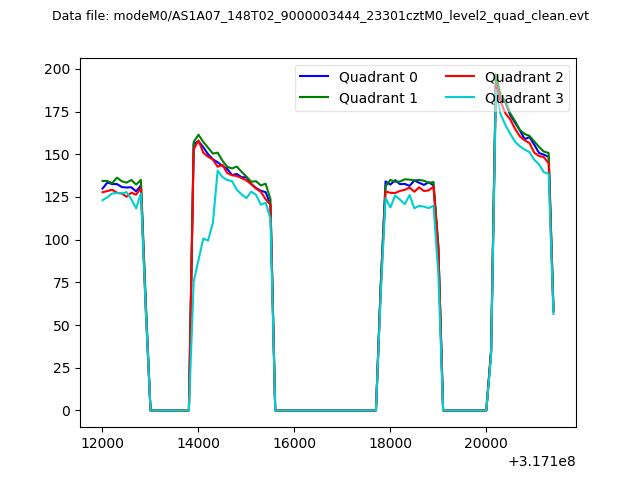 |
|
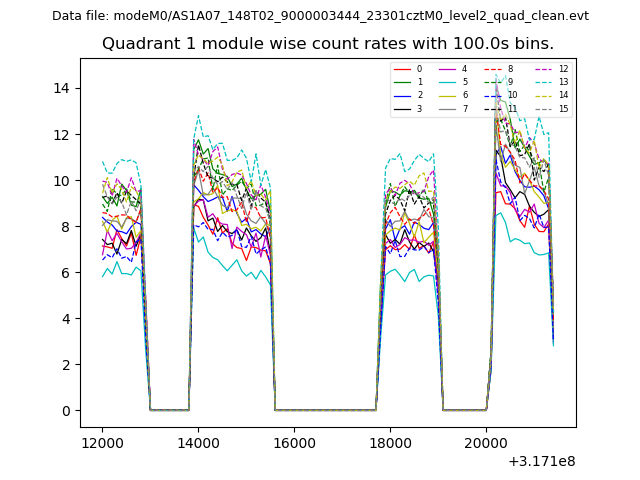
| Module-wise count rates for Quadrant A Data is divided into 100 sec bins |
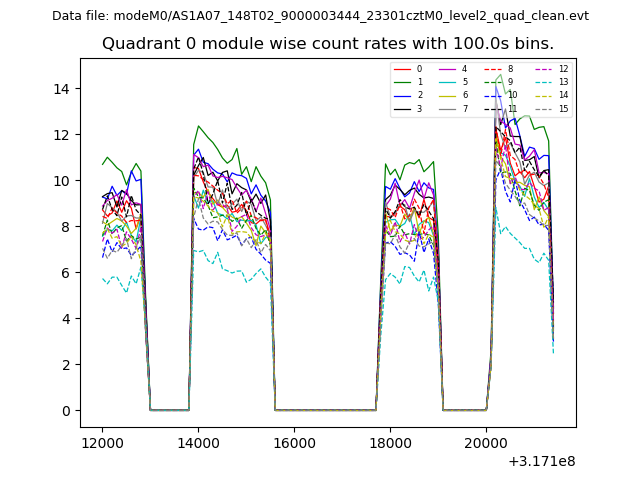 |
 |
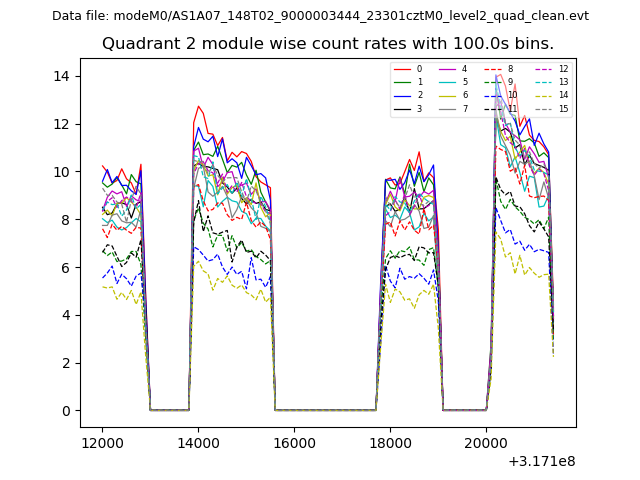
| Module-wise count rates for Quadrant B Data is divided into 100 sec bins |
 |
 |
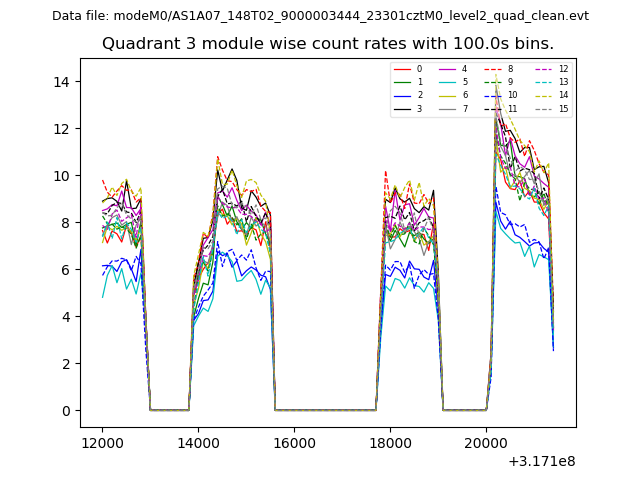
| Module-wise count rates for Quadrant C Data is divided into 100 sec bins |
 |
 |
| Module-wise count rates for Quadrant D Data is divided into 100 sec bins |
 |
 |
| Parameter | Plot |
|---|---|
| CZT HV Monitor | 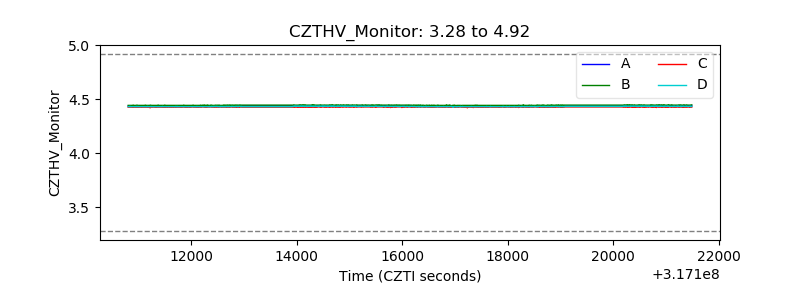 |
| D_VDD | 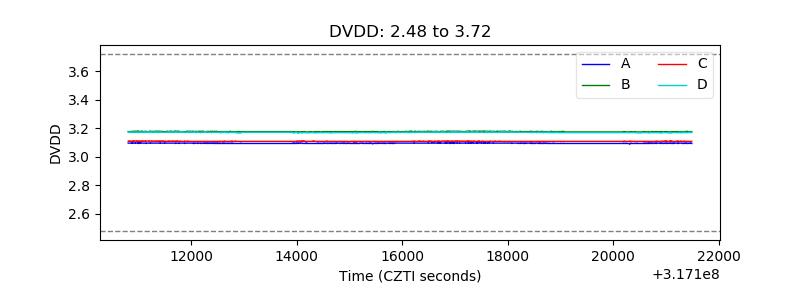 |
| Temperature 1 | 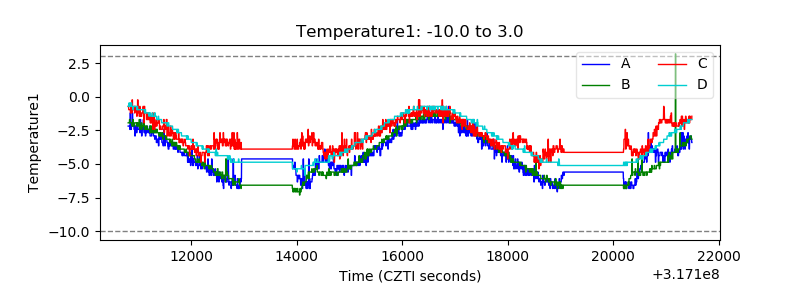 |
| Veto HV Monitor |  |
| Veto LLD | 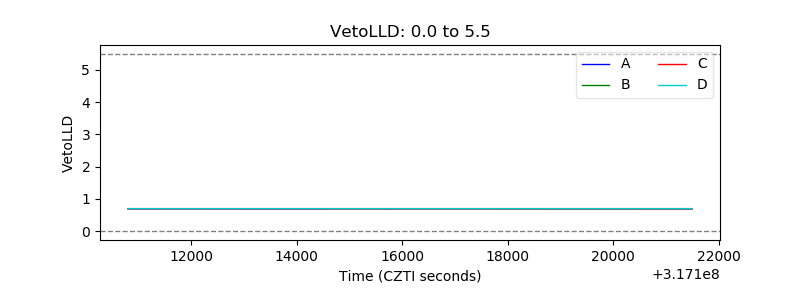 |
| Alpha Counter | 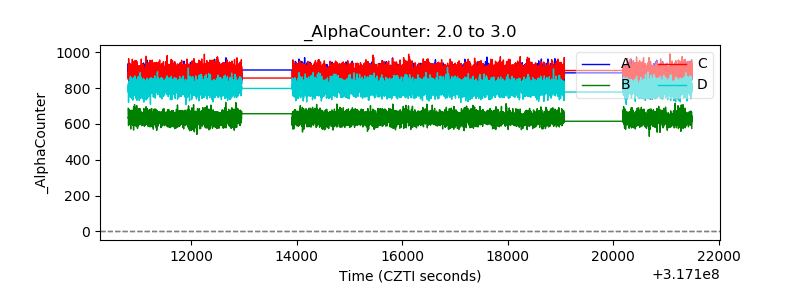 |
| _CPM_Rate | 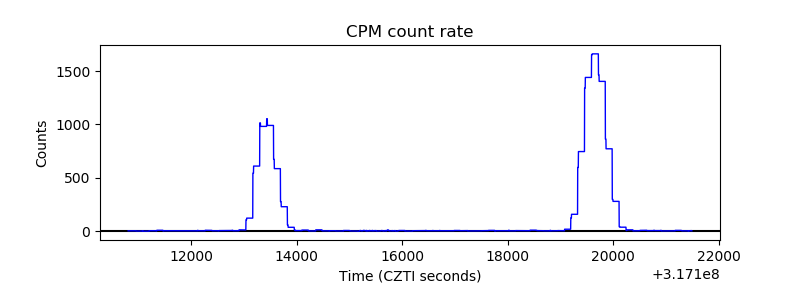 |
| CZT Counter | 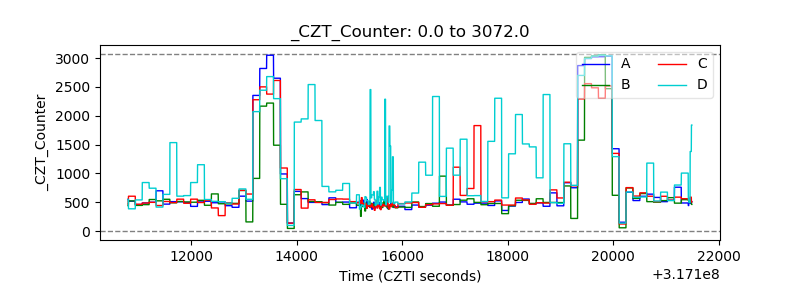 |
| +2.5 Volts monitor |  |
| +5 Volts monitor |  |
| _ROLL_ROT | 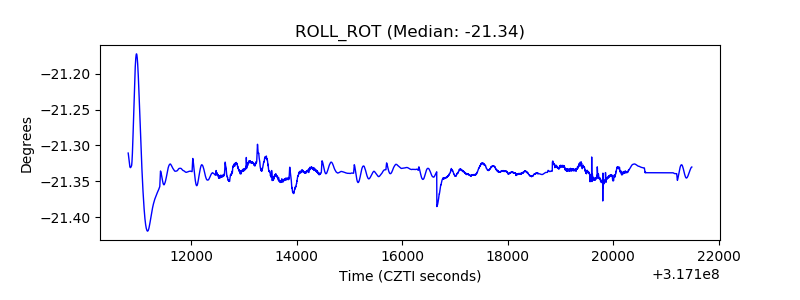 |
| _Roll_DEC | 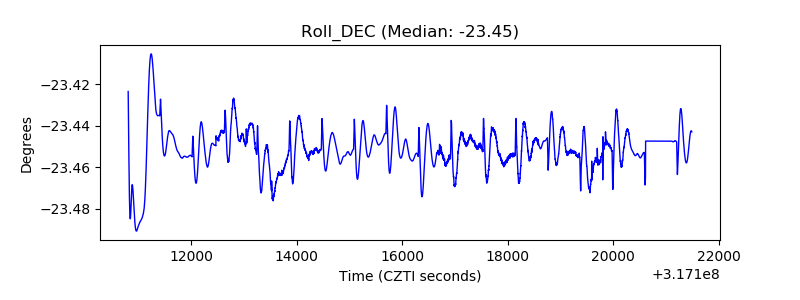 |
| _Roll_RA | 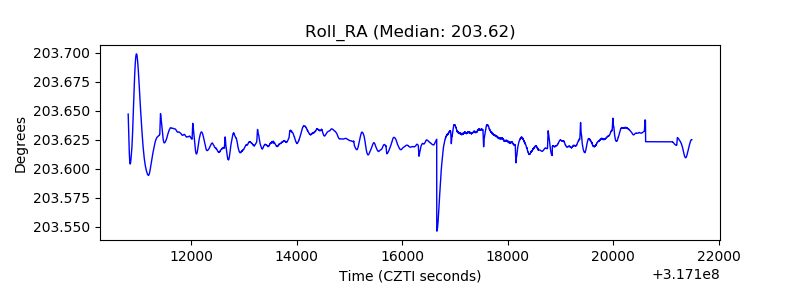 |
| Veto Counter | 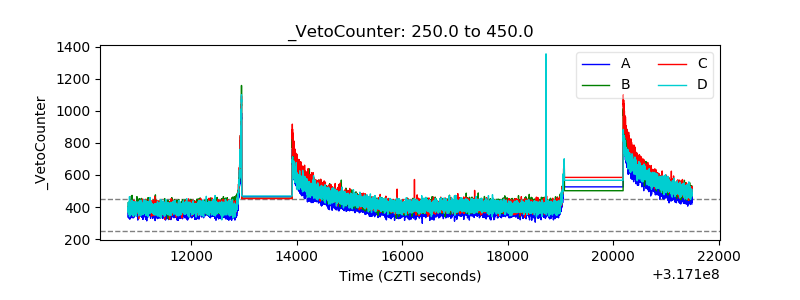 |