| Param | Original file | Final file |
|---|---|---|
| Filename | modeM0/AS1A07_148T02_9000003444_23302cztM0_level2.evt | modeM0/AS1A07_148T02_9000003444_23302cztM0_level2_quad_clean.evt |
| Size (bytes) | 520,464,960 | 89,521,920 |
| Size | 496.4 MB | 85.4 MB |
| Events in quadrant A | 3,333,530 | 579,032 |
| Events in quadrant B | 3,470,851 | 583,796 |
| Events in quadrant C | 3,431,934 | 561,790 |
| Events in quadrant D | 5,095,305 | 543,078 |
| Mode M9 | |||
|---|---|---|---|
| Quadrant | BADHDUFLAG | Total packets | Discarded packets |
| A | 0 | 12 | 0 |
| B | 0 | 12 | 0 |
| C | 0 | 12 | 0 |
| D | 0 | 12 | 0 |
| Mode SS | |||
|---|---|---|---|
| Quadrant | BADHDUFLAG | Total packets | Discarded packets |
| A | 0 | 128 | 0 |
| B | 0 | 128 | 0 |
| C | 0 | 128 | 0 |
| D | 0 | 128 | 0 |
| Mode M0 | |||
|---|---|---|---|
| Quadrant | BADHDUFLAG | Total packets | Discarded packets |
| A | 0 | 13739 | 2 |
| B | 0 | 14086 | 2 |
| C | 0 | 14068 | 2 |
| D | 0 | 19488 | 2 |
| Quadrant | Total seconds | Saturated seconds | Saturation percentage |
|---|---|---|---|
| A | 6357 | 54 | 0.849457% |
| B | 6357 | 80 | 1.258455% |
| C | 6357 | 87 | 1.368570% |
| D | 6357 | 363 | 5.710241% |
Noise dominated data is calculated using 1-second bins in cleaned event files. If a bin has >2000 counts, and if more than 50% of those come from <1% of pixels, then it is considered to be noise-dominated and hence unusable.
| Quadrant | # 1 sec bins | Bins with >0 counts | Bins with >2000 counts | High rate bins dominated by noise | Noise dominated (total time) | Noise dominated (detector-on time) | Marked lightcurve |
|---|---|---|---|---|---|---|---|
| A | 7552 | 6357 | 0 | 0 | 0.00% | 0.00% | 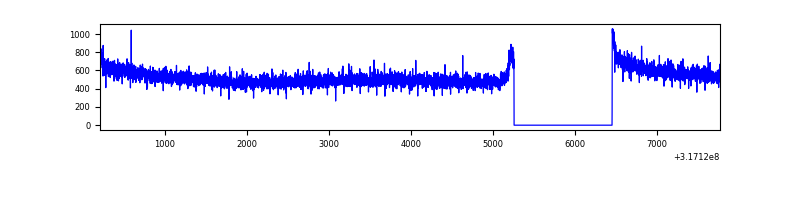 |
| B | 7552 | 6357 | 14 | 14 | 0.19% | 0.22% | 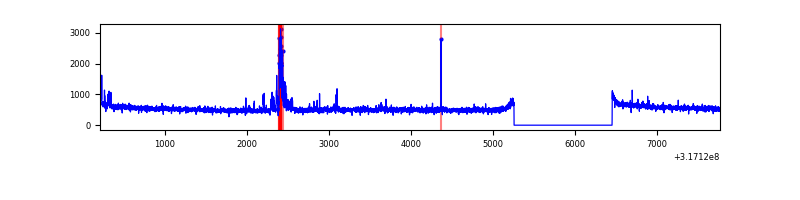 |
| C | 7552 | 6357 | 0 | 0 | 0.00% | 0.00% | 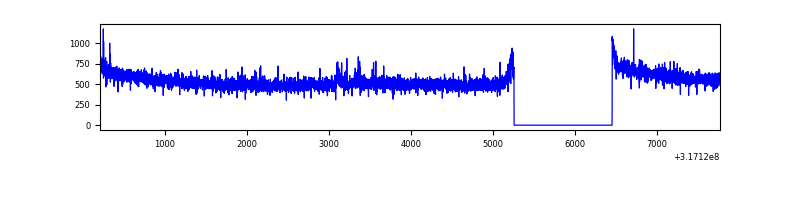 |
| D | 7552 | 6357 | 283 | 283 | 3.75% | 4.45% | 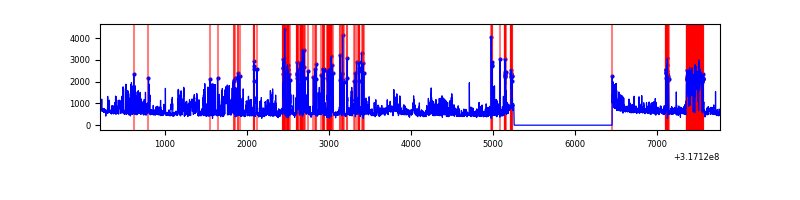 |
Top three noisy pixels from each quadrant. If the there are fewer than three noisy pixels in the level2.evt file, extra rows are filled as -1
| Pixel properties | Quadrant properties | ||||||
|---|---|---|---|---|---|---|---|
| Quadrant | DetID | PixID | Counts | Sigma | Mean | Median | Sigma |
| A | 13 | 254 | 10087 | 53.65 | 865 | 850 | 172.2 |
| A | 0 | 226 | 7508 | 38.67 | 865 | 850 | 172.2 |
| A | 3 | 137 | 6802 | 34.57 | 865 | 850 | 172.2 |
| B | 0 | 190 | 124193 | 774.66 | 847 | 826 | 159.3 |
| B | 12 | 111 | 18403 | 110.37 | 847 | 826 | 159.3 |
| B | 11 | 111 | 16148 | 96.21 | 847 | 826 | 159.3 |
| C | 14 | 238 | 132763 | 685.91 | 831 | 839 | 192.3 |
| C | 7 | 247 | 26524 | 133.54 | 831 | 839 | 192.3 |
| C | 10 | 9 | 23503 | 117.84 | 831 | 839 | 192.3 |
| D | 1 | 52 | 1011537 | 5002.08 | 832 | 811 | 202.1 |
| D | 7 | 238 | 791844 | 3914.82 | 832 | 811 | 202.1 |
| D | 13 | 249 | 38827 | 188.14 | 832 | 811 | 202.1 |
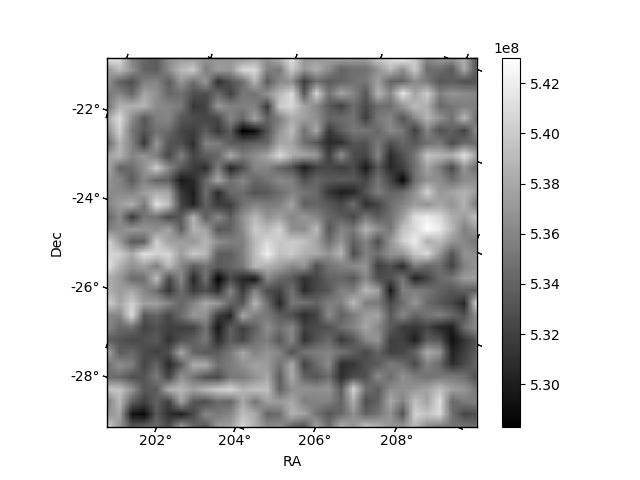
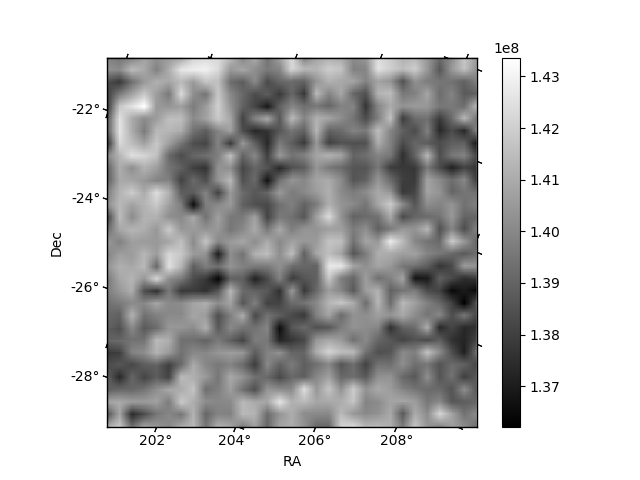
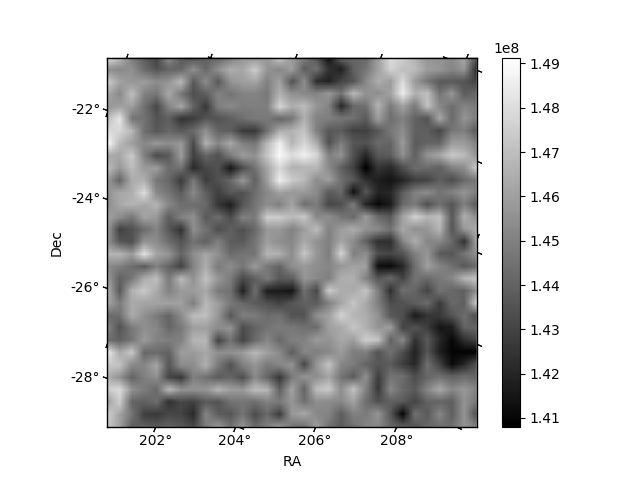
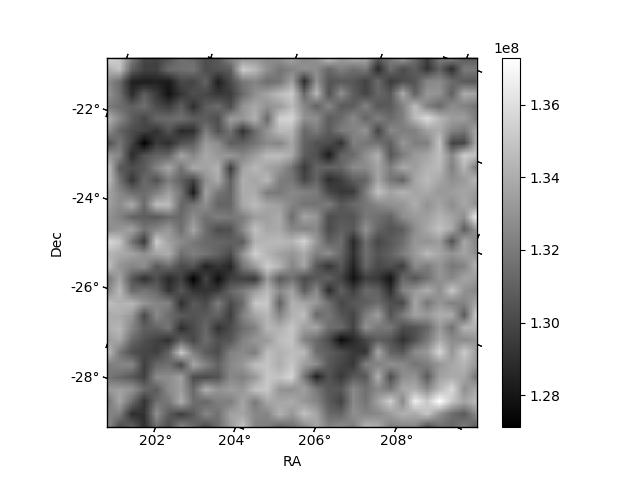
Histogram calculated using DETX and DETY for each event in the final _common_clean file
| Quadrant A | 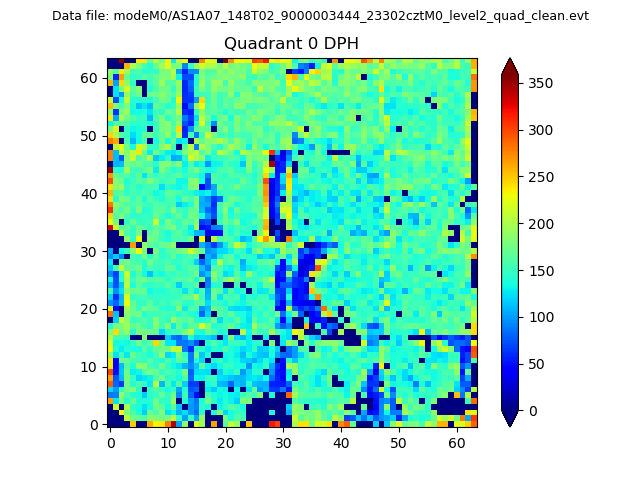 |
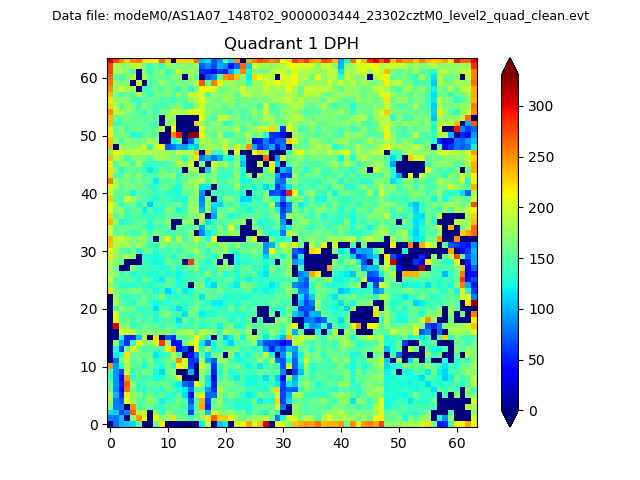 |
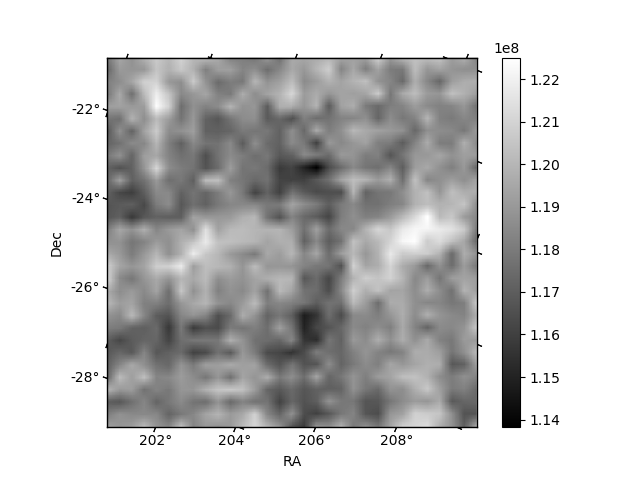
Quadrant B |
|---|---|---|---|
| Quadrant D |  |
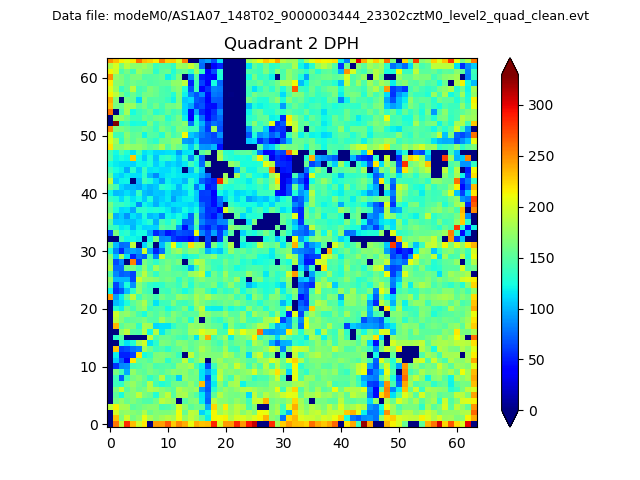 |
Quadrant C |
| Plot type | Count rate plots | Images |
|---|---|---|
| Comparison with Poisson distribution Blue bars denote a histogram of data divided into 1 sec bins. Red curve is a Poisson curve with rate = median count rate of data. |
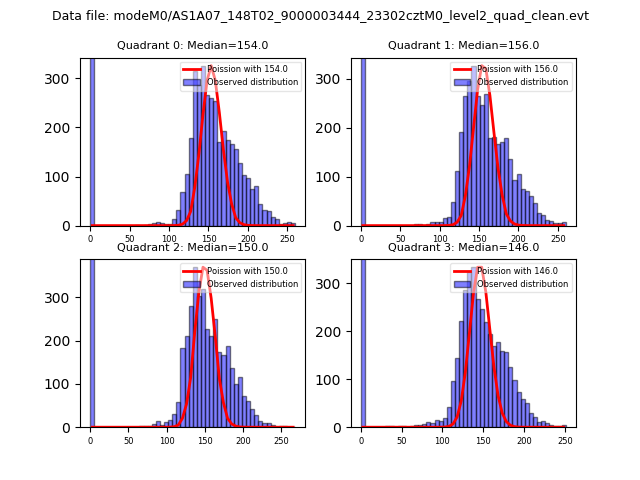 |
 |
| Quadrant-wise count rates Data is divided into 100 sec bins |
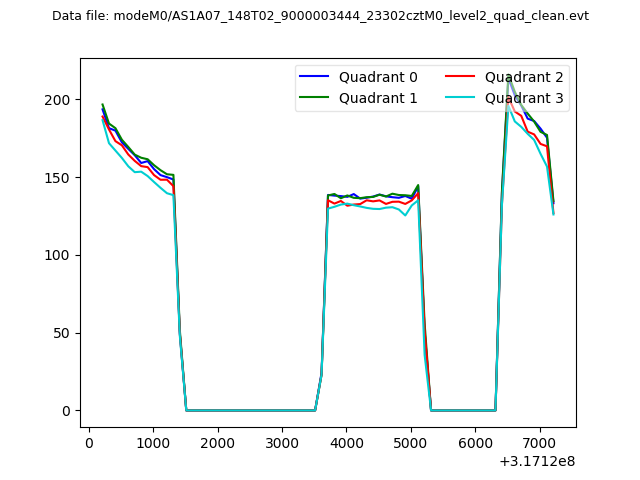 |
|
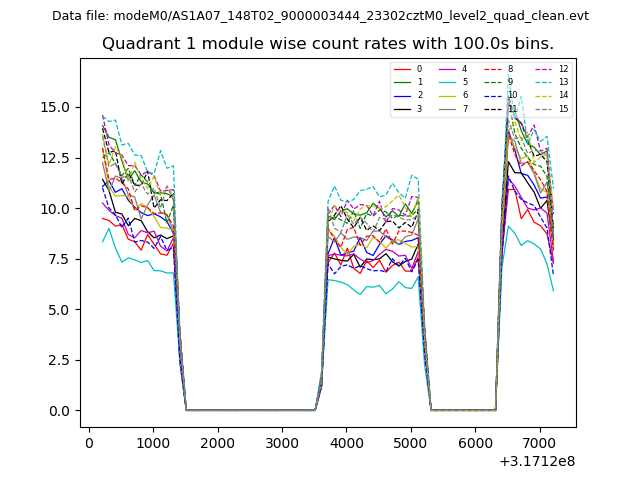
| Module-wise count rates for Quadrant A Data is divided into 100 sec bins |
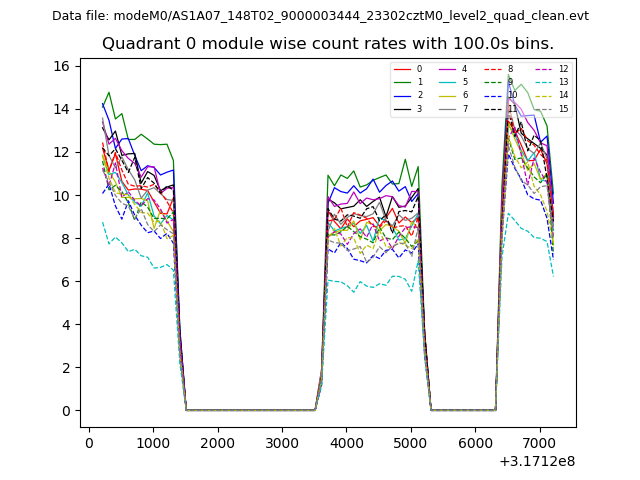 |
 |
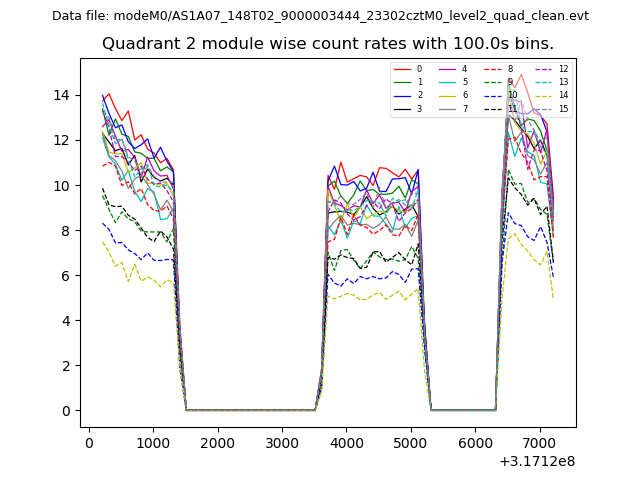
| Module-wise count rates for Quadrant B Data is divided into 100 sec bins |
 |
 |
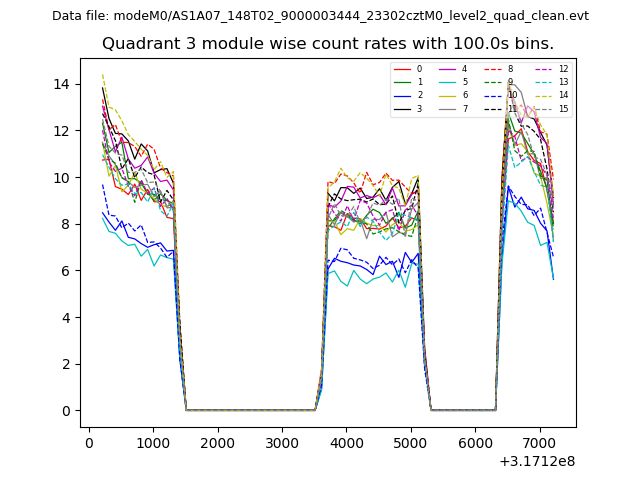
| Module-wise count rates for Quadrant C Data is divided into 100 sec bins |
 |
 |
| Module-wise count rates for Quadrant D Data is divided into 100 sec bins |
 |
 |
| Parameter | Plot |
|---|---|
| CZT HV Monitor | 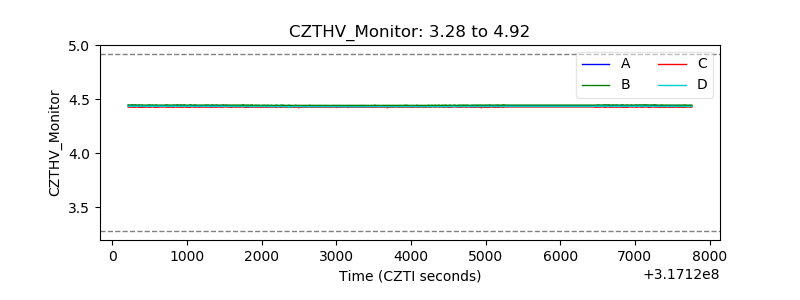 |
| D_VDD | 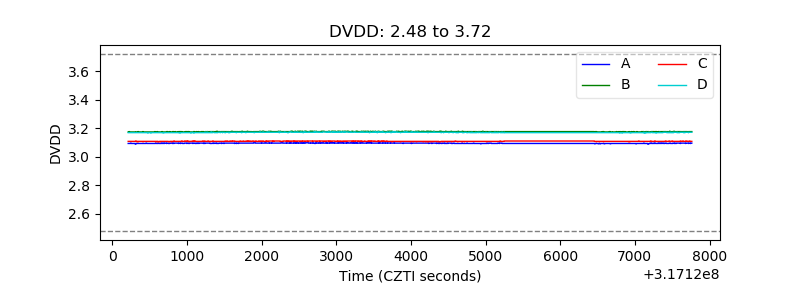 |
| Temperature 1 | 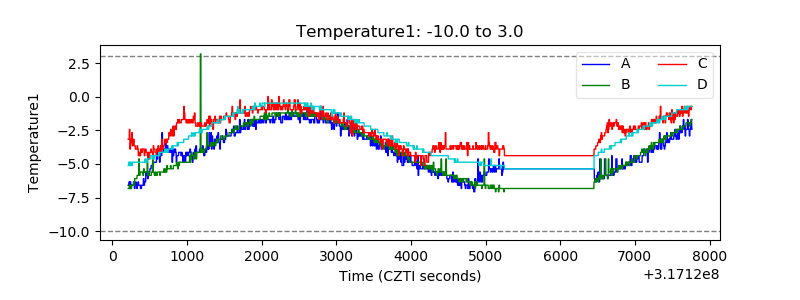 |
| Veto HV Monitor | 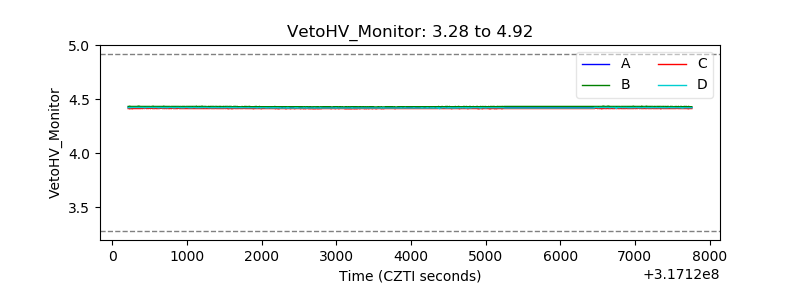 |
| Veto LLD |  |
| Alpha Counter | 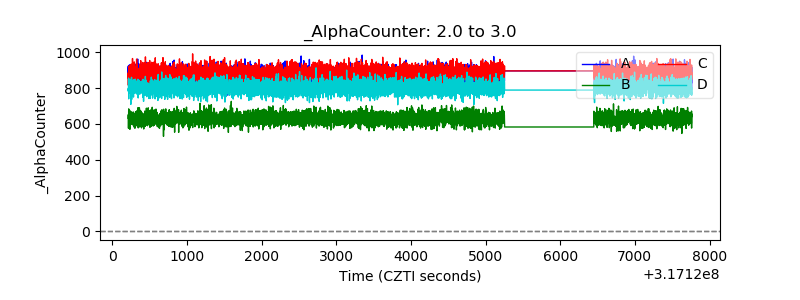 |
| _CPM_Rate | 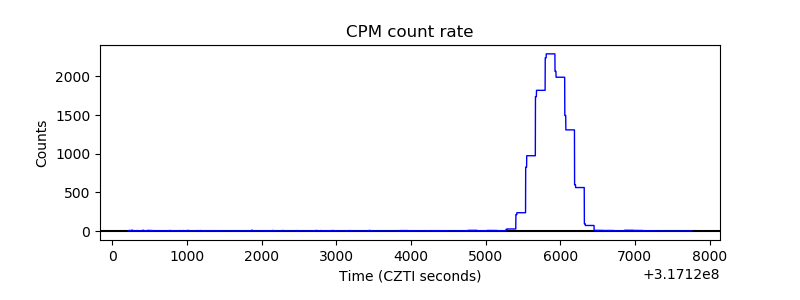 |
| CZT Counter | 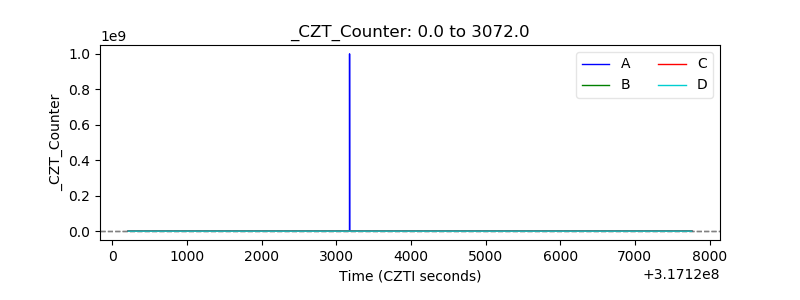 |
| +2.5 Volts monitor |  |
| +5 Volts monitor |  |
| _ROLL_ROT |  |
| _Roll_DEC | 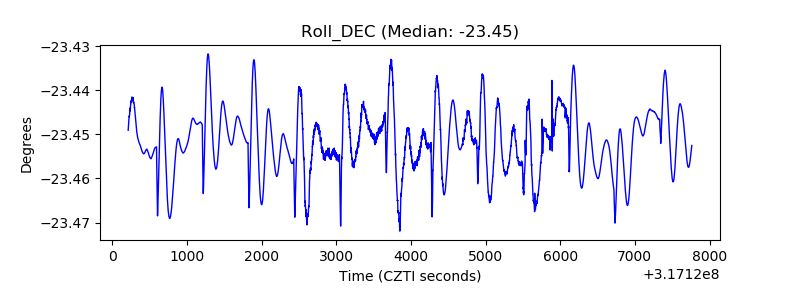 |
| _Roll_RA | 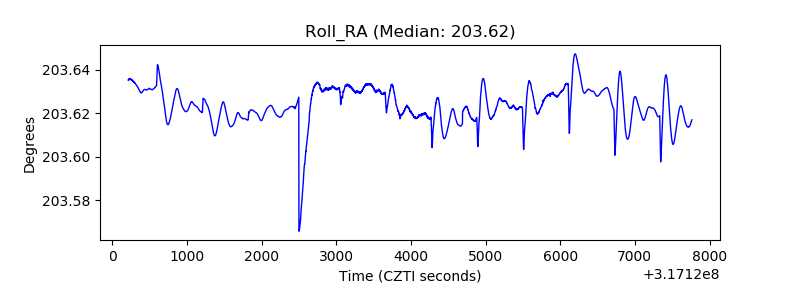 |
| Veto Counter | 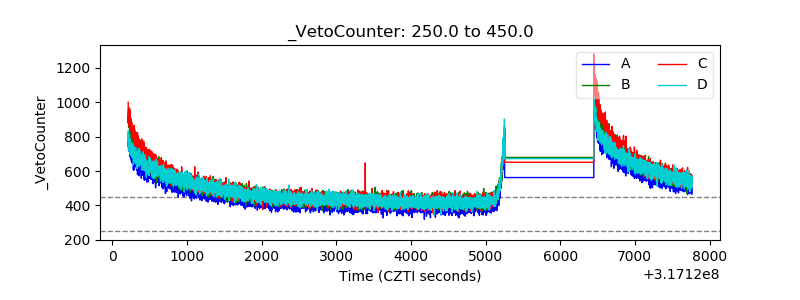 |