| Param | Original file | Final file |
|---|---|---|
| Filename | modeM0/AS1A07_148T02_9000003444_23303cztM0_level2.evt | modeM0/AS1A07_148T02_9000003444_23303cztM0_level2_quad_clean.evt |
| Size (bytes) | 514,465,920 | 71,458,560 |
| Size | 490.6 MB | 68.1 MB |
| Events in quadrant A | 3,353,491 | 444,153 |
| Events in quadrant B | 3,403,693 | 447,509 |
| Events in quadrant C | 3,521,163 | 425,737 |
| Events in quadrant D | 4,881,716 | 413,112 |
| Mode M9 | |||
|---|---|---|---|
| Quadrant | BADHDUFLAG | Total packets | Discarded packets |
| A | 0 | 13 | 0 |
| B | 0 | 13 | 0 |
| C | 0 | 13 | 0 |
| D | 0 | 13 | 0 |
| Mode SS | |||
|---|---|---|---|
| Quadrant | BADHDUFLAG | Total packets | Discarded packets |
| A | 0 | 126 | 0 |
| B | 0 | 126 | 0 |
| C | 0 | 126 | 0 |
| D | 0 | 126 | 0 |
| Mode M0 | |||
|---|---|---|---|
| Quadrant | BADHDUFLAG | Total packets | Discarded packets |
| A | 0 | 13632 | 1 |
| B | 0 | 13789 | 1 |
| C | 0 | 14144 | 1 |
| D | 0 | 18595 | 1 |
| Quadrant | Total seconds | Saturated seconds | Saturation percentage |
|---|---|---|---|
| A | 6203 | 67 | 1.080123% |
| B | 6204 | 63 | 1.015474% |
| C | 6204 | 103 | 1.660219% |
| D | 6204 | 464 | 7.479046% |
Noise dominated data is calculated using 1-second bins in cleaned event files. If a bin has >2000 counts, and if more than 50% of those come from <1% of pixels, then it is considered to be noise-dominated and hence unusable.
| Quadrant | # 1 sec bins | Bins with >0 counts | Bins with >2000 counts | High rate bins dominated by noise | Noise dominated (total time) | Noise dominated (detector-on time) | Marked lightcurve |
|---|---|---|---|---|---|---|---|
| A | 7478 | 6203 | 0 | 0 | 0.00% | 0.00% | 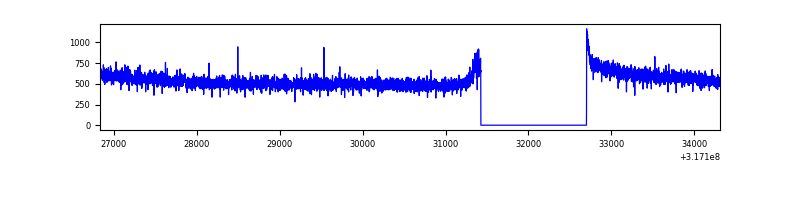 |
| B | 7479 | 6204 | 0 | 0 | 0.00% | 0.00% | 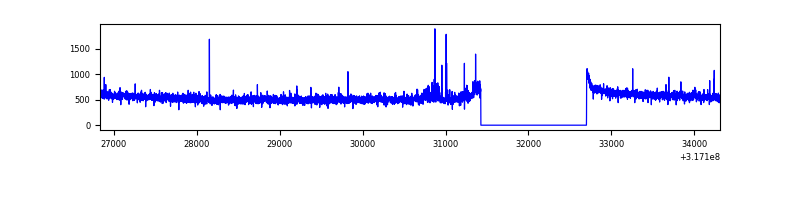 |
| C | 7479 | 6204 | 0 | 0 | 0.00% | 0.00% | 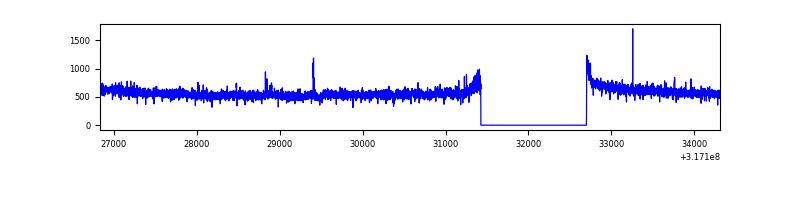 |
| D | 7479 | 6204 | 359 | 359 | 4.80% | 5.79% | 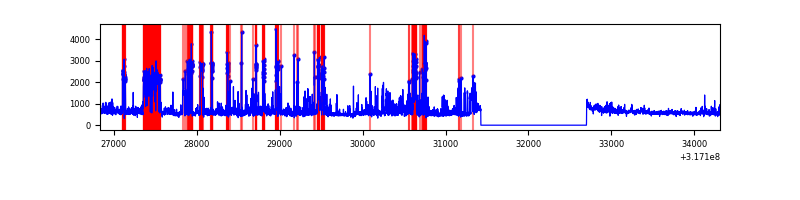 |
Top three noisy pixels from each quadrant. If the there are fewer than three noisy pixels in the level2.evt file, extra rows are filled as -1
| Pixel properties | Quadrant properties | ||||||
|---|---|---|---|---|---|---|---|
| Quadrant | DetID | PixID | Counts | Sigma | Mean | Median | Sigma |
| A | 13 | 254 | 9517 | 50.15 | 870 | 852 | 172.8 |
| A | 0 | 226 | 7666 | 39.44 | 870 | 852 | 172.8 |
| A | 3 | 137 | 6806 | 34.46 | 870 | 852 | 172.8 |
| B | 0 | 229 | 26183 | 158.35 | 856 | 837 | 160.1 |
| B | 0 | 230 | 25515 | 154.18 | 856 | 837 | 160.1 |
| B | 12 | 111 | 18057 | 107.58 | 856 | 837 | 160.1 |
| C | 14 | 238 | 134949 | 702.09 | 829 | 840 | 191.0 |
| C | 10 | 9 | 129766 | 674.96 | 829 | 840 | 191.0 |
| C | 0 | 239 | 7674 | 35.78 | 829 | 840 | 191.0 |
| D | 1 | 52 | 1126326 | 5692.61 | 829 | 810 | 197.7 |
| D | 7 | 238 | 365708 | 1845.57 | 829 | 810 | 197.7 |
| D | 1 | 239 | 137938 | 693.56 | 829 | 810 | 197.7 |
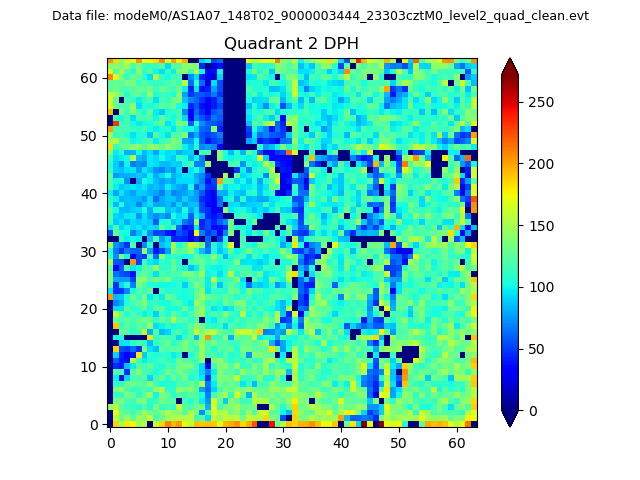
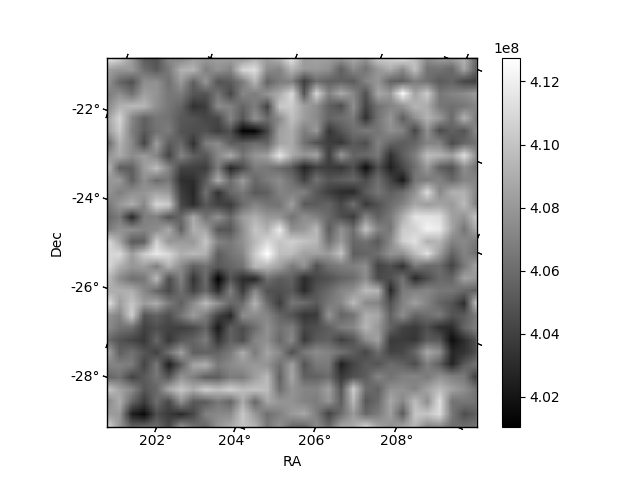
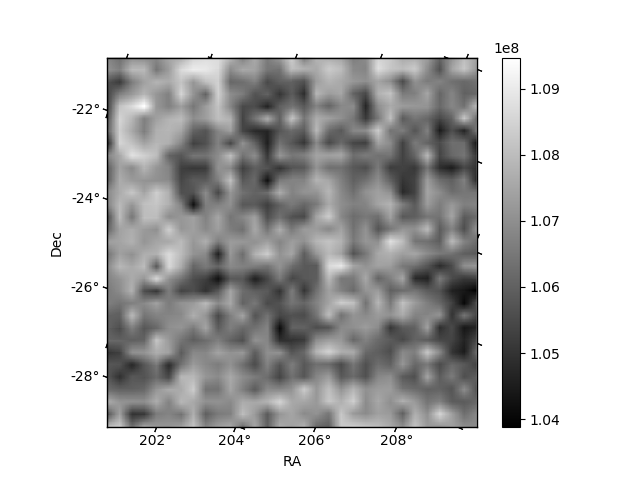
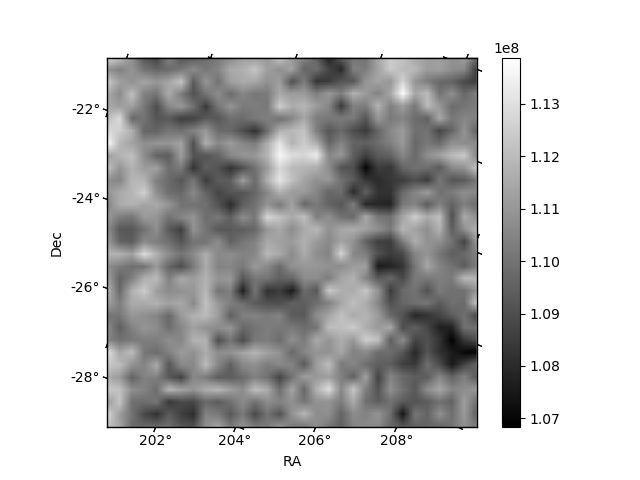
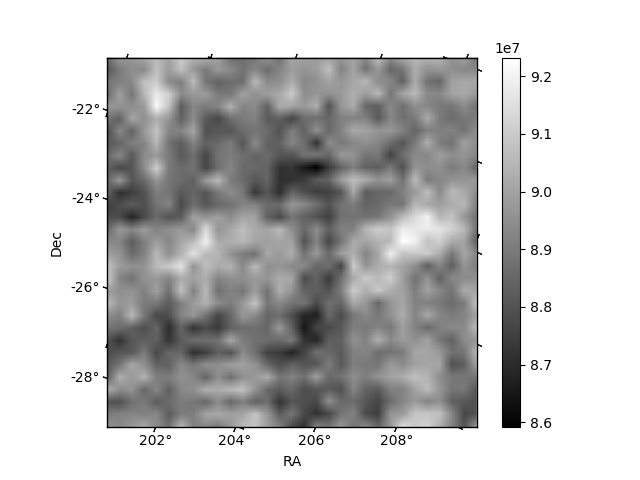
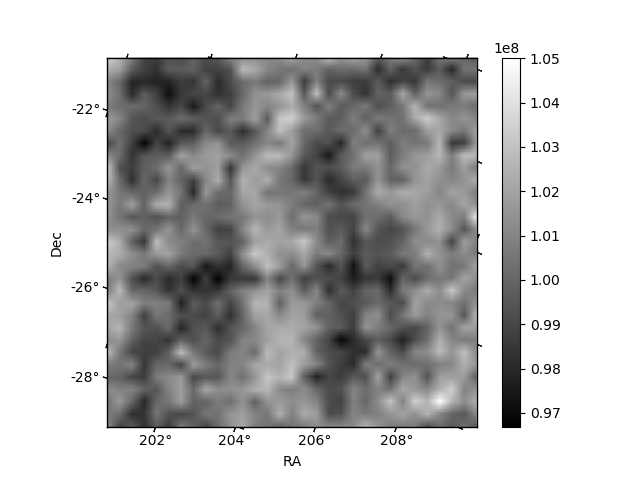
Histogram calculated using DETX and DETY for each event in the final _common_clean file
| Quadrant A | 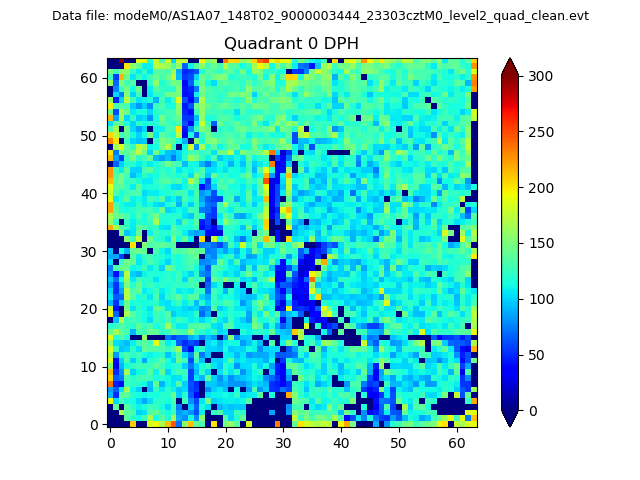 |
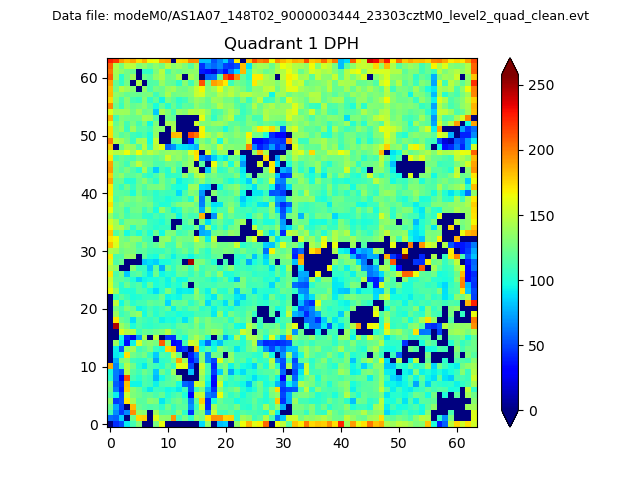 |
Quadrant B |
|---|---|---|---|
| Quadrant D | 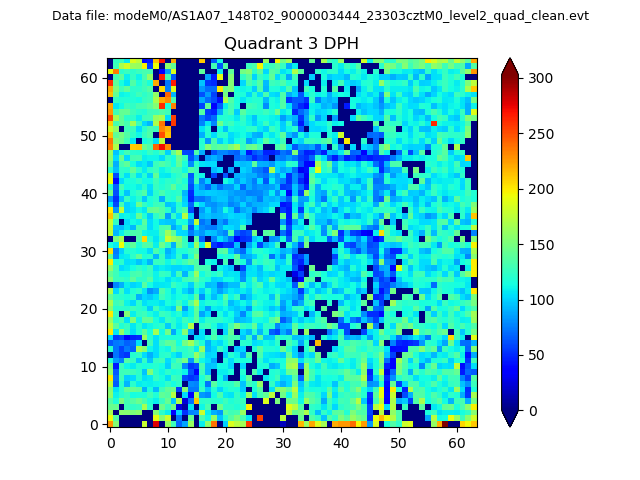 |
 |
Quadrant C |
| Plot type | Count rate plots | Images |
|---|---|---|
| Comparison with Poisson distribution Blue bars denote a histogram of data divided into 1 sec bins. Red curve is a Poisson curve with rate = median count rate of data. |
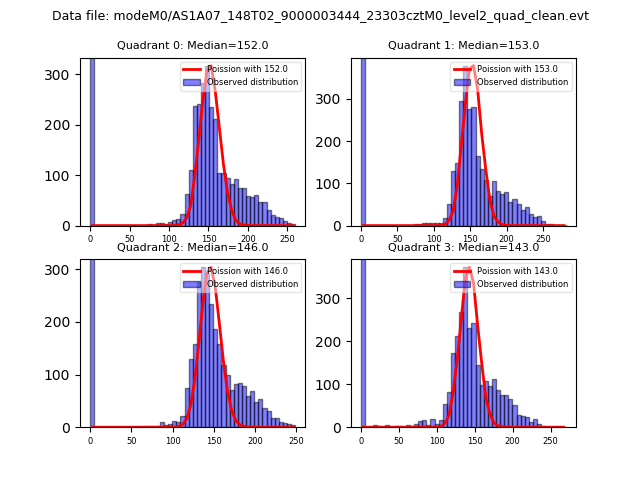 |
 |
| Quadrant-wise count rates Data is divided into 100 sec bins |
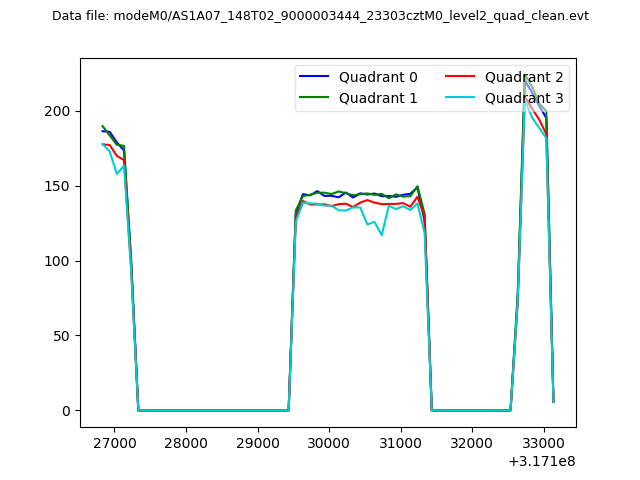 |
|
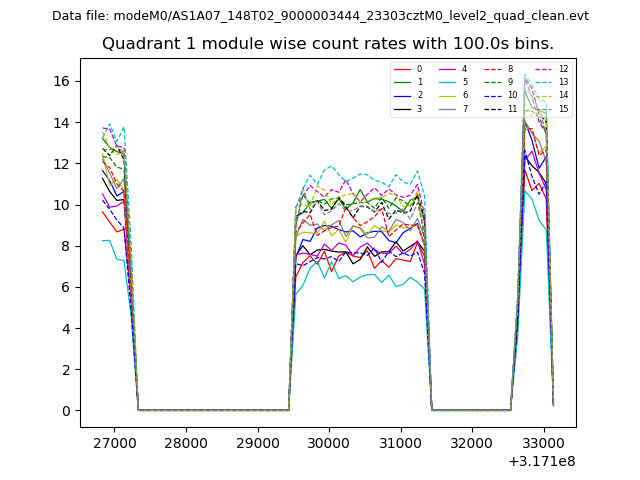
| Module-wise count rates for Quadrant A Data is divided into 100 sec bins |
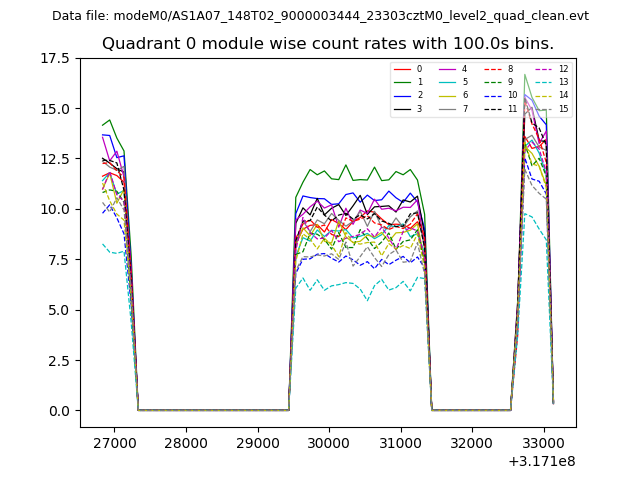 |
 |
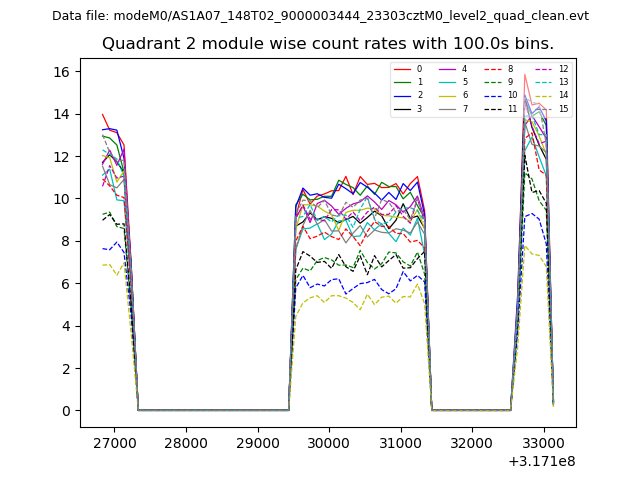
| Module-wise count rates for Quadrant B Data is divided into 100 sec bins |
 |
 |
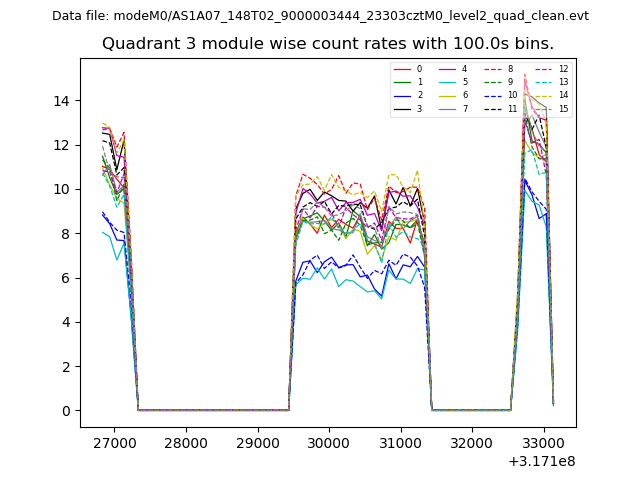
| Module-wise count rates for Quadrant C Data is divided into 100 sec bins |
 |
 |
| Module-wise count rates for Quadrant D Data is divided into 100 sec bins |
 |
 |
| Parameter | Plot |
|---|---|
| CZT HV Monitor | 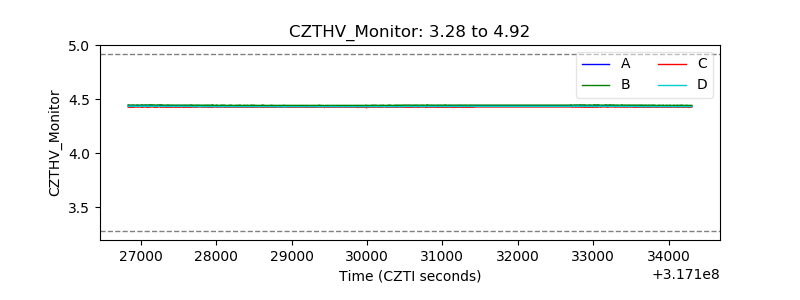 |
| D_VDD | 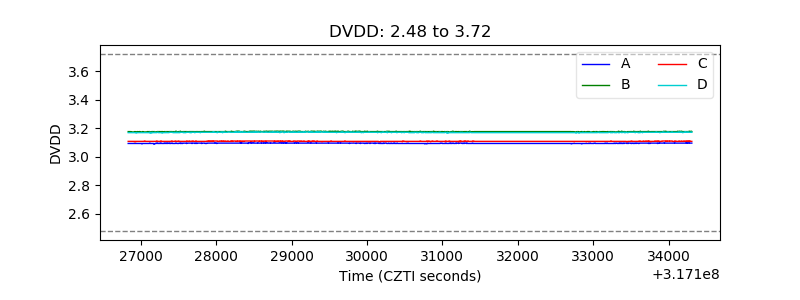 |
| Temperature 1 | 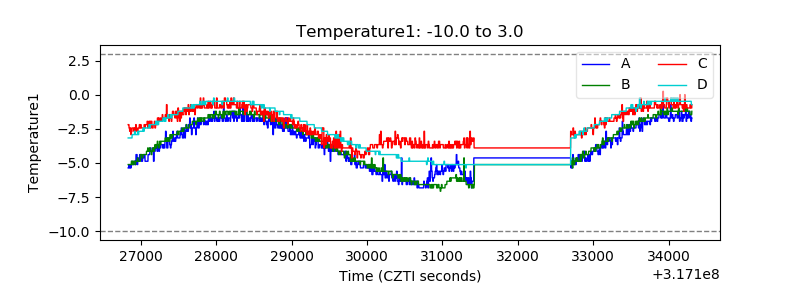 |
| Veto HV Monitor | 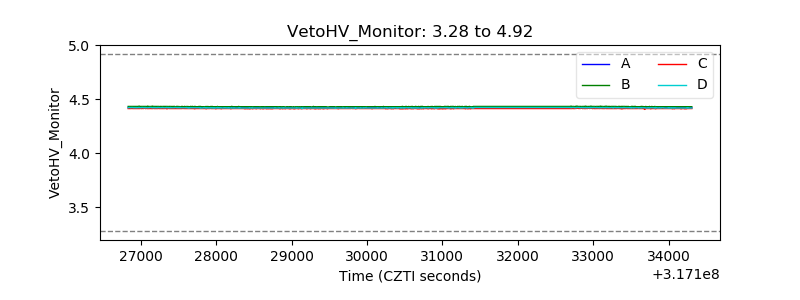 |
| Veto LLD | 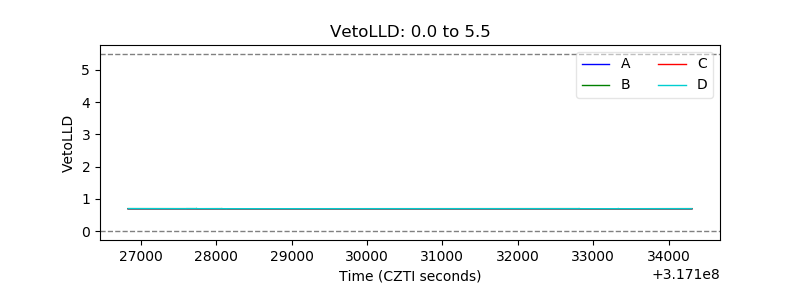 |
| Alpha Counter | 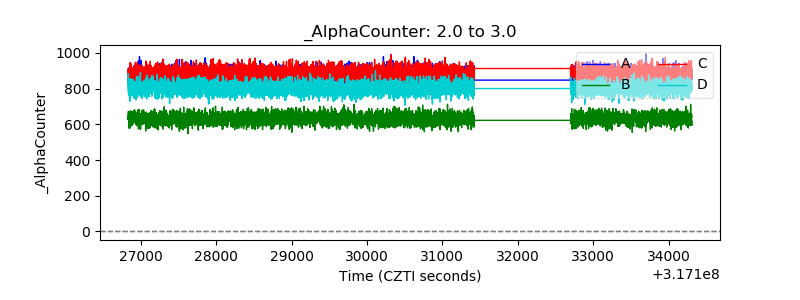 |
| _CPM_Rate | 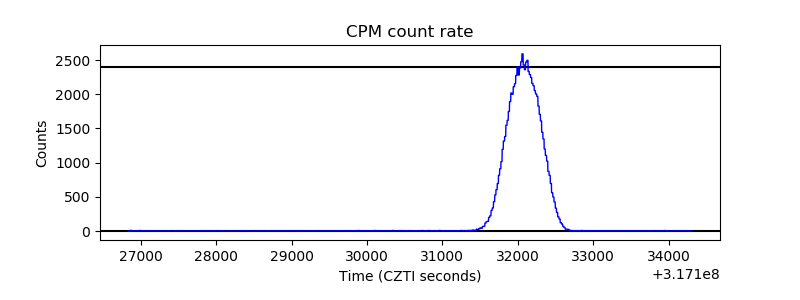 |
| CZT Counter | 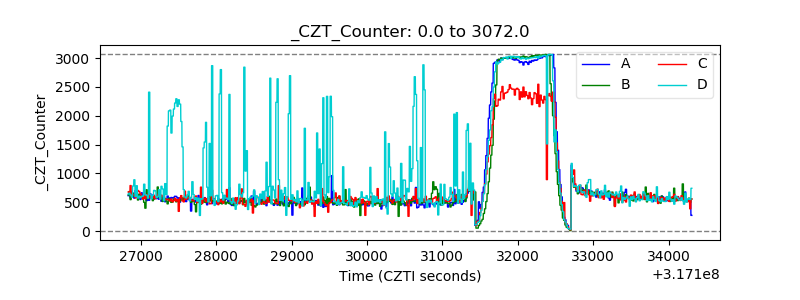 |
| +2.5 Volts monitor |  |
| +5 Volts monitor |  |
| _ROLL_ROT | 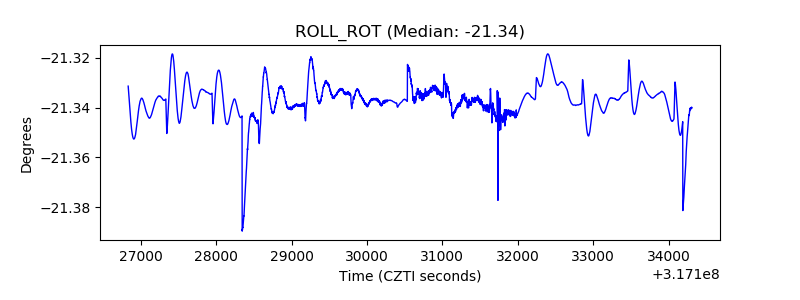 |
| _Roll_DEC | 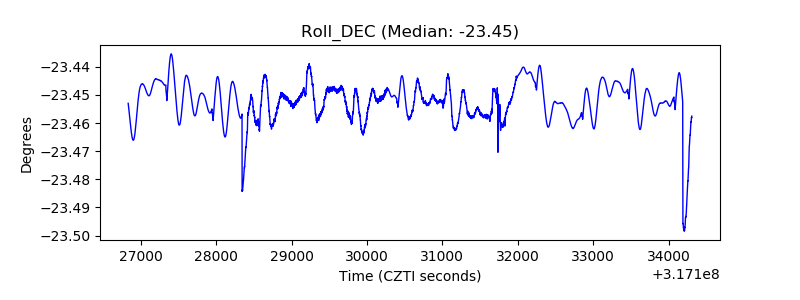 |
| _Roll_RA | 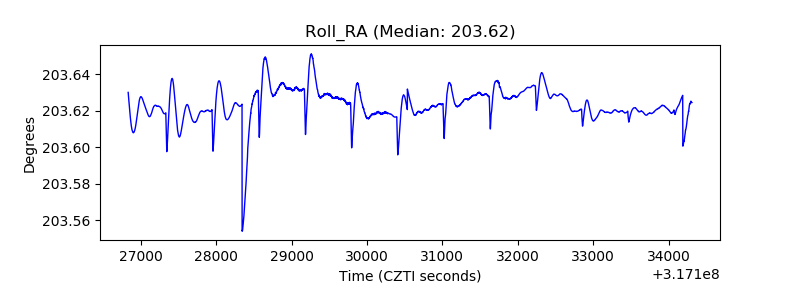 |
| Veto Counter | 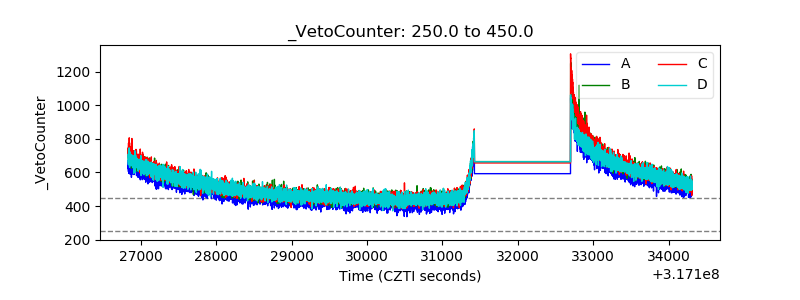 |