| Param | Original file | Final file |
|---|---|---|
| Filename | modeM0/AS1A07_148T02_9000003444_23304cztM0_level2.evt | modeM0/AS1A07_148T02_9000003444_23304cztM0_level2_quad_clean.evt |
| Size (bytes) | 505,463,040 | 62,746,560 |
| Size | 482.0 MB | 59.8 MB |
| Events in quadrant A | 3,422,426 | 378,873 |
| Events in quadrant B | 3,529,809 | 376,060 |
| Events in quadrant C | 3,475,332 | 362,641 |
| Events in quadrant D | 4,458,742 | 347,794 |
| Mode M9 | |||
|---|---|---|---|
| Quadrant | BADHDUFLAG | Total packets | Discarded packets |
| A | 0 | 13 | 0 |
| B | 0 | 13 | 0 |
| C | 0 | 13 | 0 |
| D | 0 | 13 | 0 |
| Mode SS | |||
|---|---|---|---|
| Quadrant | BADHDUFLAG | Total packets | Discarded packets |
| A | 0 | 126 | 0 |
| B | 0 | 126 | 0 |
| C | 0 | 126 | 0 |
| D | 0 | 126 | 0 |
| Mode M0 | |||
|---|---|---|---|
| Quadrant | BADHDUFLAG | Total packets | Discarded packets |
| A | 0 | 13975 | 1 |
| B | 0 | 14306 | 1 |
| C | 0 | 14106 | 1 |
| D | 0 | 17506 | 1 |
| Quadrant | Total seconds | Saturated seconds | Saturation percentage |
|---|---|---|---|
| A | 6220 | 80 | 1.286174% |
| B | 6221 | 113 | 1.816428% |
| C | 6221 | 125 | 2.009323% |
| D | 6221 | 255 | 4.099019% |
Noise dominated data is calculated using 1-second bins in cleaned event files. If a bin has >2000 counts, and if more than 50% of those come from <1% of pixels, then it is considered to be noise-dominated and hence unusable.
| Quadrant | # 1 sec bins | Bins with >0 counts | Bins with >2000 counts | High rate bins dominated by noise | Noise dominated (total time) | Noise dominated (detector-on time) | Marked lightcurve |
|---|---|---|---|---|---|---|---|
| A | 7545 | 6220 | 0 | 0 | 0.00% | 0.00% |  |
| B | 7546 | 6221 | 15 | 15 | 0.20% | 0.24% |  |
| C | 7546 | 6221 | 0 | 0 | 0.00% | 0.00% |  |
| D | 7546 | 6221 | 174 | 174 | 2.31% | 2.80% |  |
Top three noisy pixels from each quadrant. If the there are fewer than three noisy pixels in the level2.evt file, extra rows are filled as -1
| Pixel properties | Quadrant properties | ||||||
|---|---|---|---|---|---|---|---|
| Quadrant | DetID | PixID | Counts | Sigma | Mean | Median | Sigma |
| A | 13 | 254 | 10138 | 52.62 | 888 | 874 | 176.0 |
| A | 0 | 226 | 7961 | 40.26 | 888 | 874 | 176.0 |
| A | 3 | 137 | 7055 | 35.11 | 888 | 874 | 176.0 |
| B | 0 | 229 | 83319 | 508.11 | 872 | 853 | 162.3 |
| B | 0 | 230 | 21527 | 127.38 | 872 | 853 | 162.3 |
| B | 12 | 111 | 18392 | 108.07 | 872 | 853 | 162.3 |
| C | 14 | 238 | 137728 | 709.69 | 842 | 851 | 192.9 |
| C | 10 | 9 | 36878 | 186.8 | 842 | 851 | 192.9 |
| C | 3 | 233 | 6167 | 27.56 | 842 | 851 | 192.9 |
| D | 1 | 52 | 801358 | 3941.45 | 851 | 829 | 203.1 |
| D | 1 | 239 | 255293 | 1252.87 | 851 | 829 | 203.1 |
| D | 12 | 227 | 78489 | 382.36 | 851 | 829 | 203.1 |
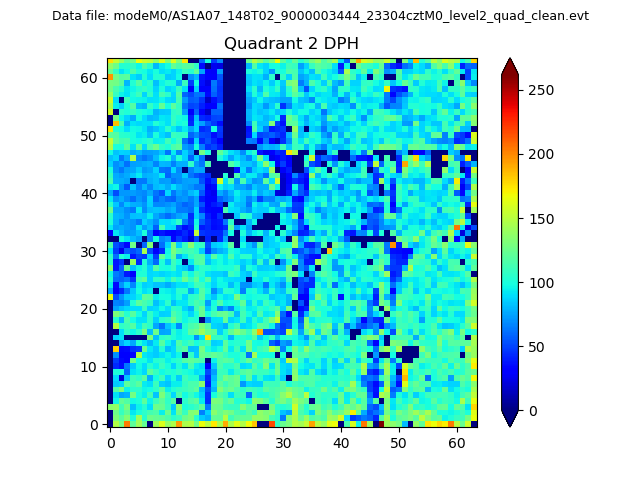
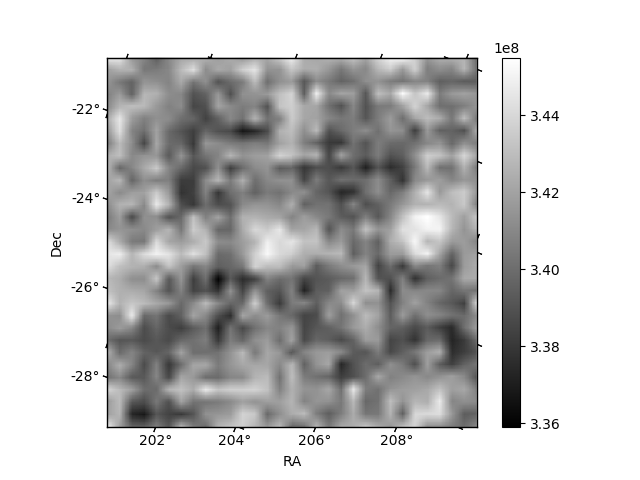
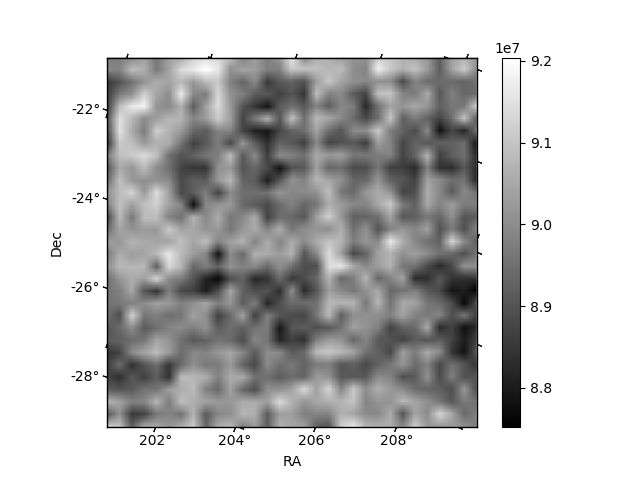
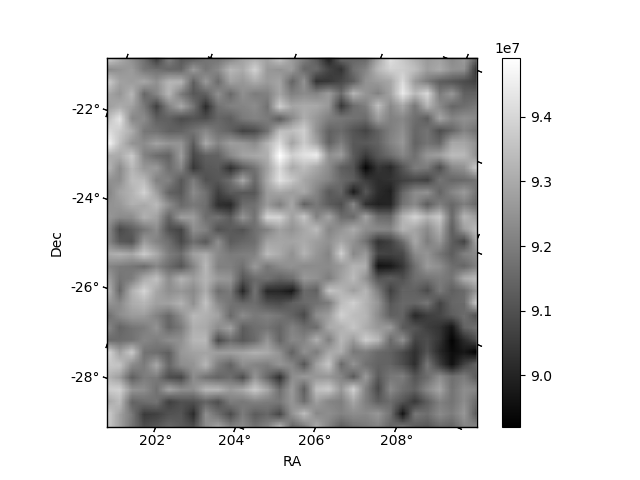
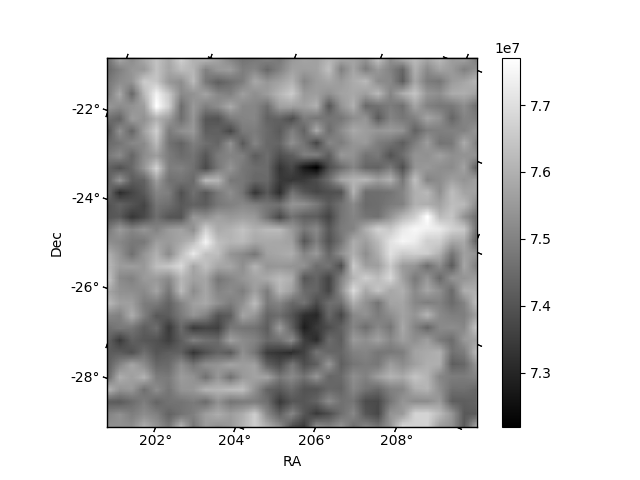
Histogram calculated using DETX and DETY for each event in the final _common_clean file
| Quadrant A | 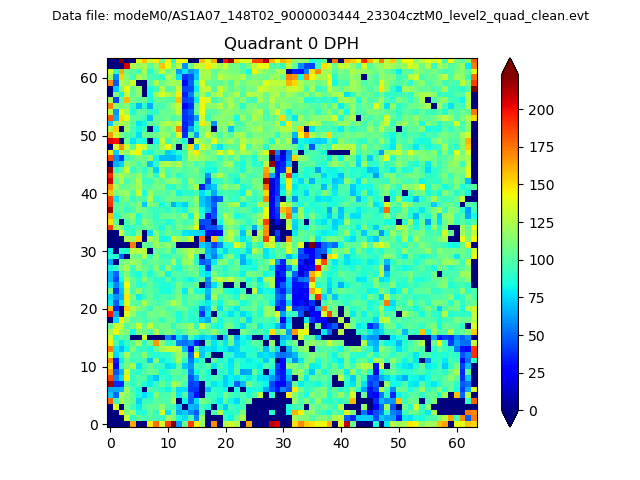 |
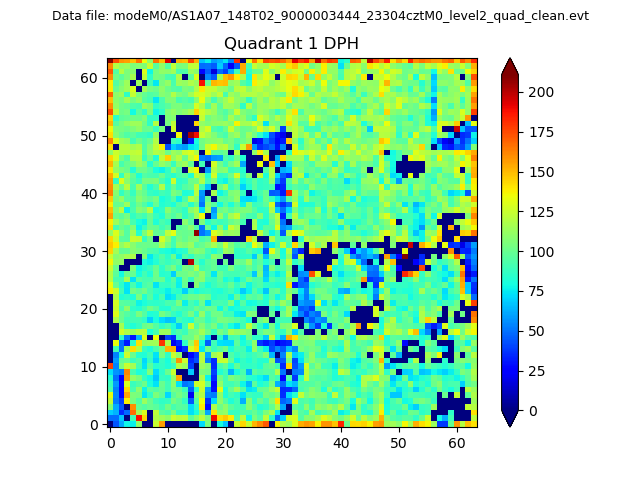 |
Quadrant B |
|---|---|---|---|
| Quadrant D | 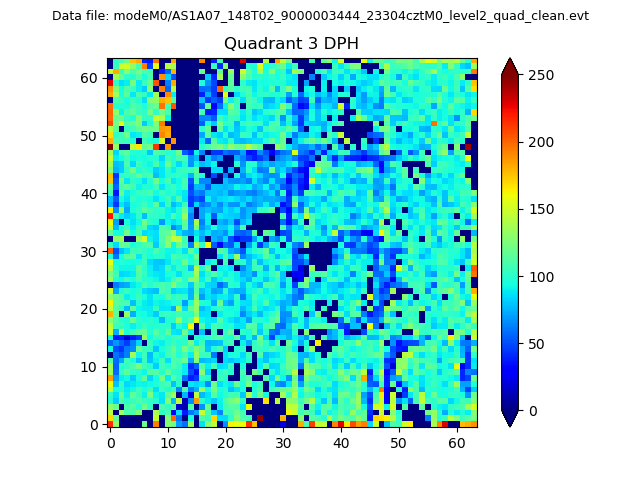 |
 |
Quadrant C |
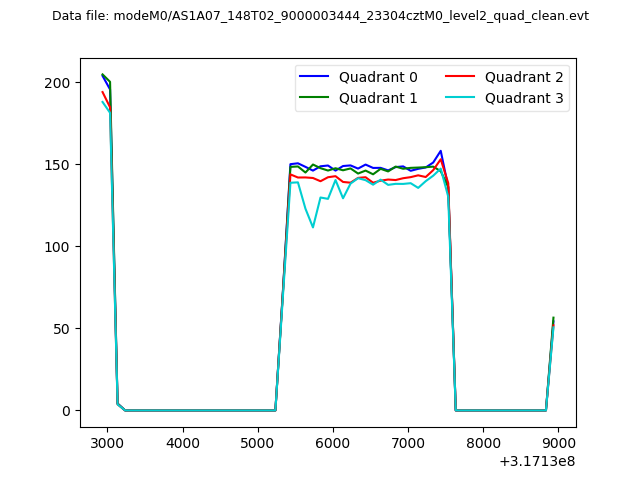
| Plot type | Count rate plots | Images |
|---|---|---|
| Comparison with Poisson distribution Blue bars denote a histogram of data divided into 1 sec bins. Red curve is a Poisson curve with rate = median count rate of data. |
 |
 |
| Quadrant-wise count rates Data is divided into 100 sec bins |
 |
|
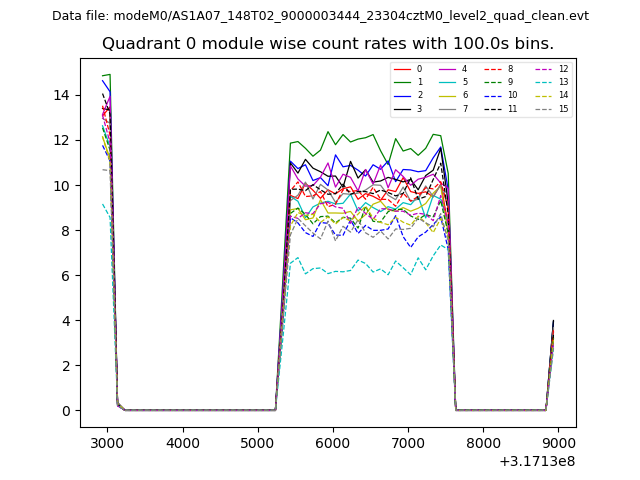
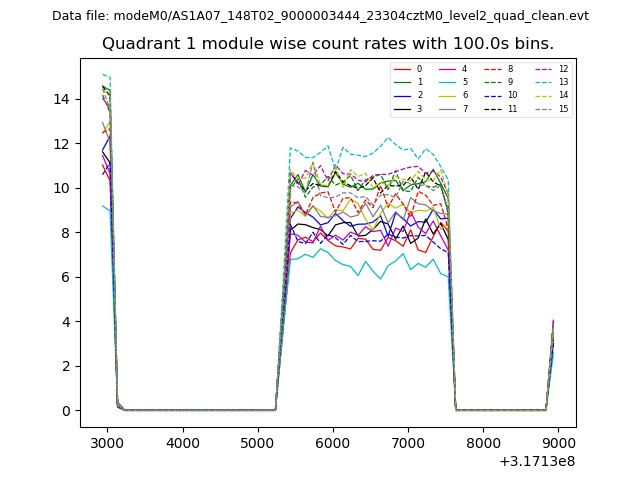
| Module-wise count rates for Quadrant A Data is divided into 100 sec bins |
 |
 |
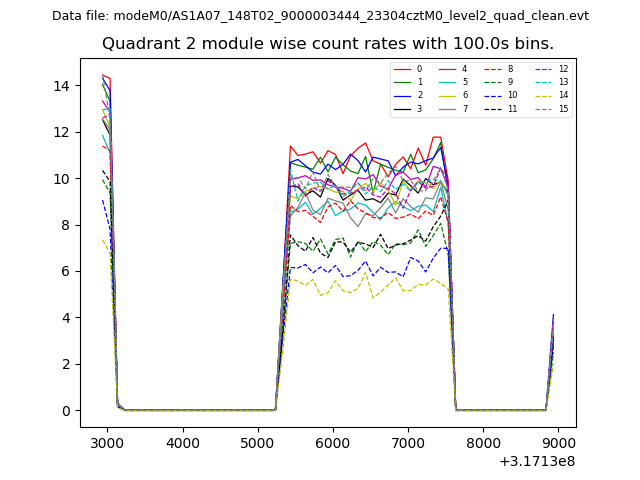
| Module-wise count rates for Quadrant B Data is divided into 100 sec bins |
 |
 |
| Module-wise count rates for Quadrant C Data is divided into 100 sec bins |
 |
 |
| Module-wise count rates for Quadrant D Data is divided into 100 sec bins |
 |
 |
| Parameter | Plot |
|---|---|
| CZT HV Monitor | 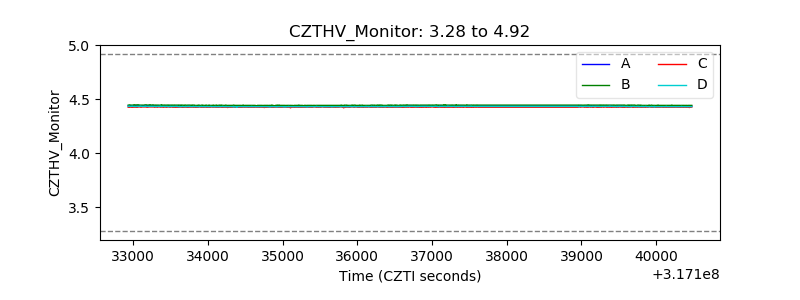 |
| D_VDD | 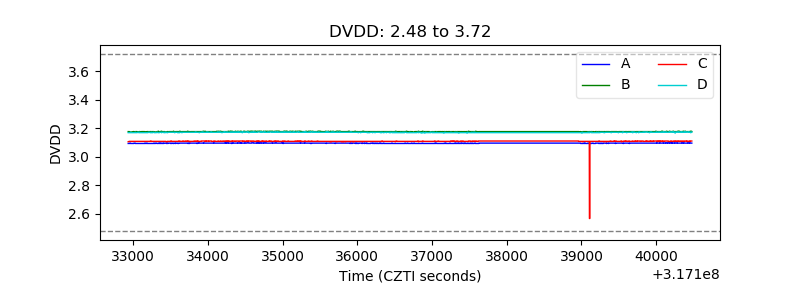 |
| Temperature 1 | 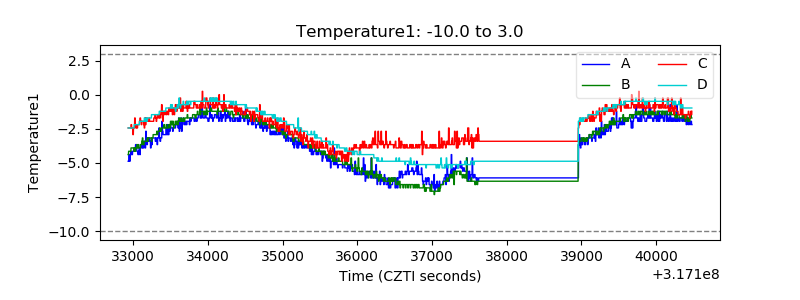 |
| Veto HV Monitor | 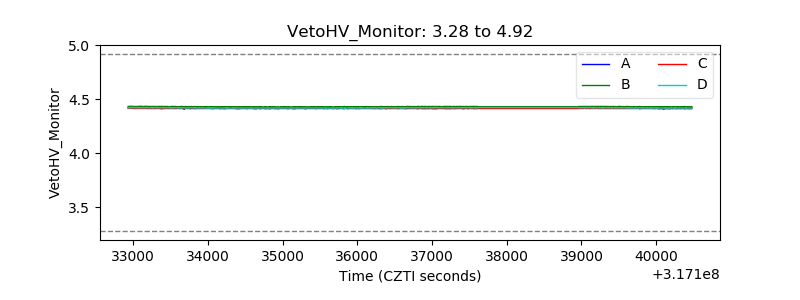 |
| Veto LLD | 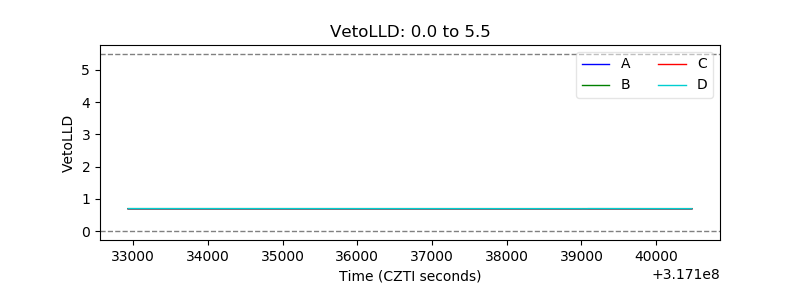 |
| Alpha Counter | 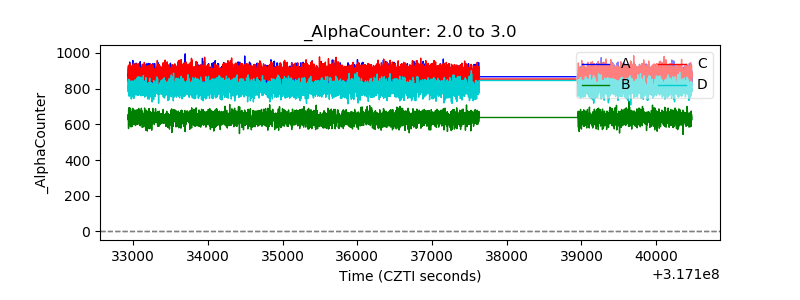 |
| _CPM_Rate | 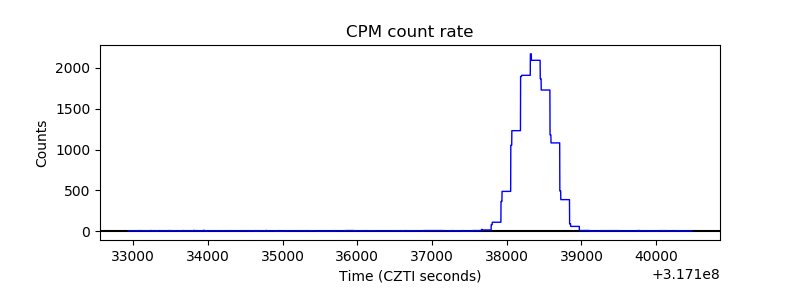 |
| CZT Counter | 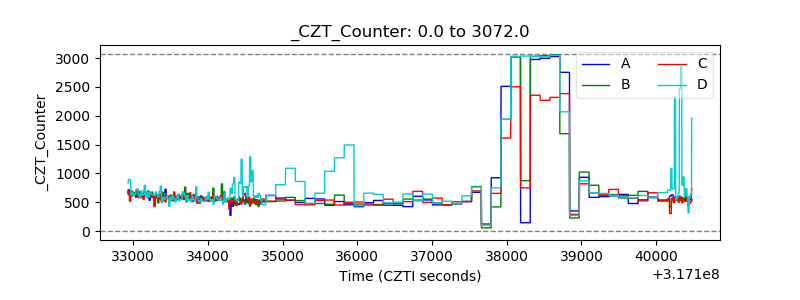 |
| +2.5 Volts monitor |  |
| +5 Volts monitor |  |
| _ROLL_ROT | 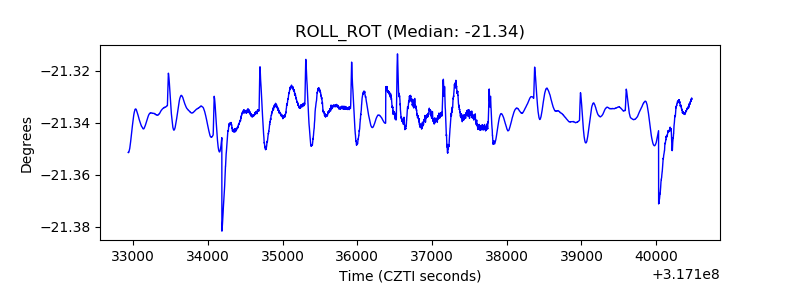 |
| _Roll_DEC | 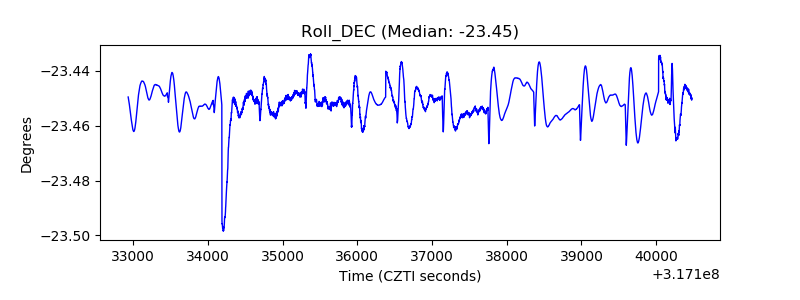 |
| _Roll_RA | 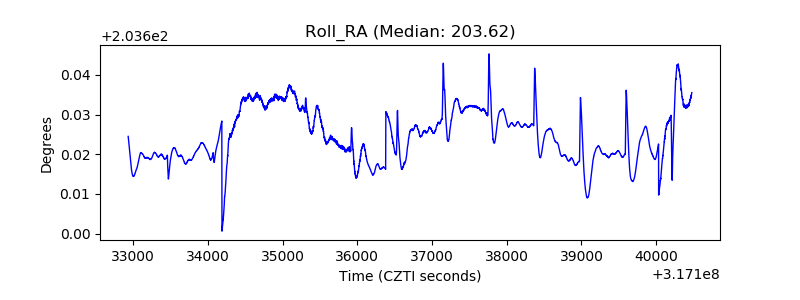 |
| Veto Counter |  |