| Param | Original file | Final file |
|---|---|---|
| Filename | modeM0/AS1A07_148T02_9000003444_23305cztM0_level2.evt | modeM0/AS1A07_148T02_9000003444_23305cztM0_level2_quad_clean.evt |
| Size (bytes) | 510,681,600 | 65,695,680 |
| Size | 487.0 MB | 62.7 MB |
| Events in quadrant A | 3,406,619 | 396,378 |
| Events in quadrant B | 3,434,616 | 398,750 |
| Events in quadrant C | 3,448,603 | 381,700 |
| Events in quadrant D | 4,749,372 | 373,006 |
| Mode M9 | |||
|---|---|---|---|
| Quadrant | BADHDUFLAG | Total packets | Discarded packets |
| A | 0 | 13 | 0 |
| B | 0 | 13 | 0 |
| C | 0 | 13 | 0 |
| D | 0 | 13 | 0 |
| Mode SS | |||
|---|---|---|---|
| Quadrant | BADHDUFLAG | Total packets | Discarded packets |
| A | 0 | 128 | 0 |
| B | 0 | 128 | 0 |
| C | 0 | 128 | 0 |
| D | 0 | 128 | 0 |
| Mode M0 | |||
|---|---|---|---|
| Quadrant | BADHDUFLAG | Total packets | Discarded packets |
| A | 0 | 13885 | 1 |
| B | 0 | 13917 | 1 |
| C | 0 | 13962 | 1 |
| D | 0 | 18431 | 1 |
| Quadrant | Total seconds | Saturated seconds | Saturation percentage |
|---|---|---|---|
| A | 6289 | 127 | 2.019399% |
| B | 6290 | 133 | 2.114467% |
| C | 6290 | 164 | 2.607313% |
| D | 6290 | 301 | 4.785374% |
Noise dominated data is calculated using 1-second bins in cleaned event files. If a bin has >2000 counts, and if more than 50% of those come from <1% of pixels, then it is considered to be noise-dominated and hence unusable.
| Quadrant | # 1 sec bins | Bins with >0 counts | Bins with >2000 counts | High rate bins dominated by noise | Noise dominated (total time) | Noise dominated (detector-on time) | Marked lightcurve |
|---|---|---|---|---|---|---|---|
| A | 7549 | 6289 | 0 | 0 | 0.00% | 0.00% | 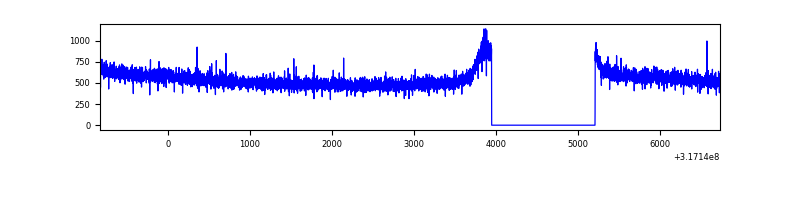 |
| B | 7550 | 6290 | 0 | 0 | 0.00% | 0.00% | 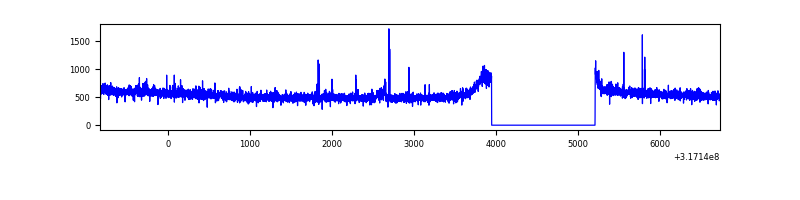 |
| C | 7550 | 6290 | 1 | 1 | 0.01% | 0.02% | 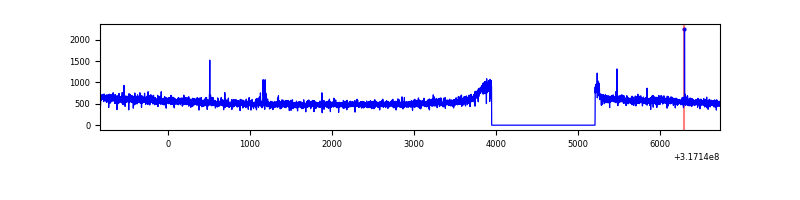 |
| D | 7550 | 6290 | 189 | 189 | 2.50% | 3.00% | 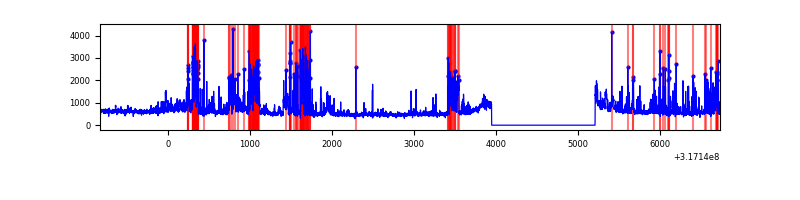 |
Top three noisy pixels from each quadrant. If the there are fewer than three noisy pixels in the level2.evt file, extra rows are filled as -1
| Pixel properties | Quadrant properties | ||||||
|---|---|---|---|---|---|---|---|
| Quadrant | DetID | PixID | Counts | Sigma | Mean | Median | Sigma |
| A | 13 | 254 | 10443 | 54.66 | 883 | 868 | 175.2 |
| A | 0 | 226 | 7861 | 39.92 | 883 | 868 | 175.2 |
| A | 3 | 137 | 7159 | 35.92 | 883 | 868 | 175.2 |
| B | 12 | 111 | 18571 | 108.42 | 869 | 851 | 163.4 |
| B | 11 | 111 | 16344 | 94.79 | 869 | 851 | 163.4 |
| B | 0 | 230 | 14641 | 84.37 | 869 | 851 | 163.4 |
| C | 14 | 238 | 134675 | 696.61 | 834 | 842 | 192.1 |
| C | 10 | 9 | 23492 | 117.9 | 834 | 842 | 192.1 |
| C | 7 | 247 | 13115 | 63.88 | 834 | 842 | 192.1 |
| D | 1 | 52 | 773299 | 3765.36 | 845 | 821 | 205.2 |
| D | 7 | 238 | 505931 | 2462.11 | 845 | 821 | 205.2 |
| D | 1 | 239 | 105255 | 509.05 | 845 | 821 | 205.2 |
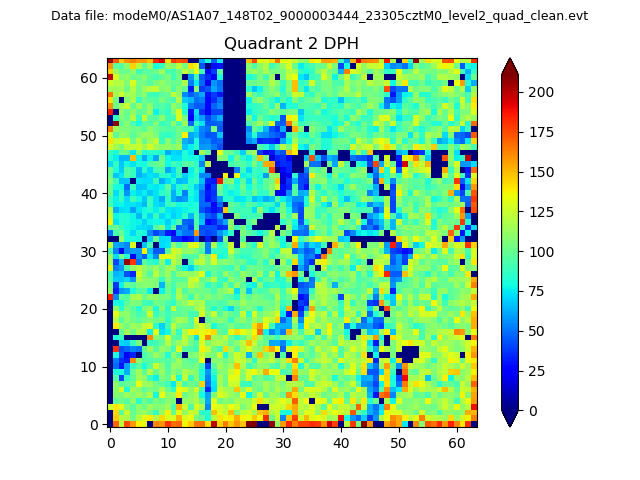
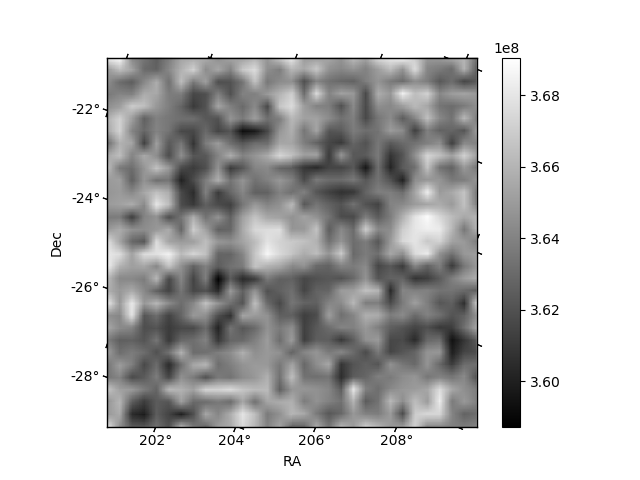
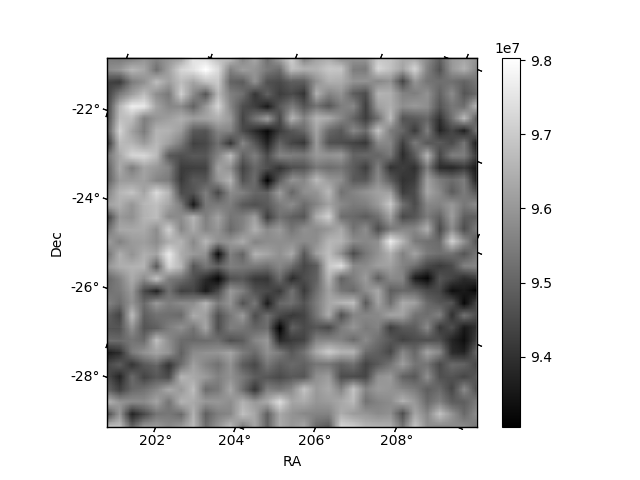
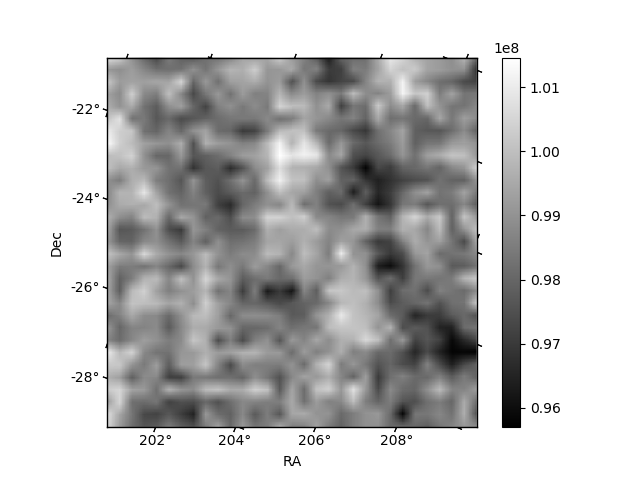
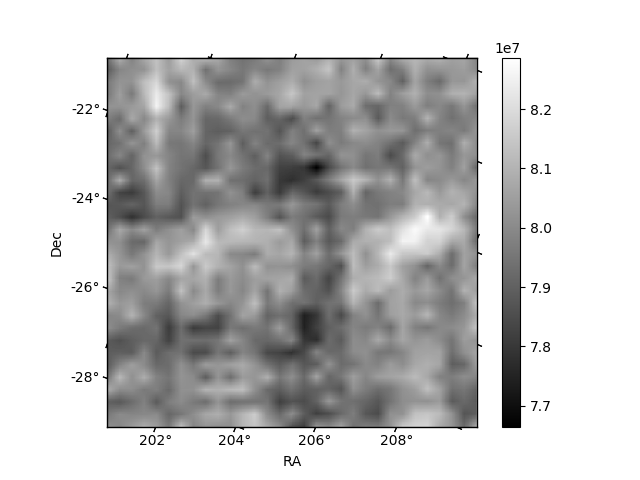
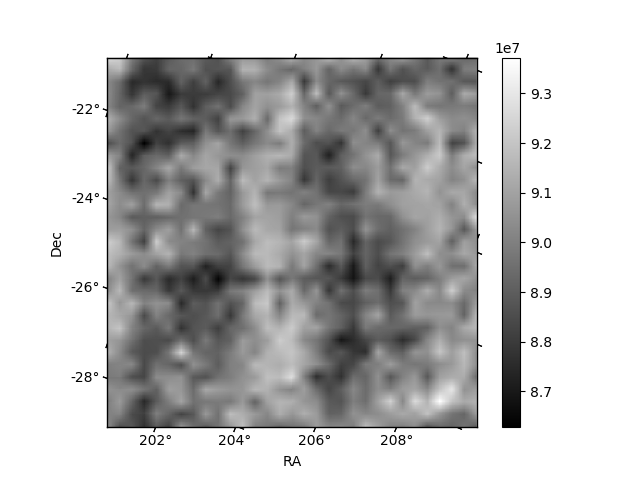
Histogram calculated using DETX and DETY for each event in the final _common_clean file
| Quadrant A | 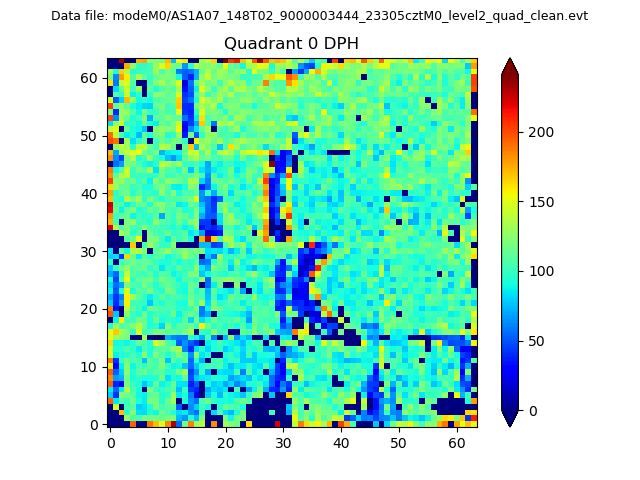 |
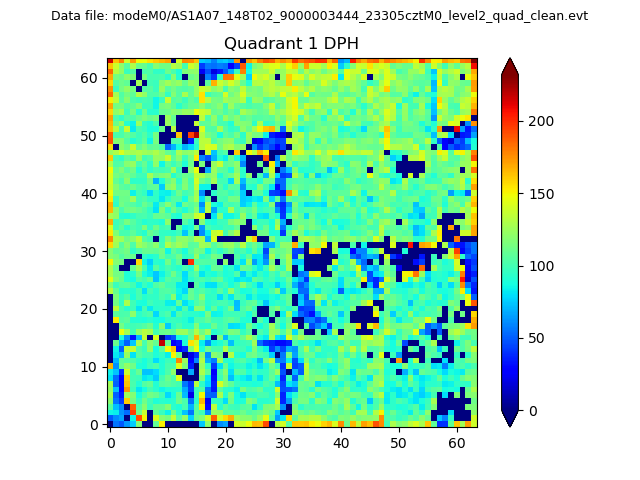 |
Quadrant B |
|---|---|---|---|
| Quadrant D | 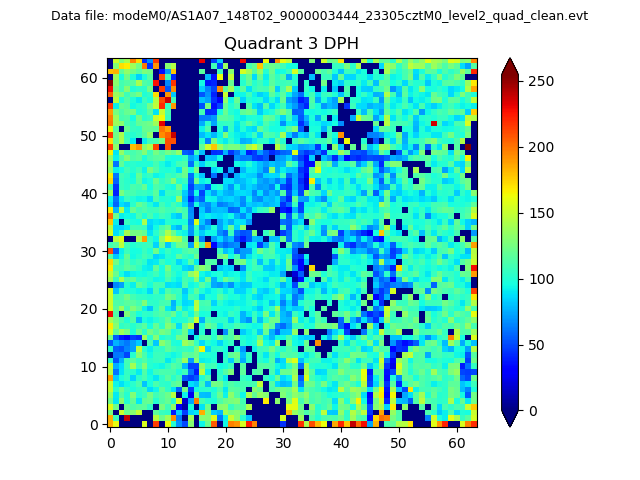 |
 |
Quadrant C |
| Plot type | Count rate plots | Images |
|---|---|---|
| Comparison with Poisson distribution Blue bars denote a histogram of data divided into 1 sec bins. Red curve is a Poisson curve with rate = median count rate of data. |
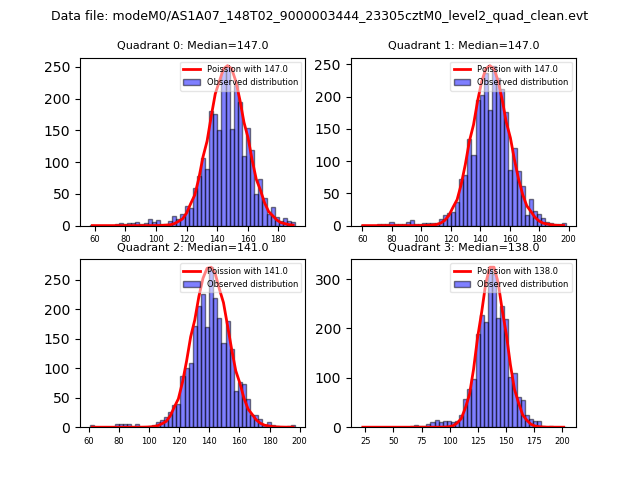 |
 |
| Quadrant-wise count rates Data is divided into 100 sec bins |
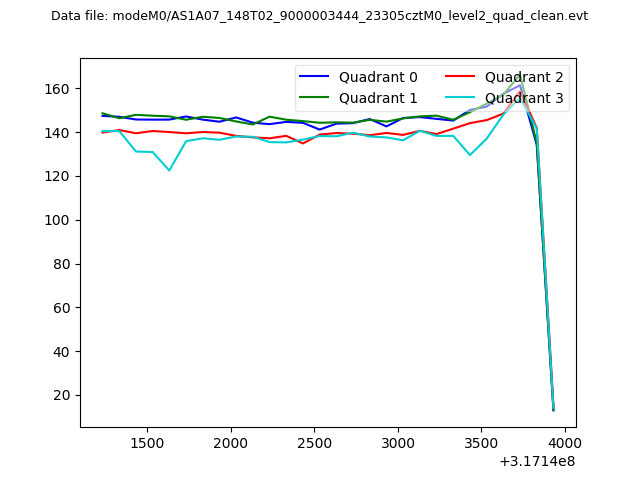 |
|
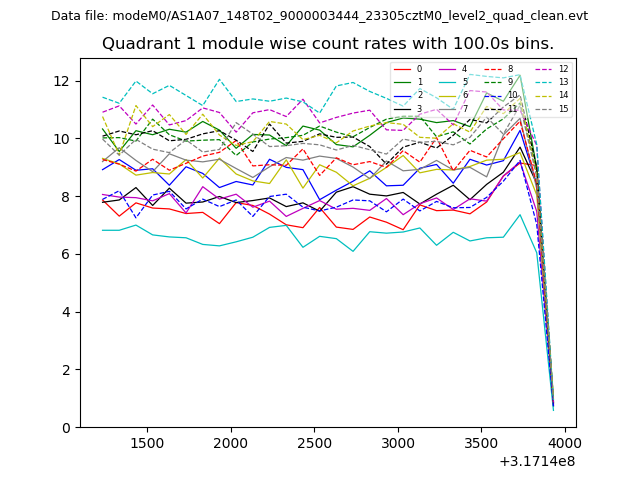
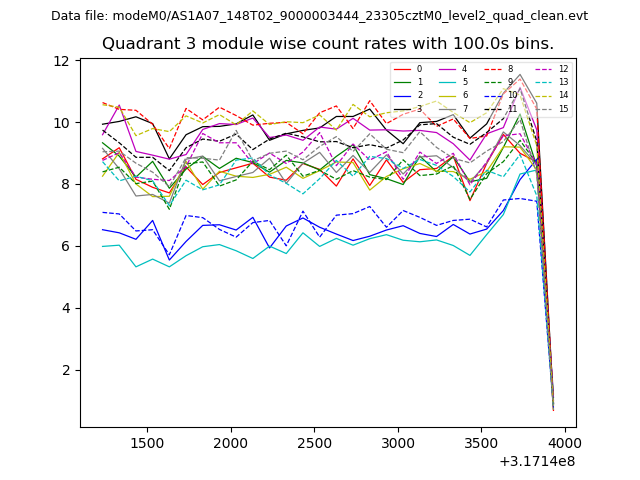
| Module-wise count rates for Quadrant A Data is divided into 100 sec bins |
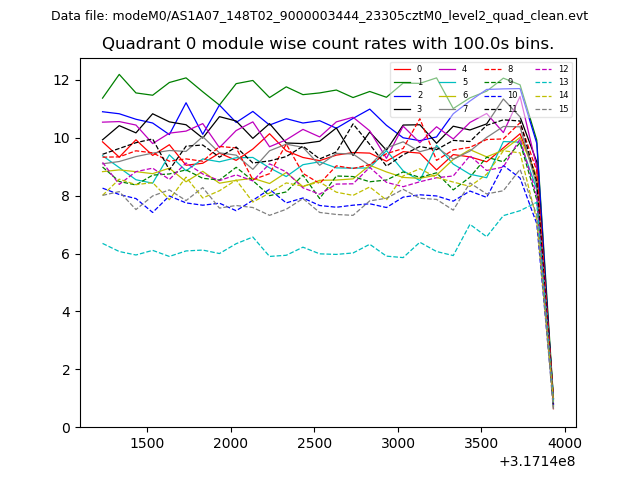 |
 |
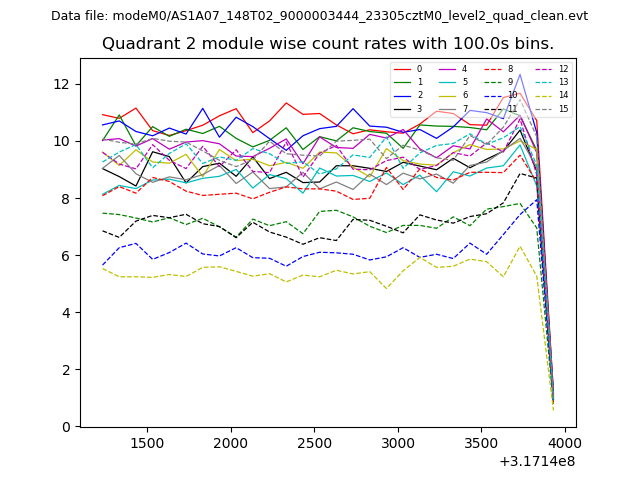
| Module-wise count rates for Quadrant B Data is divided into 100 sec bins |
 |
 |
| Module-wise count rates for Quadrant C Data is divided into 100 sec bins |
 |
 |
| Module-wise count rates for Quadrant D Data is divided into 100 sec bins |
 |
 |
| Parameter | Plot |
|---|---|
| CZT HV Monitor |  |
| D_VDD | 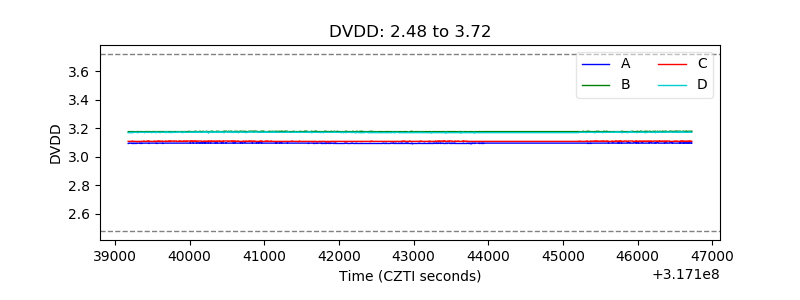 |
| Temperature 1 |  |
| Veto HV Monitor | 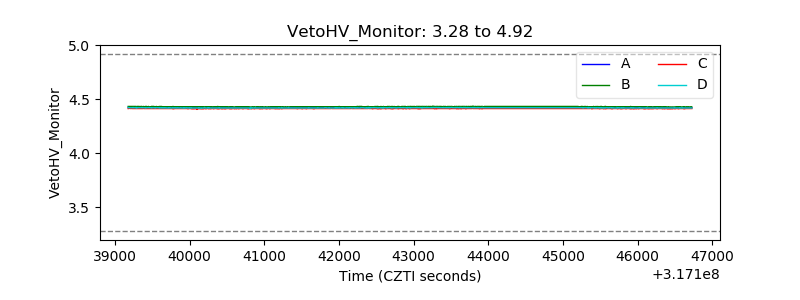 |
| Veto LLD | 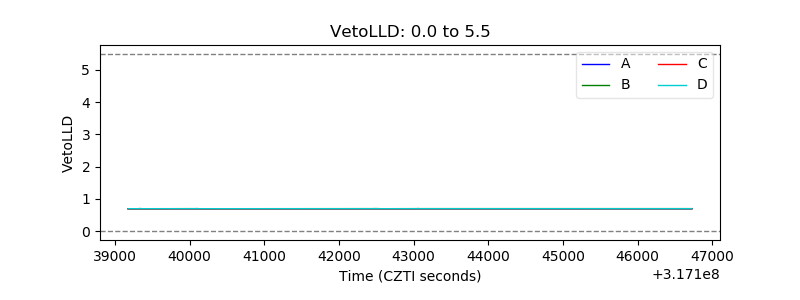 |
| Alpha Counter | 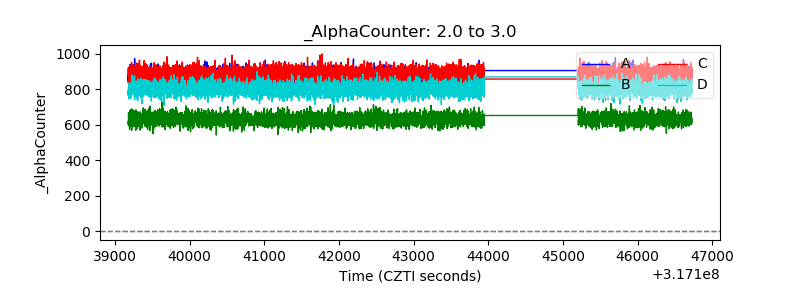 |
| _CPM_Rate | 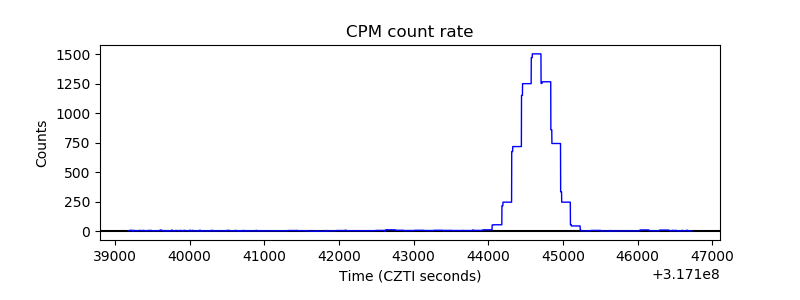 |
| CZT Counter | 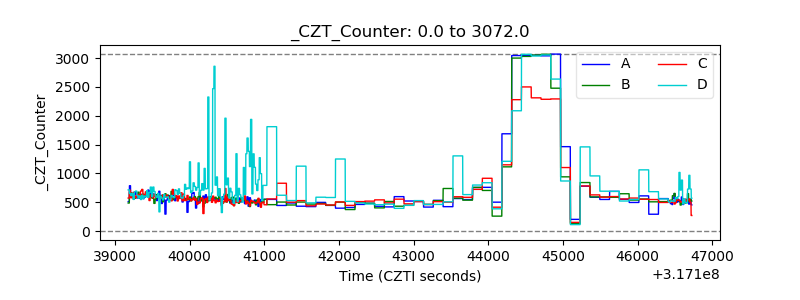 |
| +2.5 Volts monitor |  |
| +5 Volts monitor | 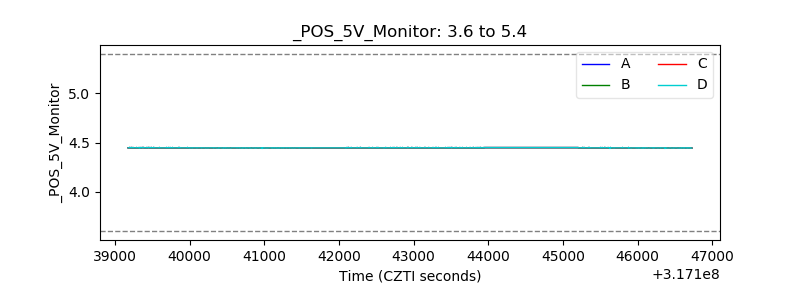 |
| _ROLL_ROT |  |
| _Roll_DEC | 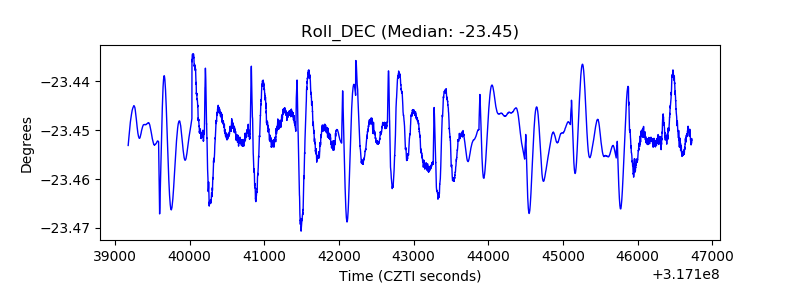 |
| _Roll_RA | 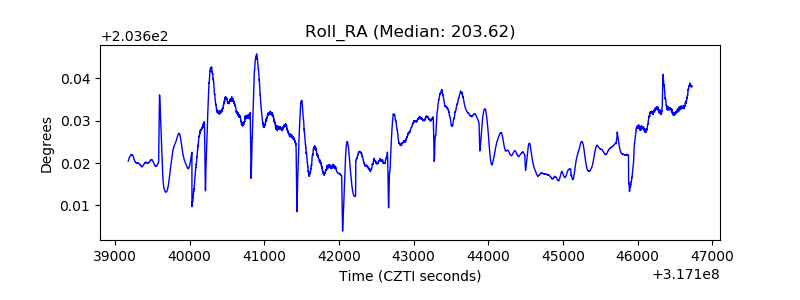 |
| Veto Counter |  |