| Param | Original file | Final file |
|---|---|---|
| Filename | modeM0/AS1A07_148T02_9000003444_23306cztM0_level2.evt | modeM0/AS1A07_148T02_9000003444_23306cztM0_level2_quad_clean.evt |
| Size (bytes) | 132,137,280 | 16,966,080 |
| Size | 126.0 MB | 16.2 MB |
| Events in quadrant A | 908,047 | 94,019 |
| Events in quadrant B | 910,265 | 90,544 |
| Events in quadrant C | 926,969 | 86,290 |
| Events in quadrant D | 1,132,693 | 112,299 |
| Mode M9 | |||
|---|---|---|---|
| Quadrant | BADHDUFLAG | Total packets | Discarded packets |
| A | 0 | 9 | 6 |
| B | 0 | 11 | 9 |
| C | 0 | 10 | 8 |
| D | 0 | 9 | 6 |
| Mode SS | |||
|---|---|---|---|
| Quadrant | BADHDUFLAG | Total packets | Discarded packets |
| A | 0 | 96 | 60 |
| B | 0 | 97 | 57 |
| C | 0 | 102 | 72 |
| D | 0 | 99 | 61 |
| Mode M0 | |||
|---|---|---|---|
| Quadrant | BADHDUFLAG | Total packets | Discarded packets |
| A | 0 | 10580 | 6886 |
| B | 0 | 10599 | 6911 |
| C | 0 | 10946 | 7222 |
| D | 0 | 13260 | 8818 |
| Quadrant | Total seconds | Saturated seconds | Saturation percentage |
|---|---|---|---|
| A | 1798 | 3 | 0.166852% |
| B | 1792 | 1 | 0.055804% |
| C | 1751 | 21 | 1.199315% |
| D | 1727 | 12 | 0.694847% |
Noise dominated data is calculated using 1-second bins in cleaned event files. If a bin has >2000 counts, and if more than 50% of those come from <1% of pixels, then it is considered to be noise-dominated and hence unusable.
| Quadrant | # 1 sec bins | Bins with >0 counts | Bins with >2000 counts | High rate bins dominated by noise | Noise dominated (total time) | Noise dominated (detector-on time) | Marked lightcurve |
|---|---|---|---|---|---|---|---|
| A | 6774 | 2225 | 0 | 0 | 0.00% | 0.00% | 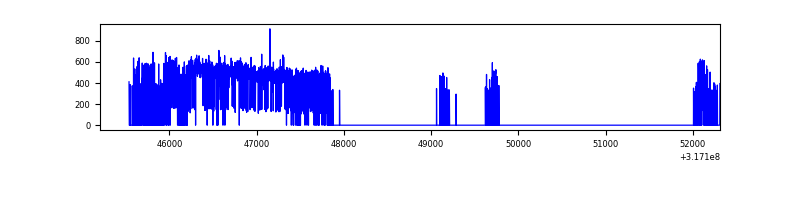 |
| B | 6778 | 2217 | 0 | 0 | 0.00% | 0.00% | 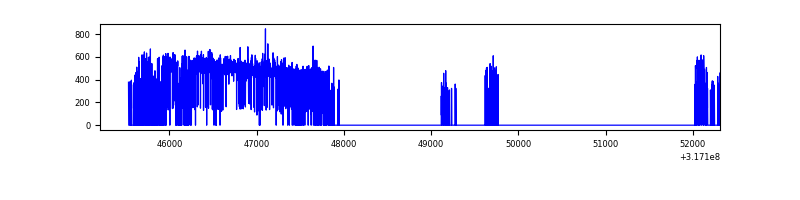 |
| C | 7083 | 2180 | 6 | 6 | 0.08% | 0.28% | 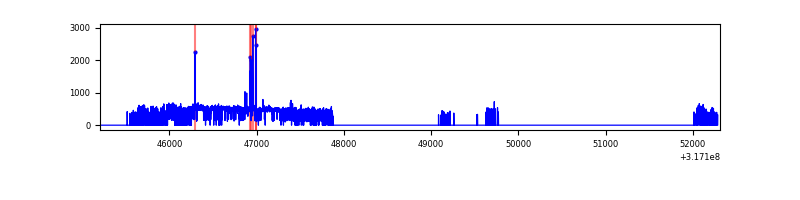 |
| D | 6745 | 2152 | 7 | 7 | 0.10% | 0.33% | 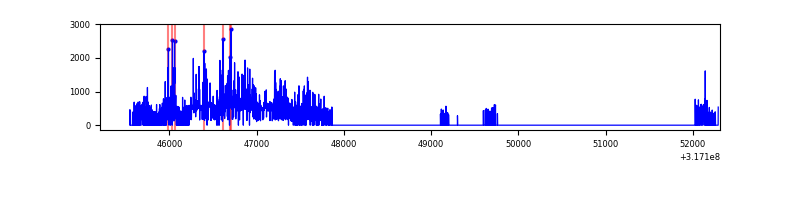 |
Top three noisy pixels from each quadrant. If the there are fewer than three noisy pixels in the level2.evt file, extra rows are filled as -1
| Pixel properties | Quadrant properties | ||||||
|---|---|---|---|---|---|---|---|
| Quadrant | DetID | PixID | Counts | Sigma | Mean | Median | Sigma |
| A | 13 | 254 | 3133 | 59.5 | 234 | 230 | 48.8 |
| A | 0 | 226 | 2172 | 39.8 | 234 | 230 | 48.8 |
| A | 3 | 137 | 1908 | 34.39 | 234 | 230 | 48.8 |
| B | 12 | 111 | 4850 | 102.42 | 232 | 227 | 45.1 |
| B | 11 | 111 | 4465 | 93.89 | 232 | 227 | 45.1 |
| B | 0 | 190 | 4409 | 92.65 | 232 | 227 | 45.1 |
| C | 14 | 238 | 34598 | 678.53 | 214 | 216 | 50.7 |
| C | 0 | 239 | 26966 | 527.91 | 214 | 216 | 50.7 |
| C | 10 | 9 | 20045 | 391.33 | 214 | 216 | 50.7 |
| D | 7 | 238 | 157557 | 2921.57 | 216 | 210 | 53.9 |
| D | 1 | 239 | 50611 | 935.83 | 216 | 210 | 53.9 |
| D | 1 | 52 | 45716 | 844.94 | 216 | 210 | 53.9 |
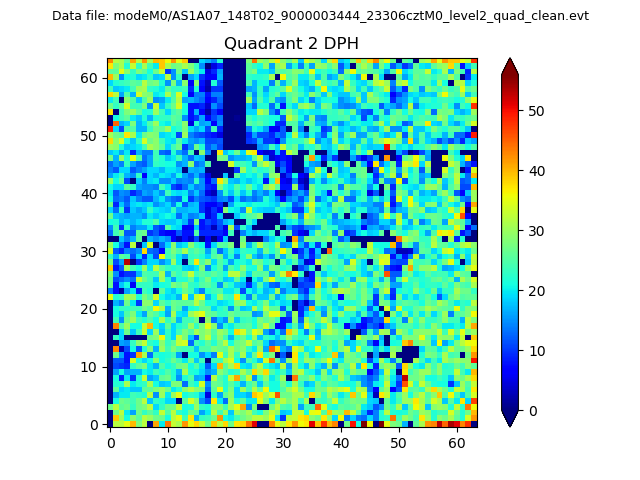
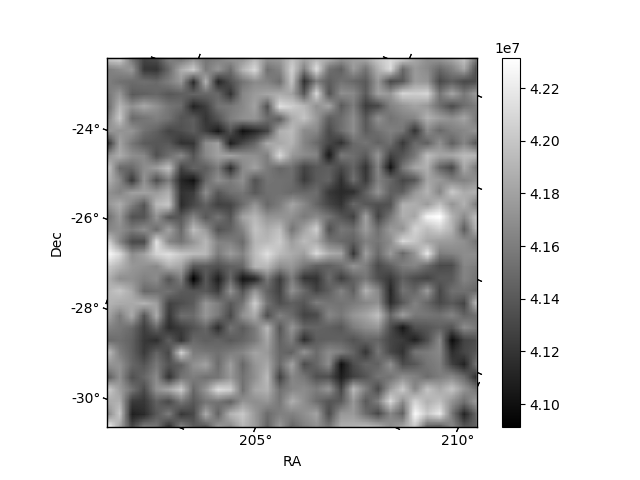
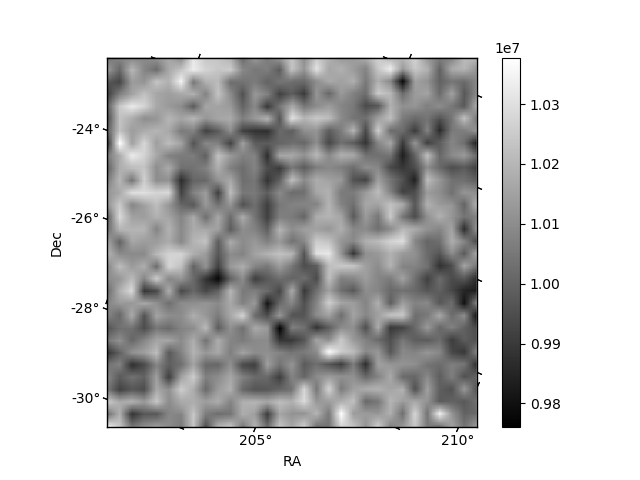
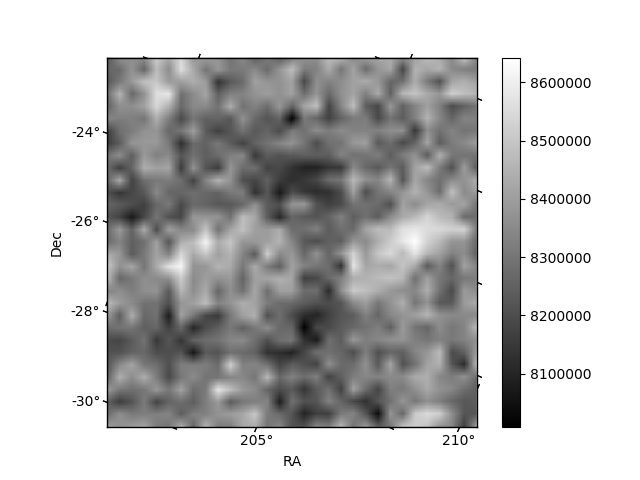
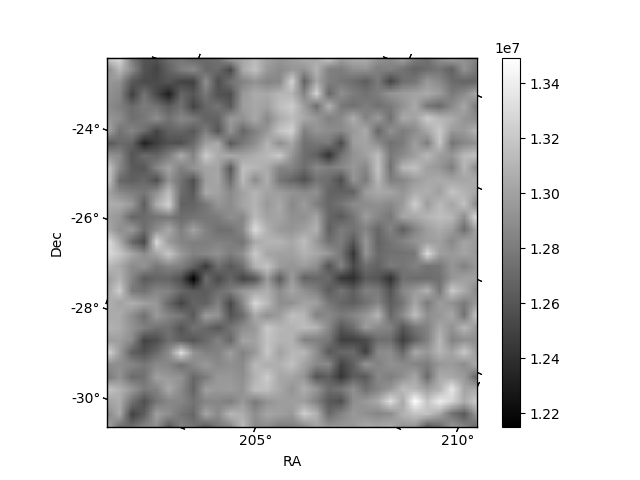
Histogram calculated using DETX and DETY for each event in the final _common_clean file
| Quadrant A | 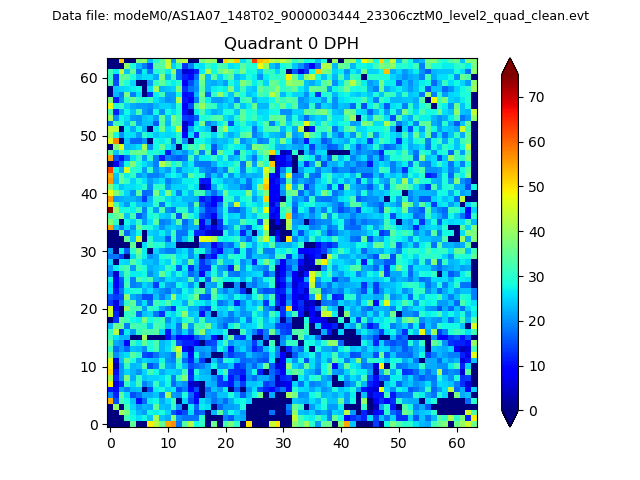 |
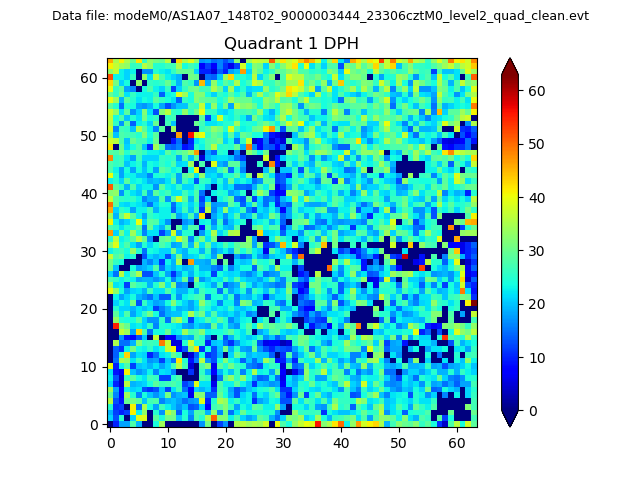 |
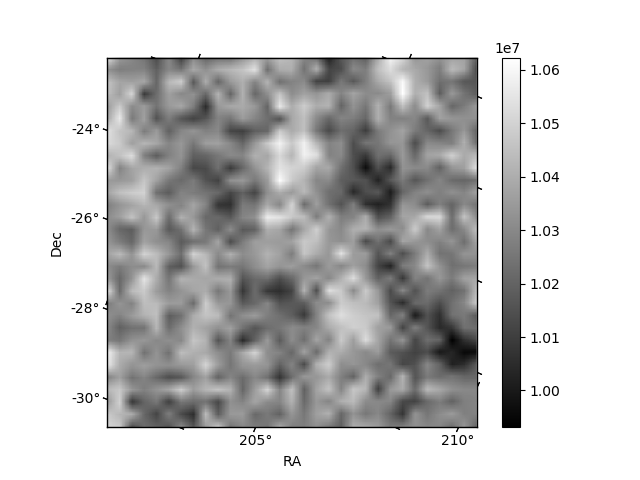
Quadrant B |
|---|---|---|---|
| Quadrant D | 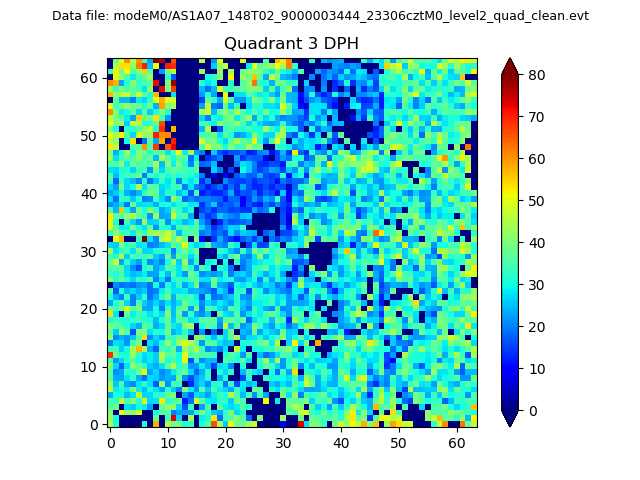 |
 |
Quadrant C |
| Plot type | Count rate plots | Images |
|---|---|---|
| Comparison with Poisson distribution Blue bars denote a histogram of data divided into 1 sec bins. Red curve is a Poisson curve with rate = median count rate of data. |
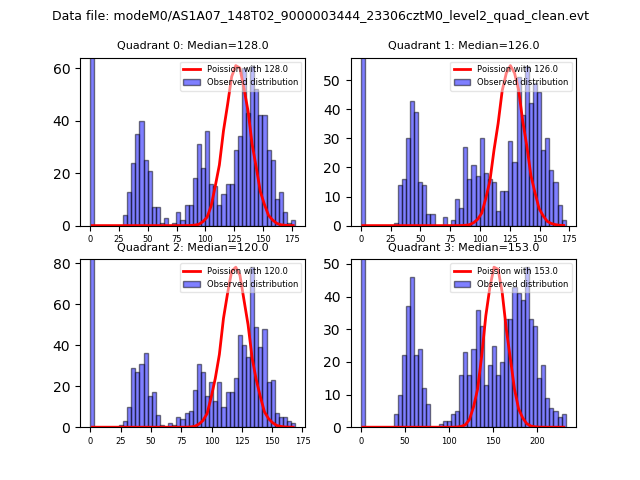 |
 |
| Quadrant-wise count rates Data is divided into 100 sec bins |
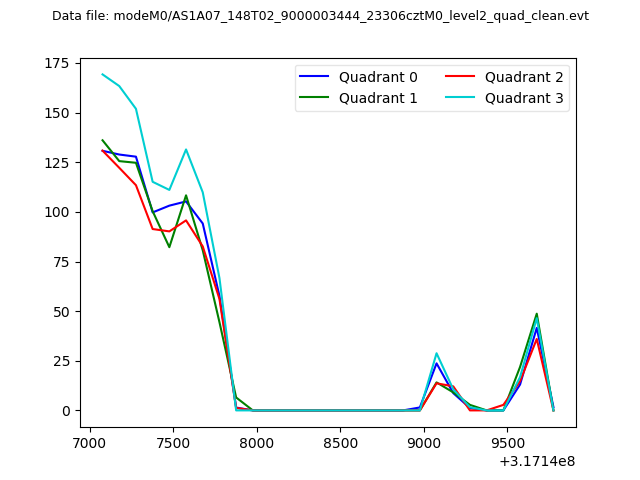 |
|
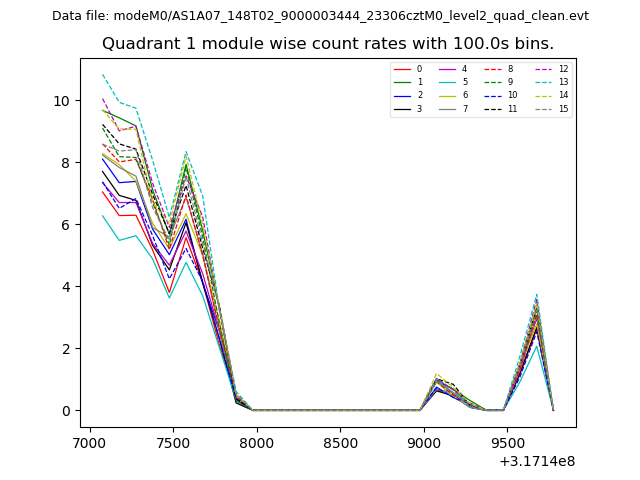
| Module-wise count rates for Quadrant A Data is divided into 100 sec bins |
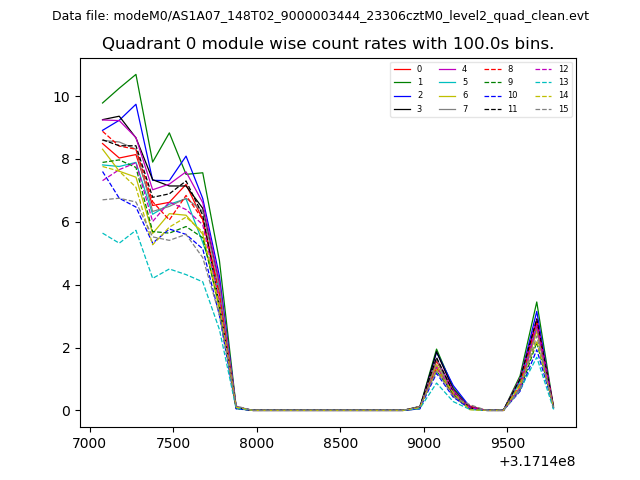 |
 |
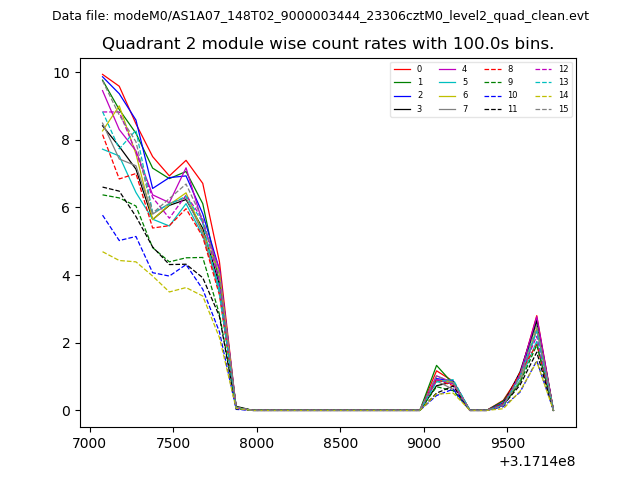
| Module-wise count rates for Quadrant B Data is divided into 100 sec bins |
 |
 |
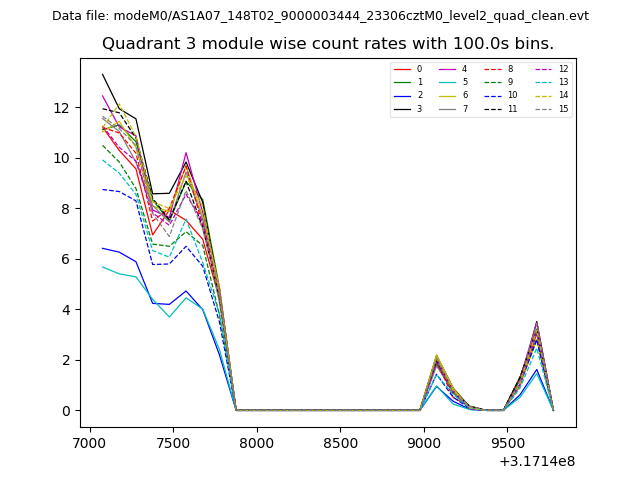
| Module-wise count rates for Quadrant C Data is divided into 100 sec bins |
 |
 |
| Module-wise count rates for Quadrant D Data is divided into 100 sec bins |
 |
 |
| Parameter | Plot |
|---|---|
| CZT HV Monitor | 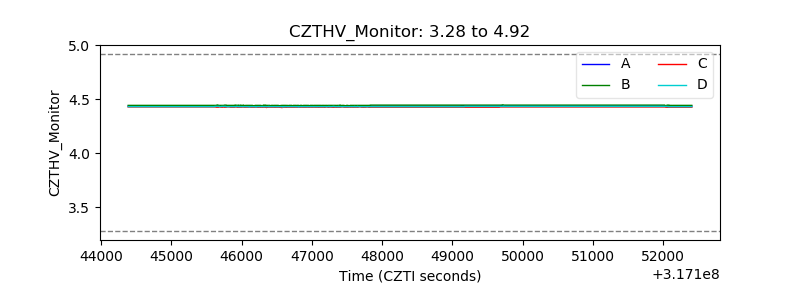 |
| D_VDD | 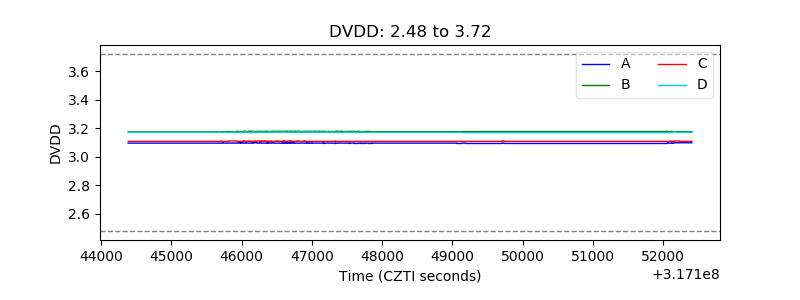 |
| Temperature 1 | 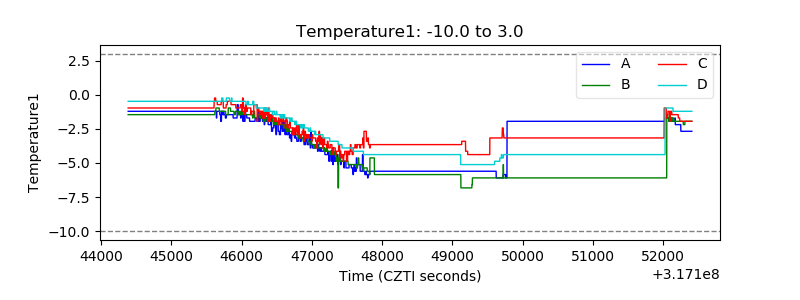 |
| Veto HV Monitor | 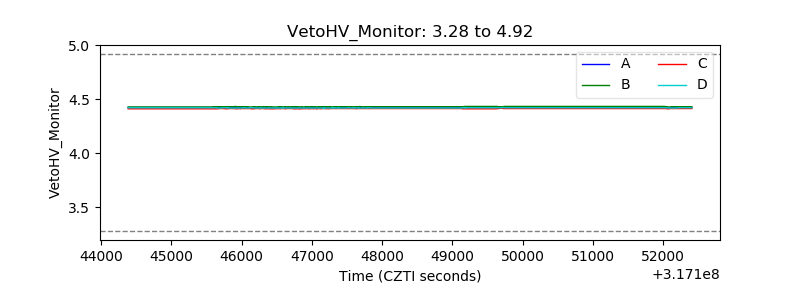 |
| Veto LLD |  |
| Alpha Counter | 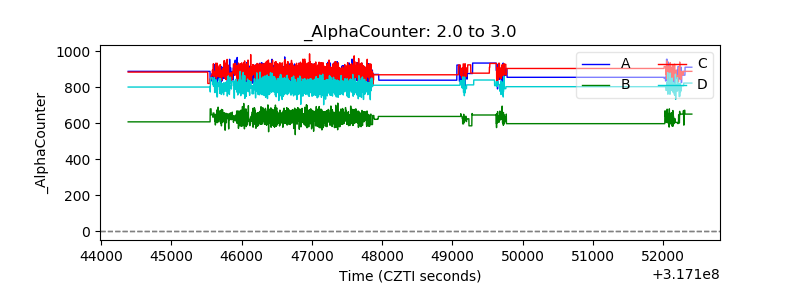 |
| _CPM_Rate | 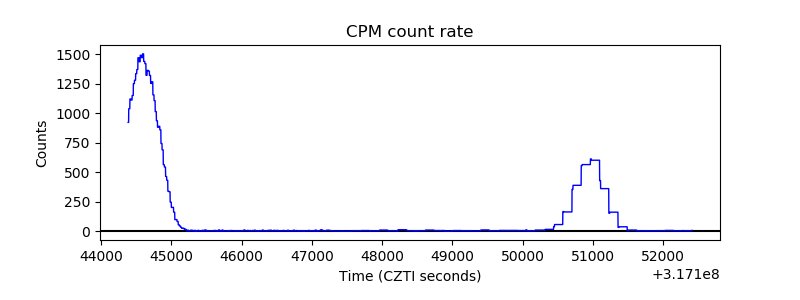 |
| CZT Counter | 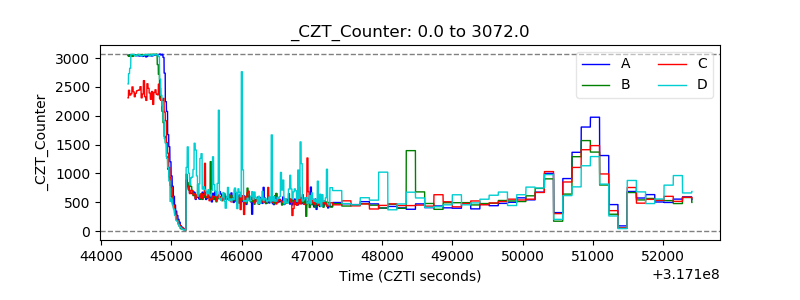 |
| +2.5 Volts monitor |  |
| +5 Volts monitor |  |
| _ROLL_ROT | 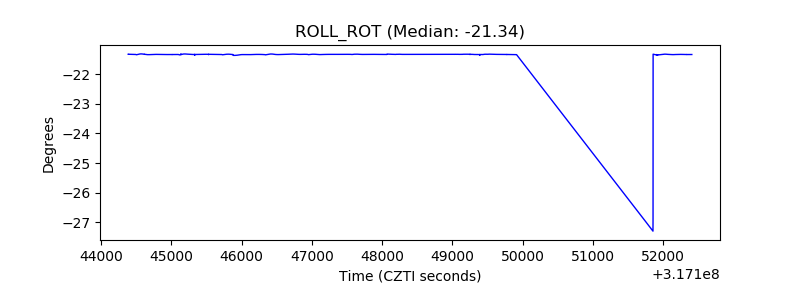 |
| _Roll_DEC | 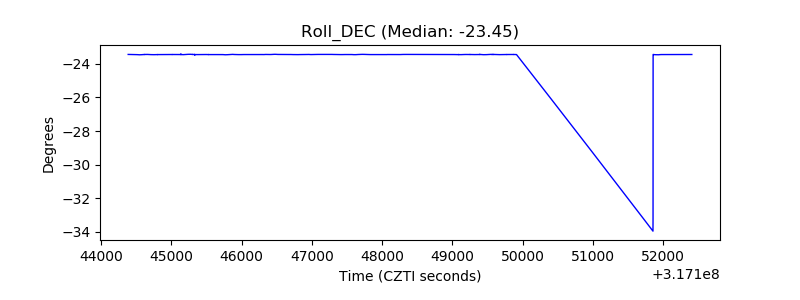 |
| _Roll_RA | 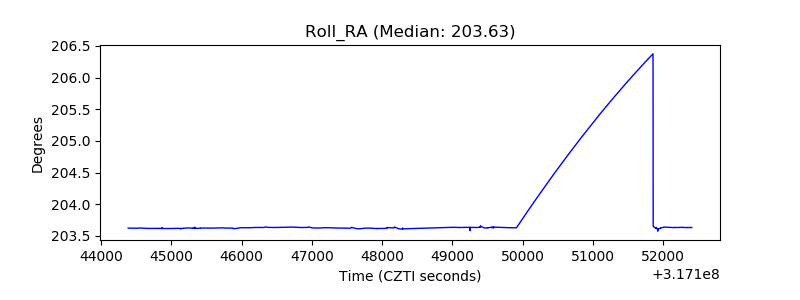 |
| Veto Counter |  |