| Param | Original file | Final file |
|---|---|---|
| Filename | modeM0/AS1A07_148T02_9000003444_23308cztM0_level2.evt | modeM0/AS1A07_148T02_9000003444_23308cztM0_level2_quad_clean.evt |
| Size (bytes) | 523,261,440 | 88,176,960 |
| Size | 499.0 MB | 84.1 MB |
| Events in quadrant A | 3,642,590 | 545,592 |
| Events in quadrant B | 3,720,577 | 550,912 |
| Events in quadrant C | 3,730,790 | 532,439 |
| Events in quadrant D | 4,249,123 | 524,900 |
| Mode M9 | |||
|---|---|---|---|
| Quadrant | BADHDUFLAG | Total packets | Discarded packets |
| A | 0 | 12 | 0 |
| B | 0 | 12 | 0 |
| C | 0 | 12 | 0 |
| D | 0 | 12 | 0 |
| Mode SS | |||
|---|---|---|---|
| Quadrant | BADHDUFLAG | Total packets | Discarded packets |
| A | 0 | 152 | 0 |
| B | 0 | 152 | 0 |
| C | 0 | 152 | 0 |
| D | 0 | 152 | 0 |
| Mode M0 | |||
|---|---|---|---|
| Quadrant | BADHDUFLAG | Total packets | Discarded packets |
| A | 0 | 15576 | 3 |
| B | 0 | 15697 | 2 |
| C | 0 | 15732 | 2 |
| D | 0 | 17528 | 2 |
| Quadrant | Total seconds | Saturated seconds | Saturation percentage |
|---|---|---|---|
| A | 7421 | 128 | 1.724835% |
| B | 7422 | 163 | 2.196174% |
| C | 7422 | 189 | 2.546483% |
| D | 7422 | 175 | 2.357855% |
Noise dominated data is calculated using 1-second bins in cleaned event files. If a bin has >2000 counts, and if more than 50% of those come from <1% of pixels, then it is considered to be noise-dominated and hence unusable.
| Quadrant | # 1 sec bins | Bins with >0 counts | Bins with >2000 counts | High rate bins dominated by noise | Noise dominated (total time) | Noise dominated (detector-on time) | Marked lightcurve |
|---|---|---|---|---|---|---|---|
| A | 8591 | 7422 | 0 | 0 | 0.00% | 0.00% | 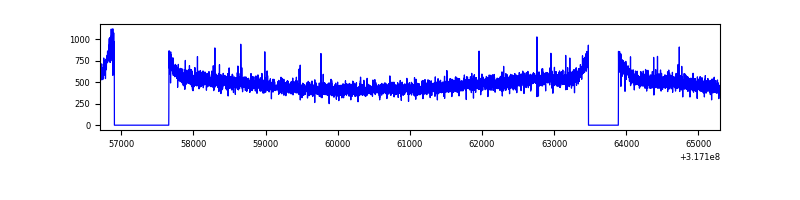 |
| B | 8592 | 7423 | 0 | 0 | 0.00% | 0.00% | 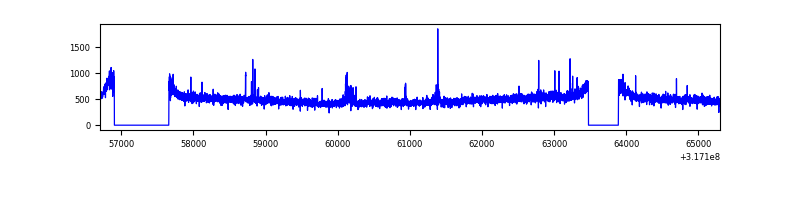 |
| C | 8592 | 7424 | 0 | 0 | 0.00% | 0.00% | 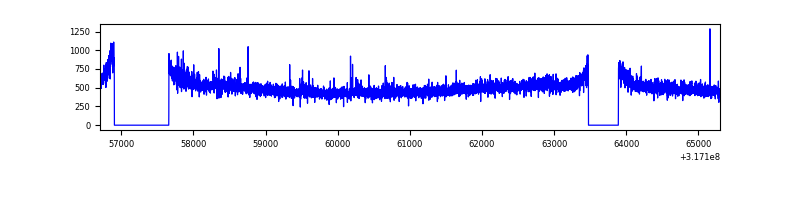 |
| D | 8592 | 7424 | 63 | 63 | 0.73% | 0.85% | 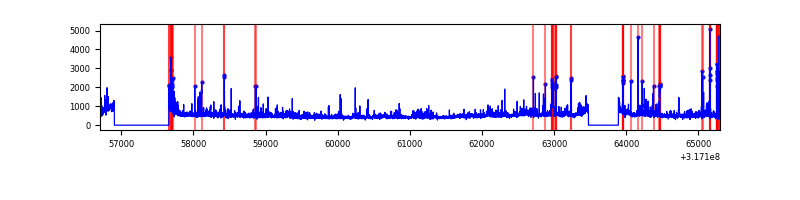 |
Top three noisy pixels from each quadrant. If the there are fewer than three noisy pixels in the level2.evt file, extra rows are filled as -1
| Pixel properties | Quadrant properties | ||||||
|---|---|---|---|---|---|---|---|
| Quadrant | DetID | PixID | Counts | Sigma | Mean | Median | Sigma |
| A | 13 | 254 | 12702 | 61.77 | 940 | 918 | 190.8 |
| A | 6 | 16 | 10972 | 52.7 | 940 | 918 | 190.8 |
| A | 3 | 137 | 8329 | 38.85 | 940 | 918 | 190.8 |
| B | 0 | 230 | 29835 | 160.58 | 933 | 910 | 180.1 |
| B | 12 | 111 | 21745 | 115.67 | 933 | 910 | 180.1 |
| B | 11 | 111 | 19142 | 101.22 | 933 | 910 | 180.1 |
| C | 14 | 238 | 141643 | 664.81 | 900 | 906 | 211.7 |
| C | 7 | 247 | 36213 | 166.78 | 900 | 906 | 211.7 |
| C | 10 | 9 | 28530 | 130.49 | 900 | 906 | 211.7 |
| D | 7 | 238 | 366080 | 1640.83 | 911 | 885 | 222.6 |
| D | 1 | 52 | 242004 | 1083.35 | 911 | 885 | 222.6 |
| D | 1 | 239 | 83390 | 370.7 | 911 | 885 | 222.6 |
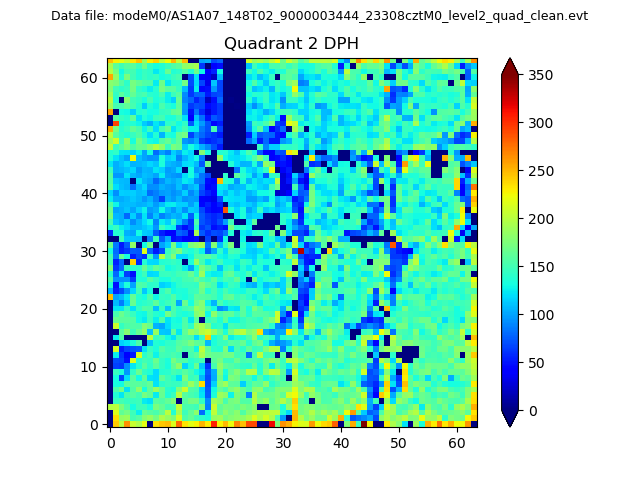
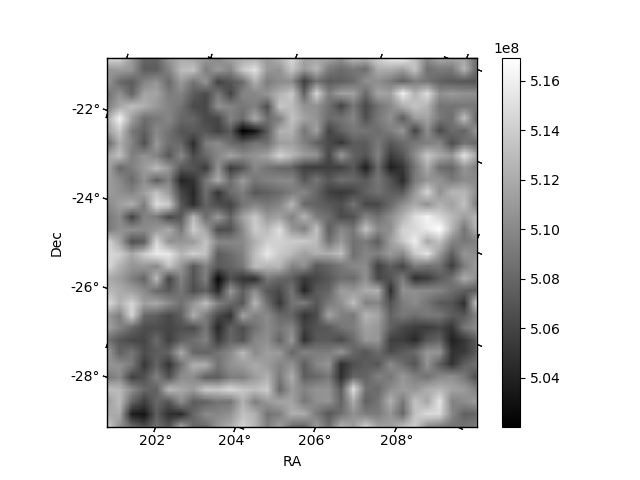
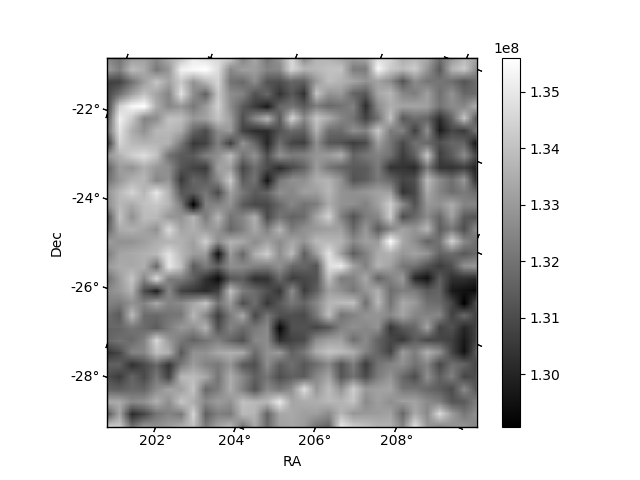
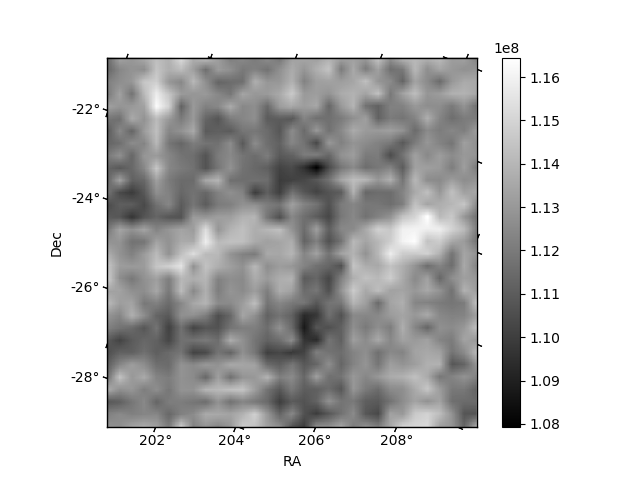
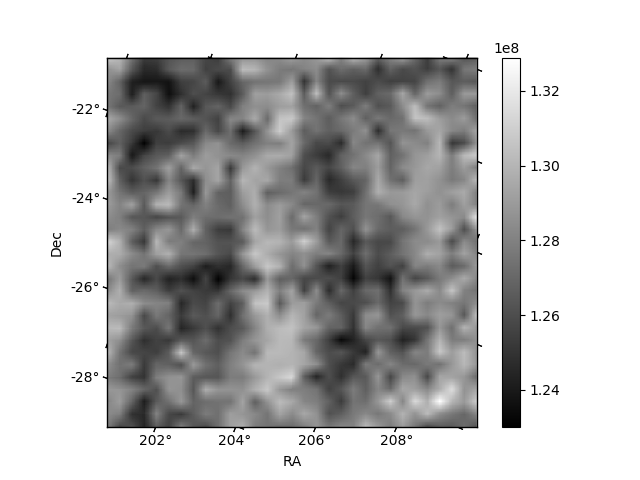
Histogram calculated using DETX and DETY for each event in the final _common_clean file
| Quadrant A | 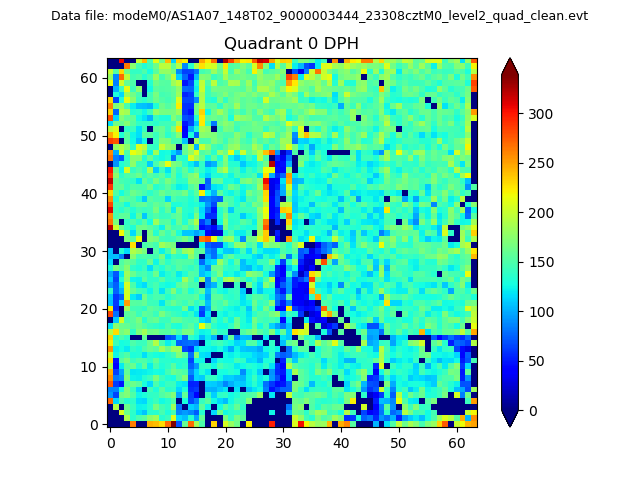 |
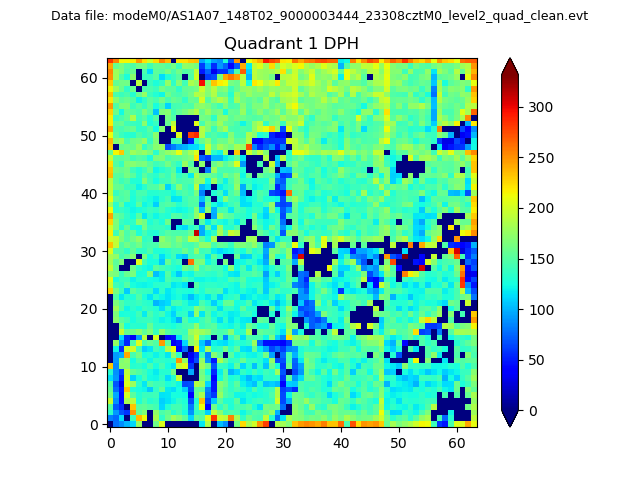 |
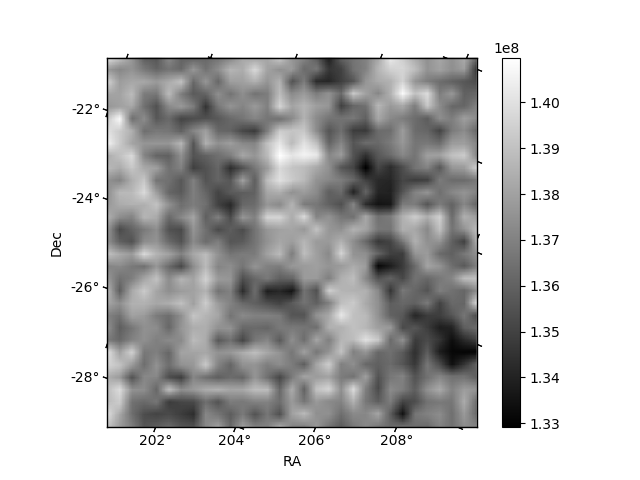
Quadrant B |
|---|---|---|---|
| Quadrant D | 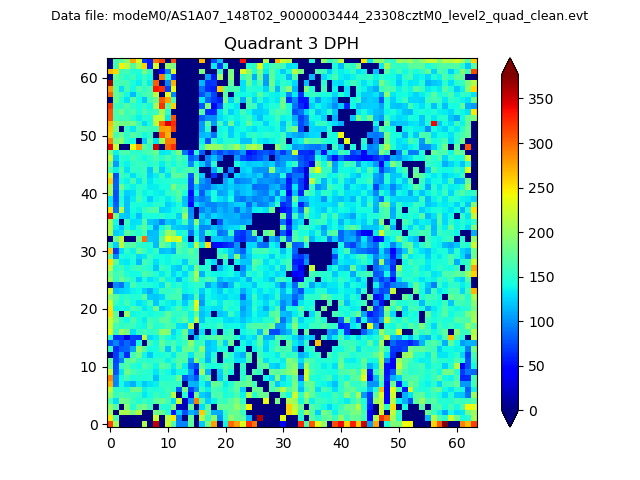 |
 |
Quadrant C |
| Plot type | Count rate plots | Images |
|---|---|---|
| Comparison with Poisson distribution Blue bars denote a histogram of data divided into 1 sec bins. Red curve is a Poisson curve with rate = median count rate of data. |
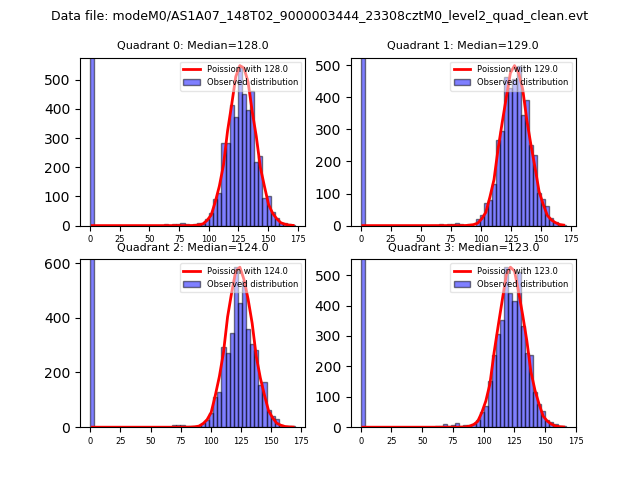 |
 |
| Quadrant-wise count rates Data is divided into 100 sec bins |
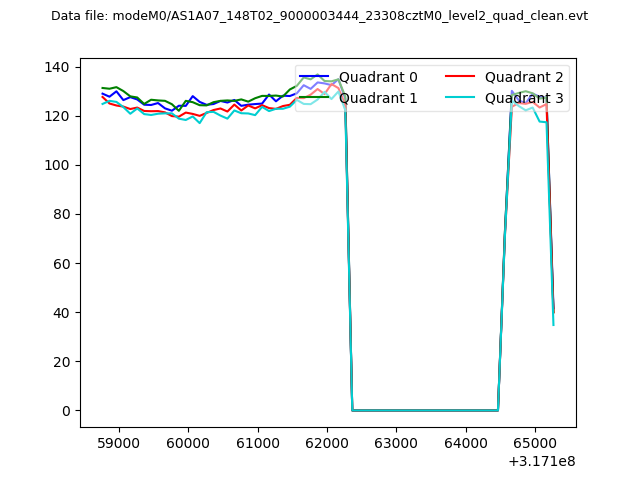 |
|
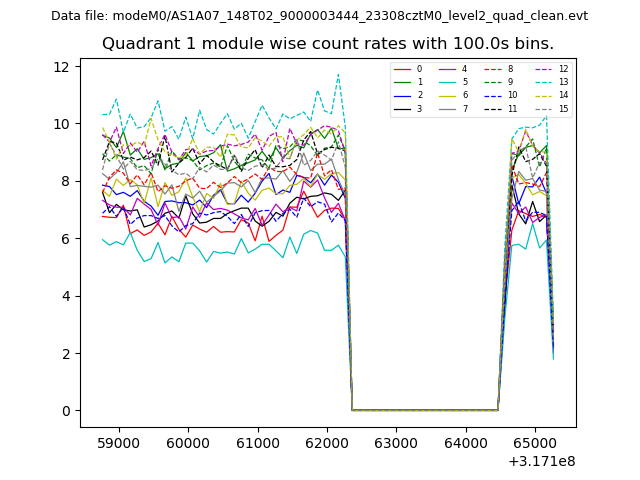
| Module-wise count rates for Quadrant A Data is divided into 100 sec bins |
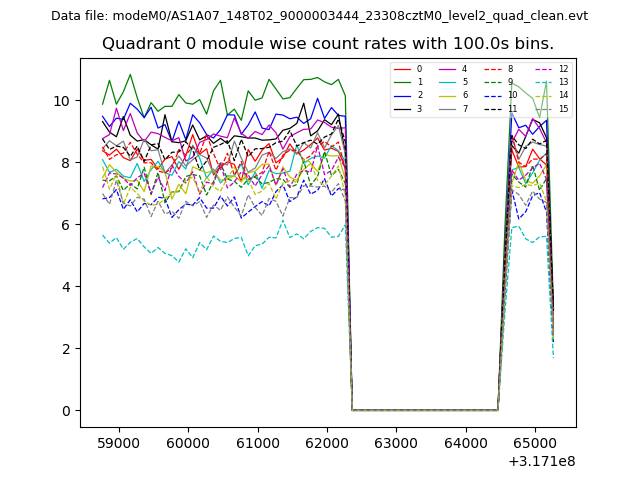 |
 |
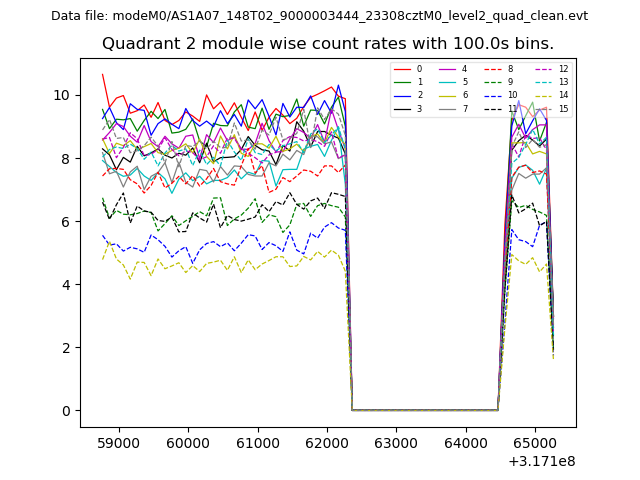
| Module-wise count rates for Quadrant B Data is divided into 100 sec bins |
 |
 |
| Module-wise count rates for Quadrant C Data is divided into 100 sec bins |
 |
 |
| Module-wise count rates for Quadrant D Data is divided into 100 sec bins |
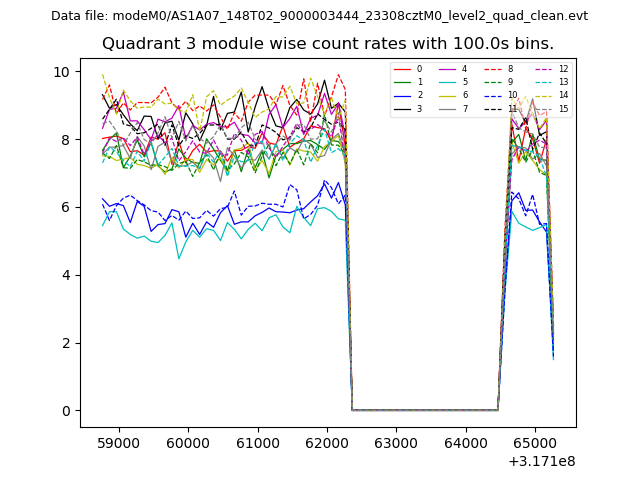 |
 |
| Parameter | Plot |
|---|---|
| CZT HV Monitor | 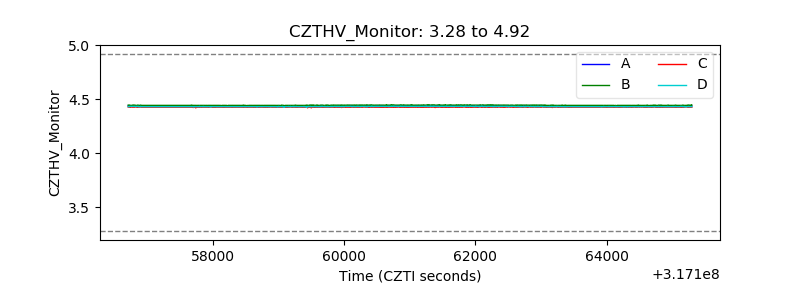 |
| D_VDD | 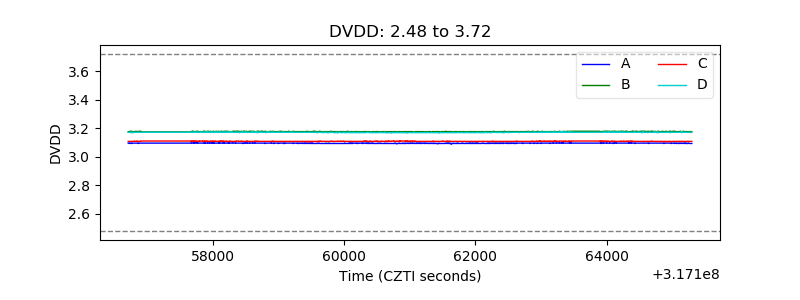 |
| Temperature 1 | 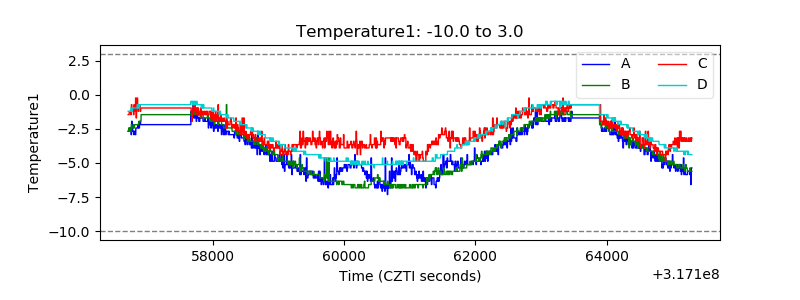 |
| Veto HV Monitor | 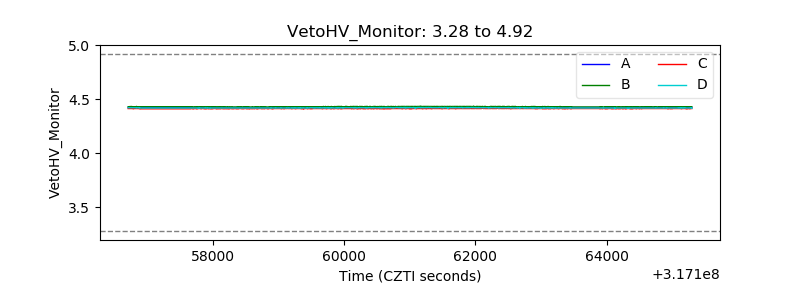 |
| Veto LLD | 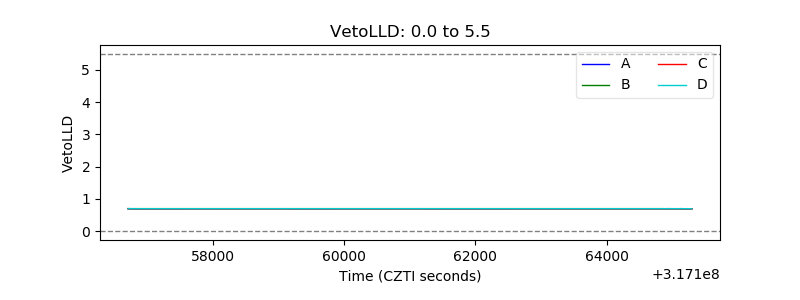 |
| Alpha Counter | 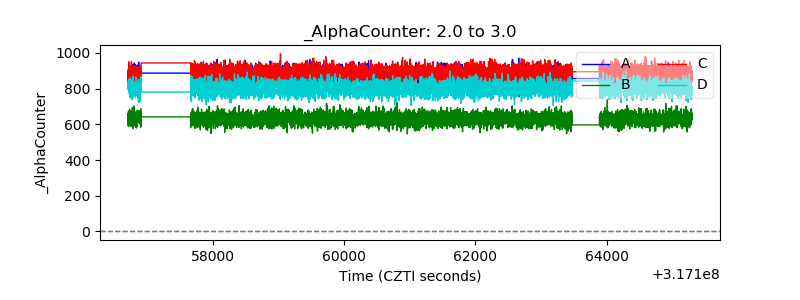 |
| _CPM_Rate | 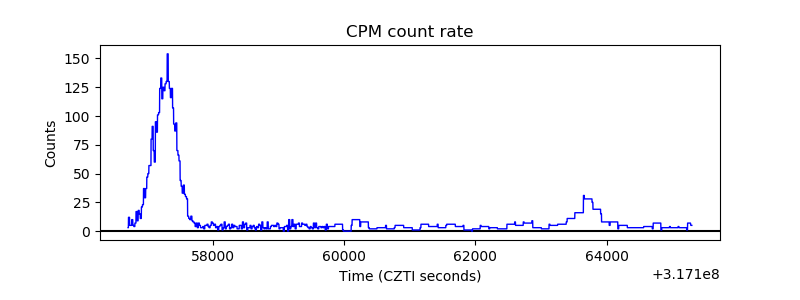 |
| CZT Counter | 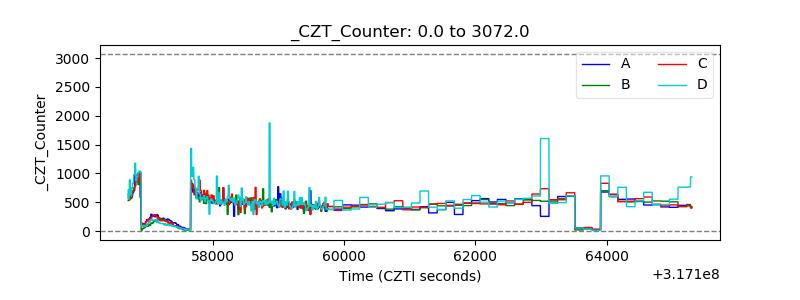 |
| +2.5 Volts monitor |  |
| +5 Volts monitor | 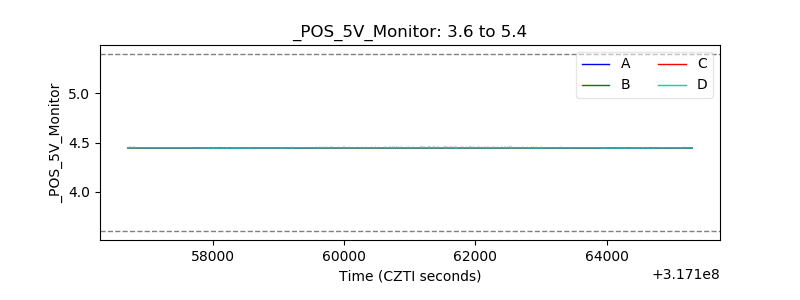 |
| _ROLL_ROT | 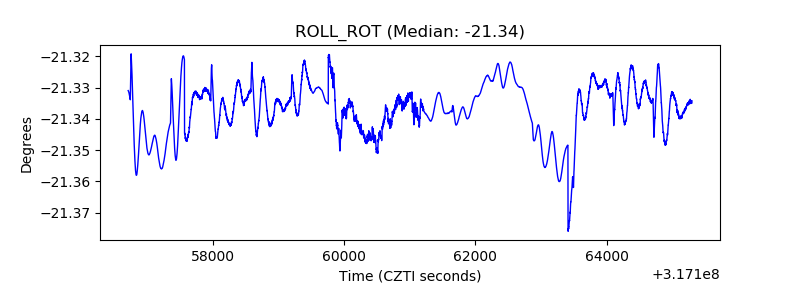 |
| _Roll_DEC | 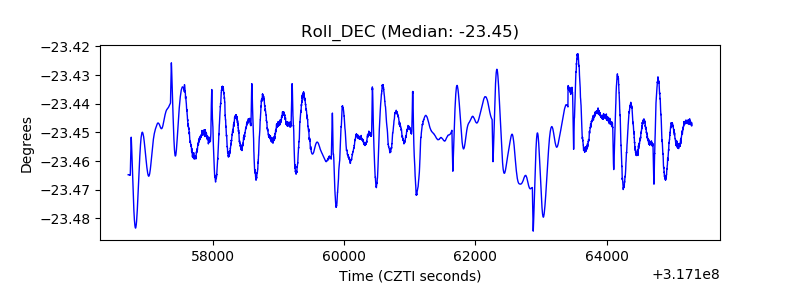 |
| _Roll_RA | 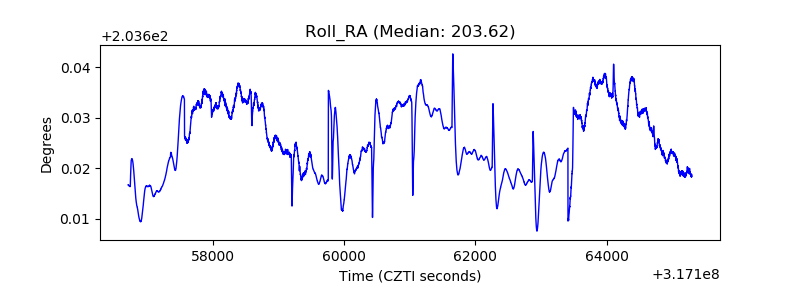 |
| Veto Counter | 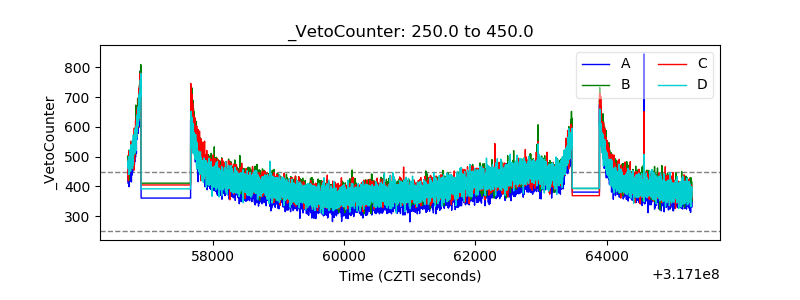 |