| Param | Original file | Final file |
|---|---|---|
| Filename | modeM0/AS1A07_148T02_9000003444_23309cztM0_level2.evt | modeM0/AS1A07_148T02_9000003444_23309cztM0_level2_quad_clean.evt |
| Size (bytes) | 524,499,840 | 91,595,520 |
| Size | 500.2 MB | 87.4 MB |
| Events in quadrant A | 3,753,436 | 570,938 |
| Events in quadrant B | 3,779,665 | 575,151 |
| Events in quadrant C | 3,731,472 | 556,987 |
| Events in quadrant D | 4,111,215 | 549,423 |
| Mode M9 | |||
|---|---|---|---|
| Quadrant | BADHDUFLAG | Total packets | Discarded packets |
| A | 0 | 8 | 0 |
| B | 0 | 8 | 0 |
| C | 0 | 8 | 0 |
| D | 0 | 8 | 0 |
| Mode SS | |||
|---|---|---|---|
| Quadrant | BADHDUFLAG | Total packets | Discarded packets |
| A | 0 | 154 | 2 |
| B | 0 | 153 | 1 |
| C | 0 | 154 | 2 |
| D | 0 | 154 | 2 |
| Mode M0 | |||
|---|---|---|---|
| Quadrant | BADHDUFLAG | Total packets | Discarded packets |
| A | 0 | 16341 | 185 |
| B | 0 | 16183 | 195 |
| C | 0 | 16016 | 170 |
| D | 0 | 17496 | 169 |
| Quadrant | Total seconds | Saturated seconds | Saturation percentage |
|---|---|---|---|
| A | 7497 | 81 | 1.080432% |
| B | 7495 | 141 | 1.881254% |
| C | 7497 | 154 | 2.054155% |
| D | 7500 | 134 | 1.786667% |
Noise dominated data is calculated using 1-second bins in cleaned event files. If a bin has >2000 counts, and if more than 50% of those come from <1% of pixels, then it is considered to be noise-dominated and hence unusable.
| Quadrant | # 1 sec bins | Bins with >0 counts | Bins with >2000 counts | High rate bins dominated by noise | Noise dominated (total time) | Noise dominated (detector-on time) | Marked lightcurve |
|---|---|---|---|---|---|---|---|
| A | 8524 | 7503 | 1 | 1 | 0.01% | 0.01% | 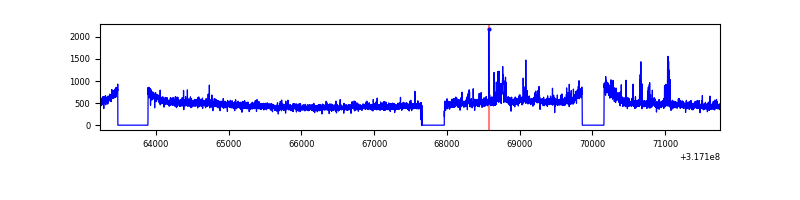 |
| B | 8524 | 7501 | 4 | 4 | 0.05% | 0.05% | 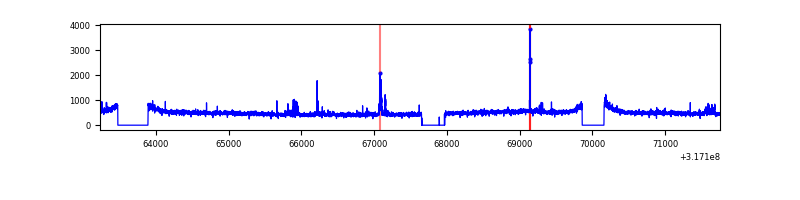 |
| C | 8523 | 7504 | 0 | 0 | 0.00% | 0.00% | 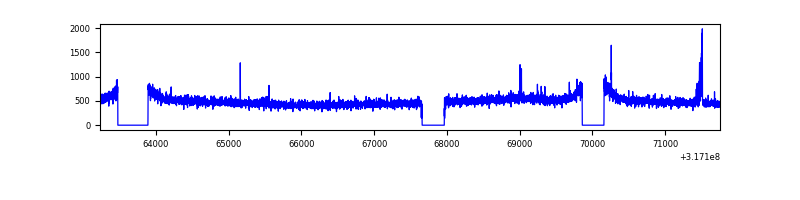 |
| D | 8524 | 7505 | 73 | 73 | 0.86% | 0.97% | 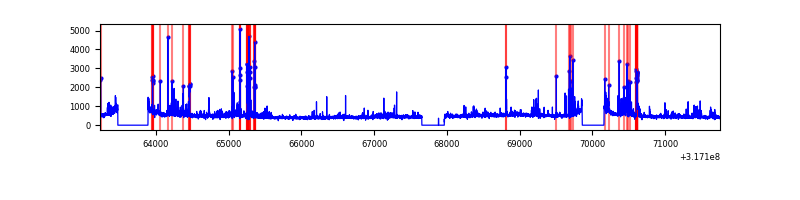 |
Top three noisy pixels from each quadrant. If the there are fewer than three noisy pixels in the level2.evt file, extra rows are filled as -1
| Pixel properties | Quadrant properties | ||||||
|---|---|---|---|---|---|---|---|
| Quadrant | DetID | PixID | Counts | Sigma | Mean | Median | Sigma |
| A | 6 | 16 | 135647 | 707.21 | 937 | 917 | 190.5 |
| A | 13 | 254 | 12033 | 58.35 | 937 | 917 | 190.5 |
| A | 3 | 137 | 8414 | 39.35 | 937 | 917 | 190.5 |
| B | 0 | 230 | 53138 | 289.99 | 932 | 908 | 180.1 |
| B | 4 | 173 | 30729 | 165.57 | 932 | 908 | 180.1 |
| B | 12 | 111 | 22371 | 119.17 | 932 | 908 | 180.1 |
| C | 14 | 238 | 142437 | 670.75 | 898 | 904 | 211.0 |
| C | 10 | 9 | 58983 | 275.25 | 898 | 904 | 211.0 |
| C | 7 | 247 | 17708 | 79.64 | 898 | 904 | 211.0 |
| D | 1 | 52 | 340224 | 1511.0 | 906 | 879 | 224.6 |
| D | 7 | 238 | 246154 | 1092.13 | 906 | 879 | 224.6 |
| D | 12 | 233 | 40231 | 175.22 | 906 | 879 | 224.6 |
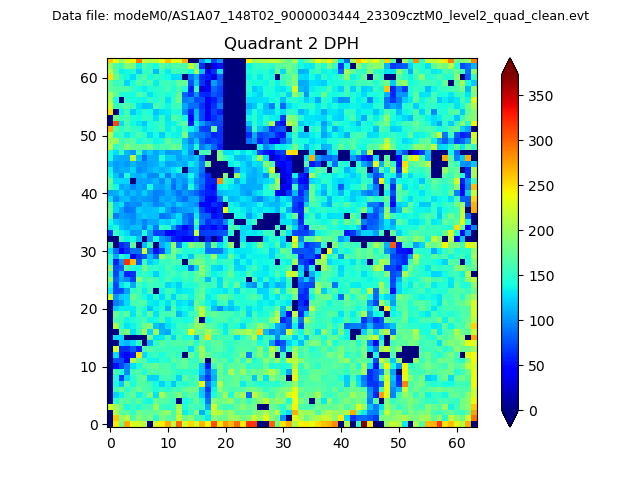
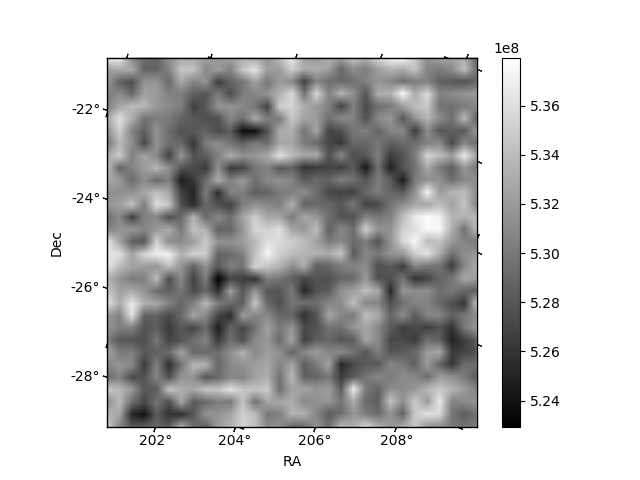
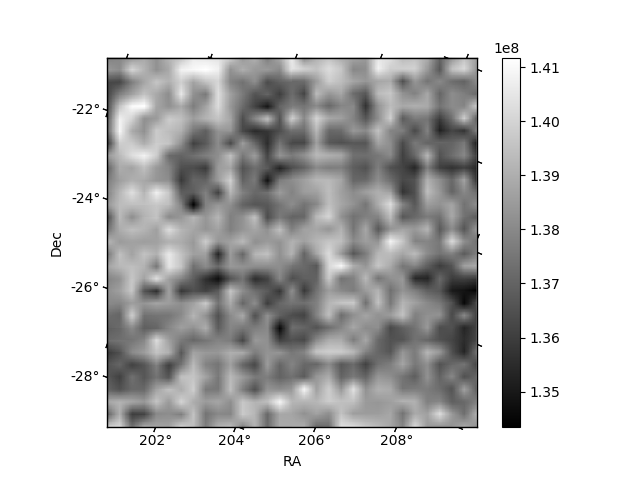
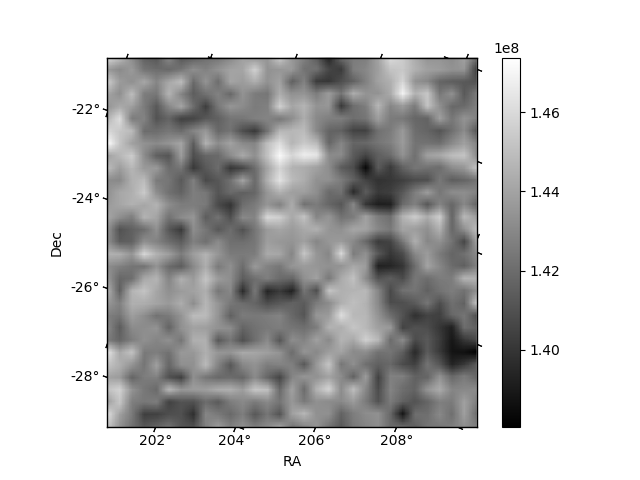
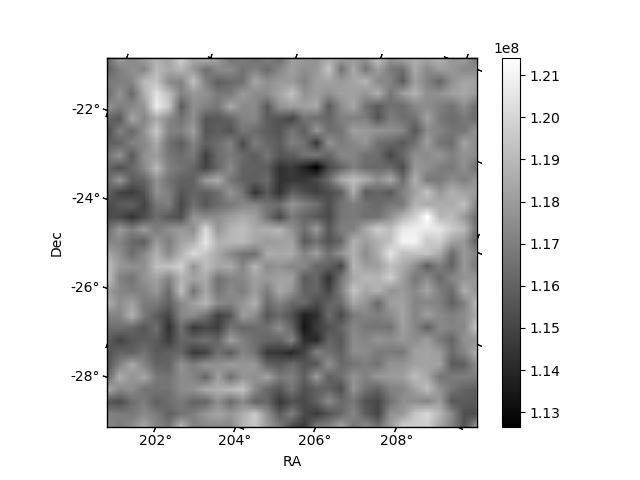
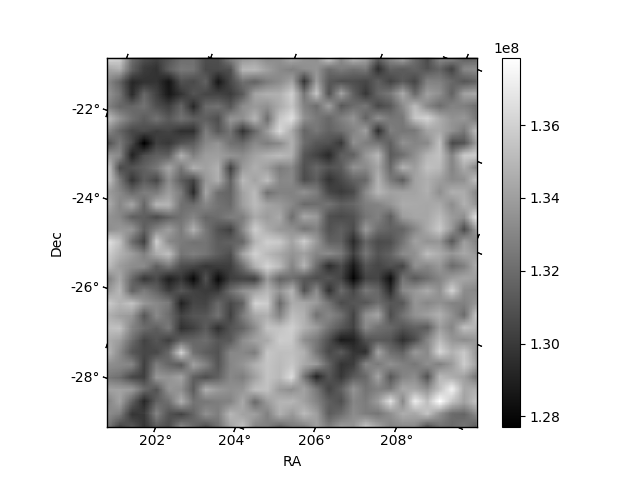
Histogram calculated using DETX and DETY for each event in the final _common_clean file
| Quadrant A | 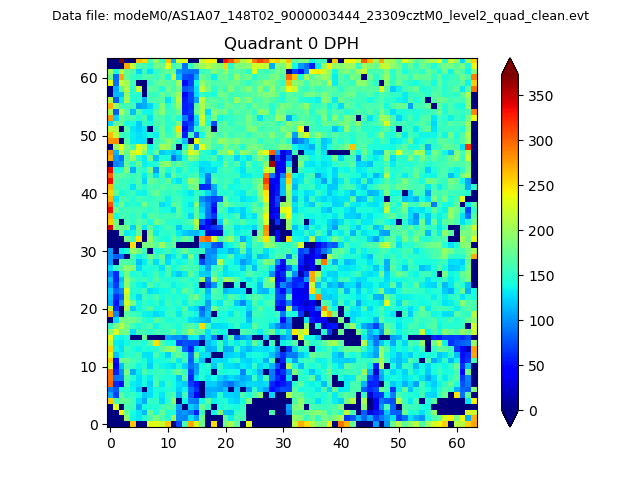 |
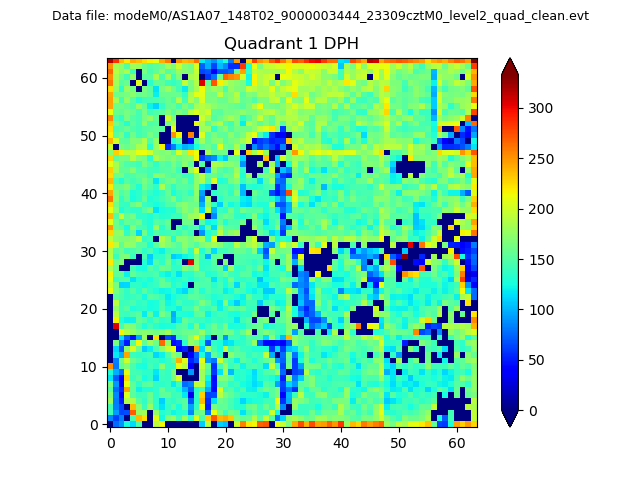 |
Quadrant B |
|---|---|---|---|
| Quadrant D | 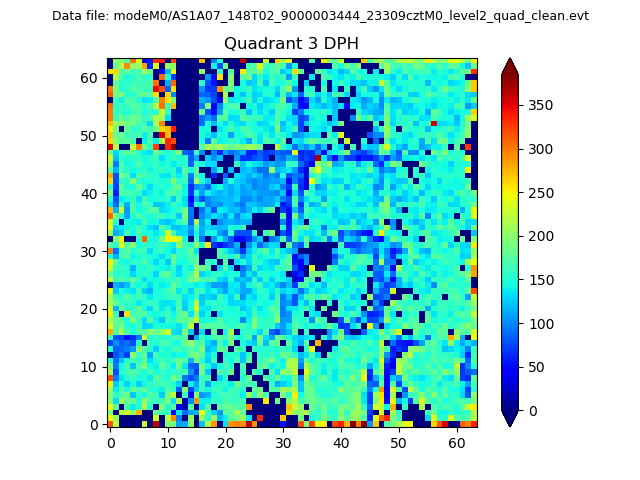 |
 |
Quadrant C |
| Plot type | Count rate plots | Images |
|---|---|---|
| Comparison with Poisson distribution Blue bars denote a histogram of data divided into 1 sec bins. Red curve is a Poisson curve with rate = median count rate of data. |
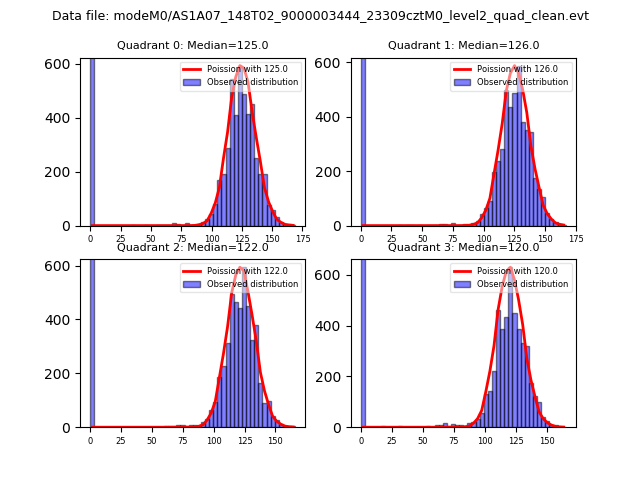 |
 |
| Quadrant-wise count rates Data is divided into 100 sec bins |
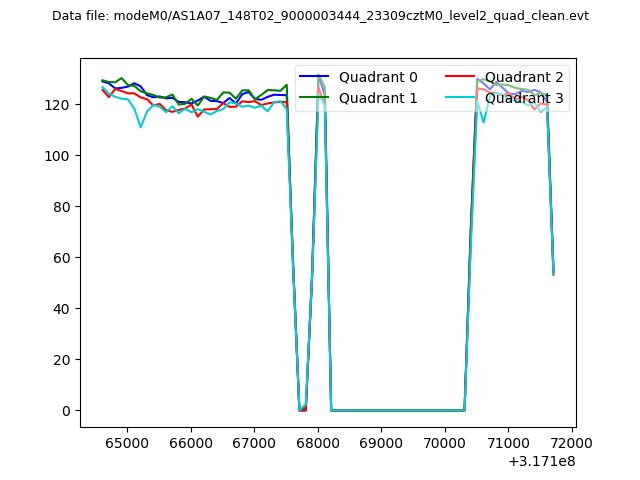 |
|
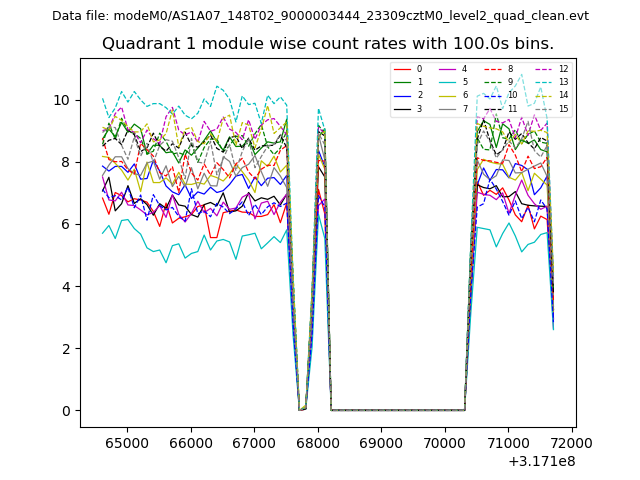
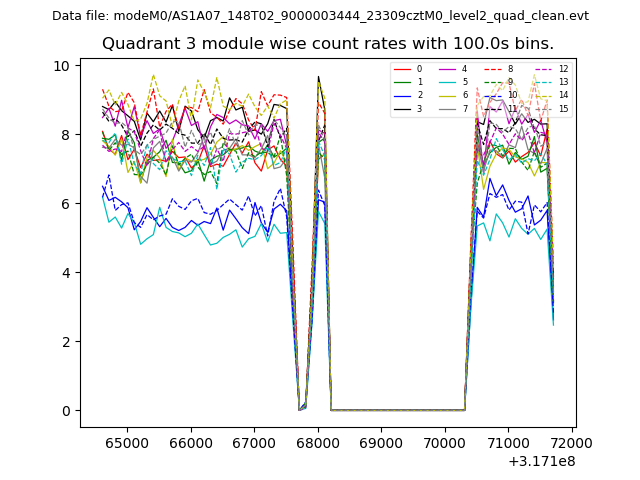
| Module-wise count rates for Quadrant A Data is divided into 100 sec bins |
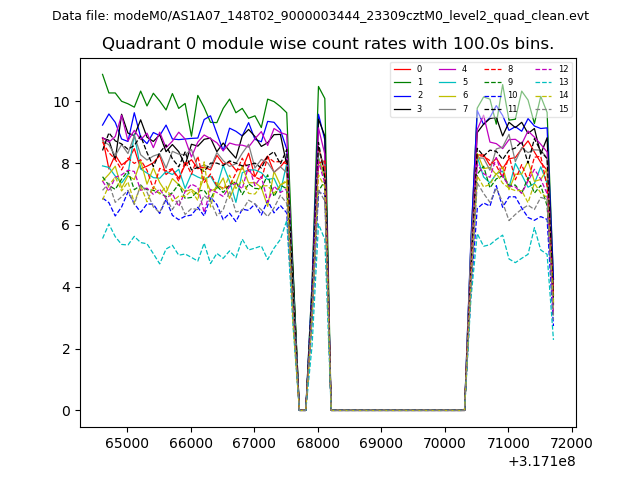 |
 |
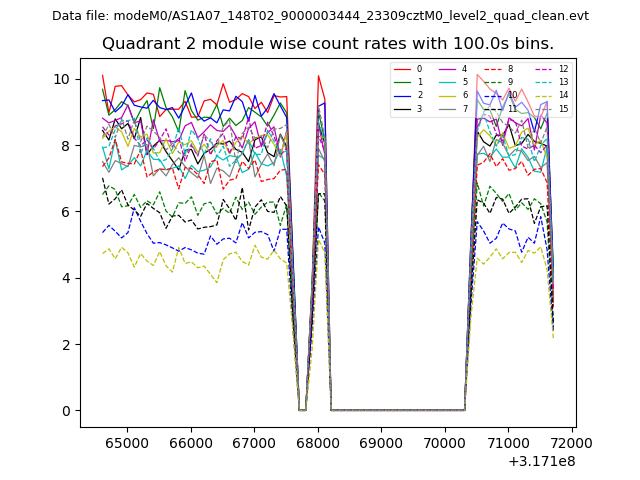
| Module-wise count rates for Quadrant B Data is divided into 100 sec bins |
 |
 |
| Module-wise count rates for Quadrant C Data is divided into 100 sec bins |
 |
 |
| Module-wise count rates for Quadrant D Data is divided into 100 sec bins |
 |
 |
| Parameter | Plot |
|---|---|
| CZT HV Monitor |  |
| D_VDD | 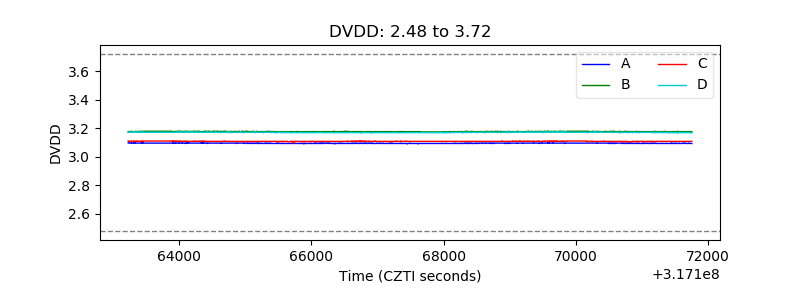 |
| Temperature 1 | 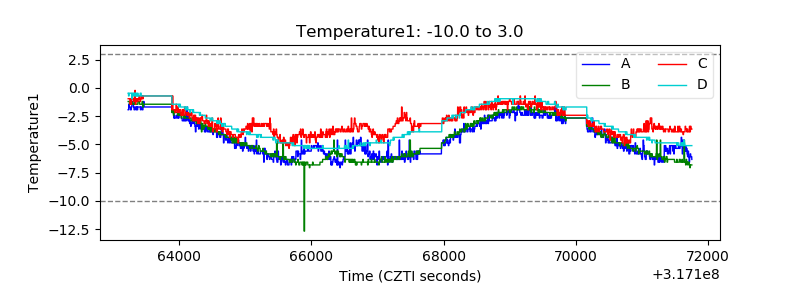 |
| Veto HV Monitor | 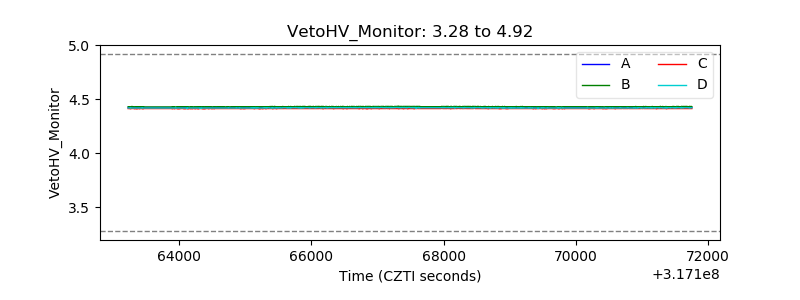 |
| Veto LLD | 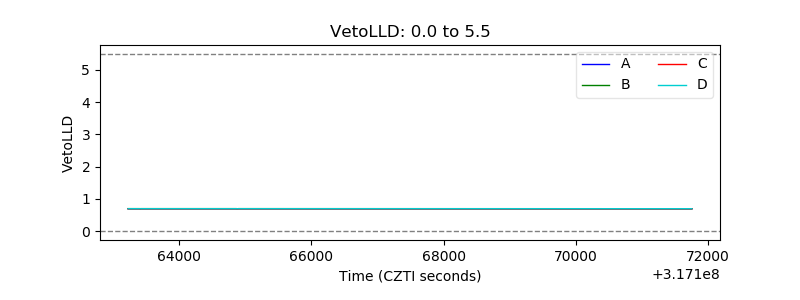 |
| Alpha Counter | 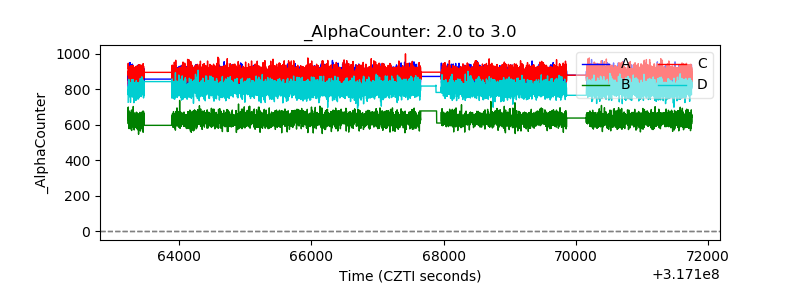 |
| _CPM_Rate | 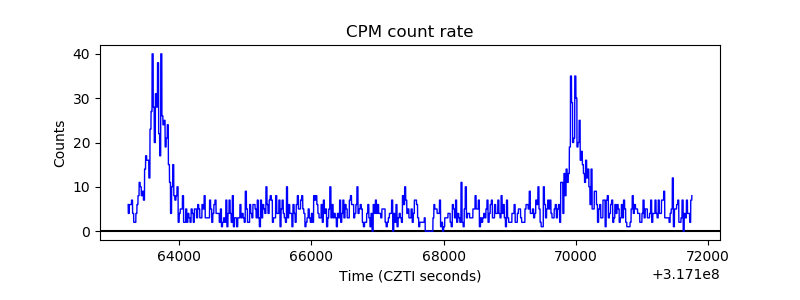 |
| CZT Counter | 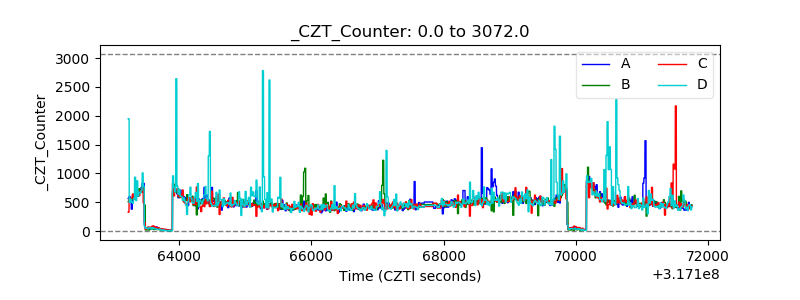 |
| +2.5 Volts monitor |  |
| +5 Volts monitor |  |
| _ROLL_ROT | 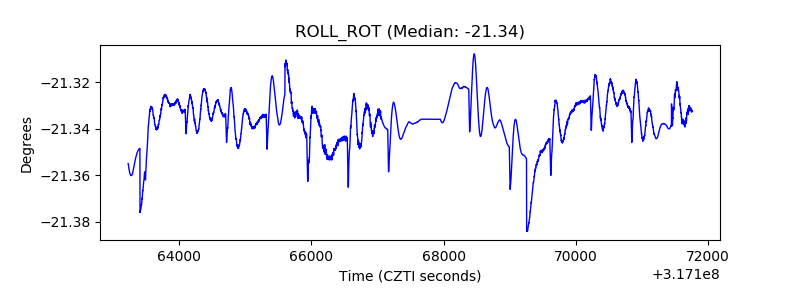 |
| _Roll_DEC | 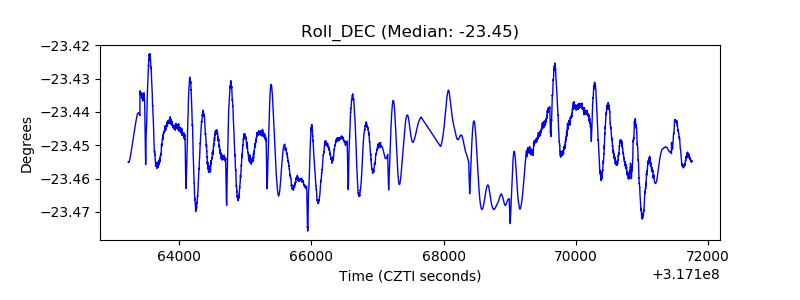 |
| _Roll_RA | 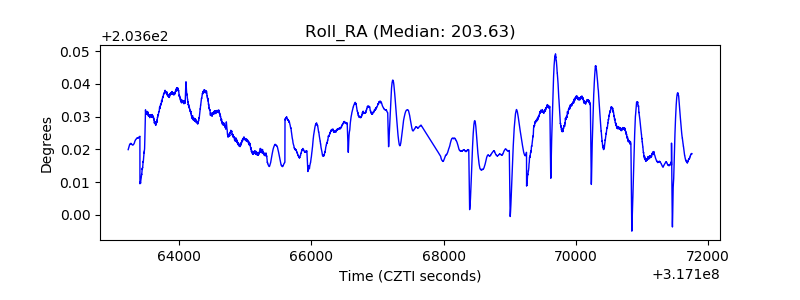 |
| Veto Counter | 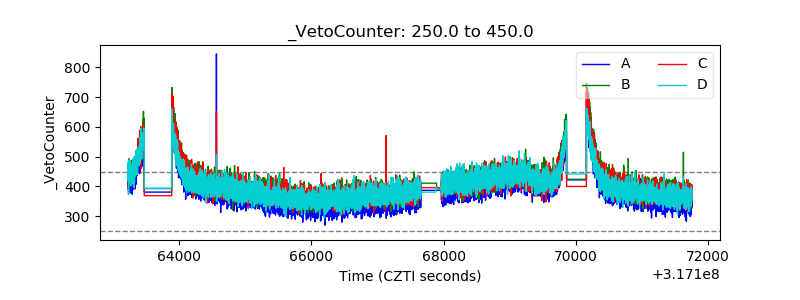 |