| Param | Original file | Final file |
|---|---|---|
| Filename | modeM0/AS1A07_148T02_9000003444_23314cztM0_level2.evt | modeM0/AS1A07_148T02_9000003444_23314cztM0_level2_quad_clean.evt |
| Size (bytes) | 1,556,763,840 | 254,419,200 |
| Size | 1.4 GB | 242.6 MB |
| Events in quadrant A | 10,331,777 | 1,579,718 |
| Events in quadrant B | 10,335,064 | 1,610,833 |
| Events in quadrant C | 10,516,538 | 1,550,519 |
| Events in quadrant D | 14,536,595 | 1,509,764 |
| Mode M9 | |||
|---|---|---|---|
| Quadrant | BADHDUFLAG | Total packets | Discarded packets |
| A | 0 | 34 | 0 |
| B | 0 | 34 | 0 |
| C | 0 | 34 | 0 |
| D | 0 | 34 | 0 |
| Mode SS | |||
|---|---|---|---|
| Quadrant | BADHDUFLAG | Total packets | Discarded packets |
| A | 0 | 428 | 0 |
| B | 0 | 428 | 0 |
| C | 0 | 428 | 0 |
| D | 0 | 428 | 0 |
| Mode M0 | |||
|---|---|---|---|
| Quadrant | BADHDUFLAG | Total packets | Discarded packets |
| A | 0 | 44140 | 4 |
| B | 0 | 43886 | 4 |
| C | 0 | 43959 | 4 |
| D | 0 | 57227 | 5 |
| Quadrant | Total seconds | Saturated seconds | Saturation percentage |
|---|---|---|---|
| A | 21139 | 200 | 0.946119% |
| B | 21140 | 140 | 0.662252% |
| C | 21140 | 230 | 1.087985% |
| D | 21139 | 1009 | 4.773168% |
Noise dominated data is calculated using 1-second bins in cleaned event files. If a bin has >2000 counts, and if more than 50% of those come from <1% of pixels, then it is considered to be noise-dominated and hence unusable.
| Quadrant | # 1 sec bins | Bins with >0 counts | Bins with >2000 counts | High rate bins dominated by noise | Noise dominated (total time) | Noise dominated (detector-on time) | Marked lightcurve |
|---|---|---|---|---|---|---|---|
| A | 24430 | 21143 | 70 | 70 | 0.29% | 0.33% | 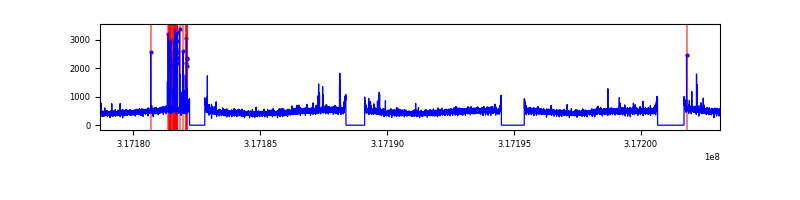 |
| B | 24431 | 21143 | 5 | 5 | 0.02% | 0.02% | 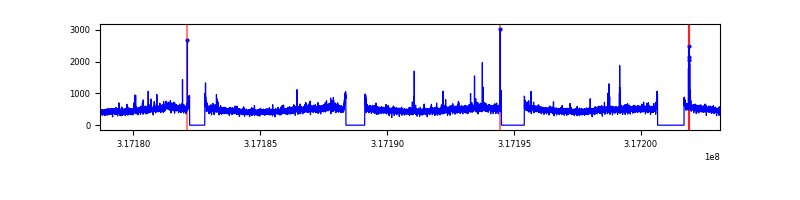 |
| C | 24431 | 21143 | 1 | 1 | 0.00% | 0.00% | 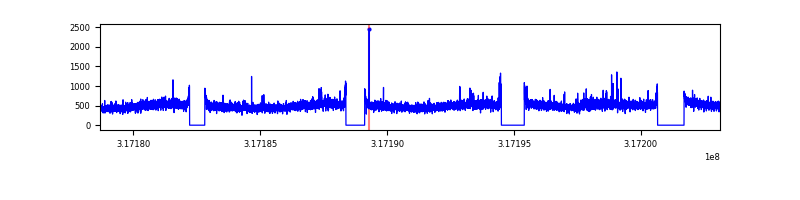 |
| D | 24430 | 21142 | 777 | 777 | 3.18% | 3.68% | 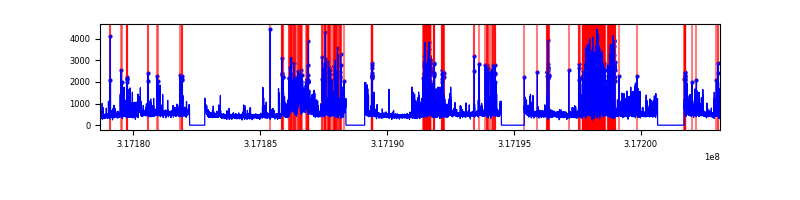 |
Top three noisy pixels from each quadrant. If the there are fewer than three noisy pixels in the level2.evt file, extra rows are filled as -1
| Pixel properties | Quadrant properties | ||||||
|---|---|---|---|---|---|---|---|
| Quadrant | DetID | PixID | Counts | Sigma | Mean | Median | Sigma |
| A | 6 | 16 | 302884 | 575.85 | 2602 | 2543 | 521.6 |
| A | 13 | 254 | 34100 | 60.51 | 2602 | 2543 | 521.6 |
| A | 3 | 137 | 22619 | 38.49 | 2602 | 2543 | 521.6 |
| B | 12 | 111 | 60571 | 116.92 | 2590 | 2520 | 496.5 |
| B | 11 | 111 | 53899 | 103.49 | 2590 | 2520 | 496.5 |
| B | 4 | 173 | 49421 | 94.47 | 2590 | 2520 | 496.5 |
| C | 14 | 238 | 397284 | 671.5 | 2515 | 2530 | 587.9 |
| C | 10 | 9 | 188648 | 316.6 | 2515 | 2530 | 587.9 |
| C | 0 | 239 | 61793 | 100.81 | 2515 | 2530 | 587.9 |
| D | 1 | 52 | 3156139 | 5168.28 | 2516 | 2447 | 610.2 |
| D | 7 | 238 | 1438072 | 2352.71 | 2516 | 2447 | 610.2 |
| D | 1 | 239 | 210851 | 341.53 | 2516 | 2447 | 610.2 |
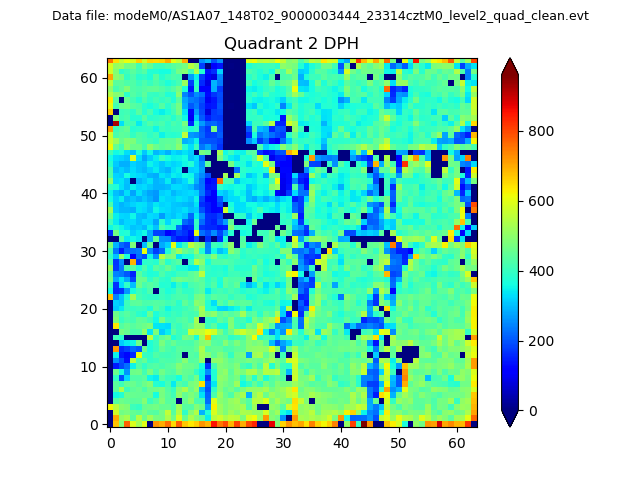
Histogram calculated using DETX and DETY for each event in the final _common_clean file
| Quadrant A | 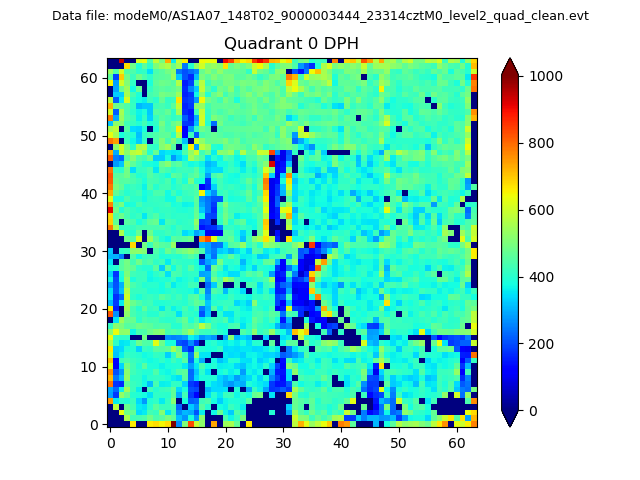 |
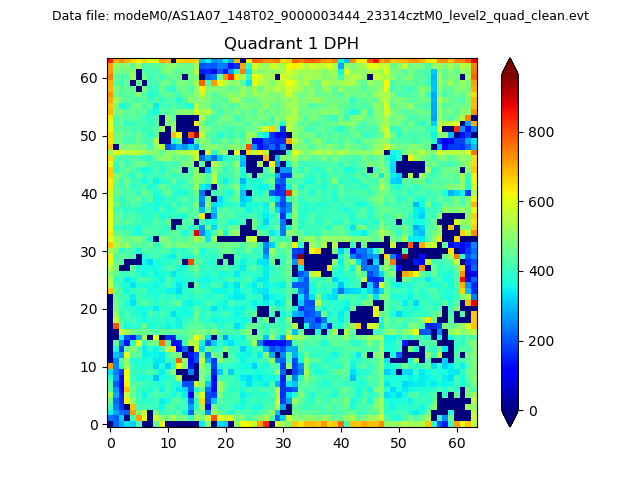 |
Quadrant B |
|---|---|---|---|
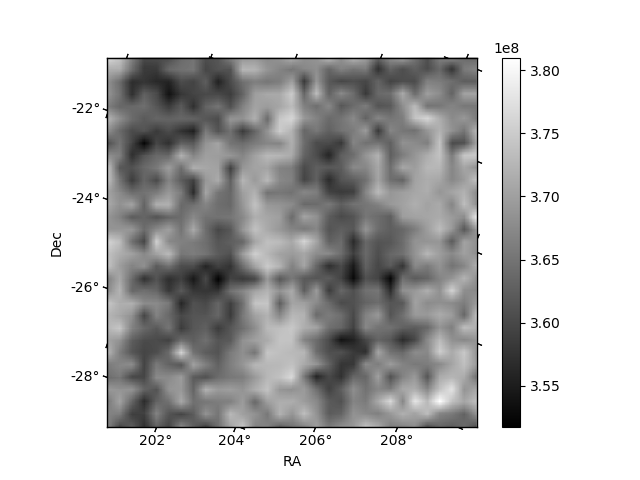
| Quadrant D | 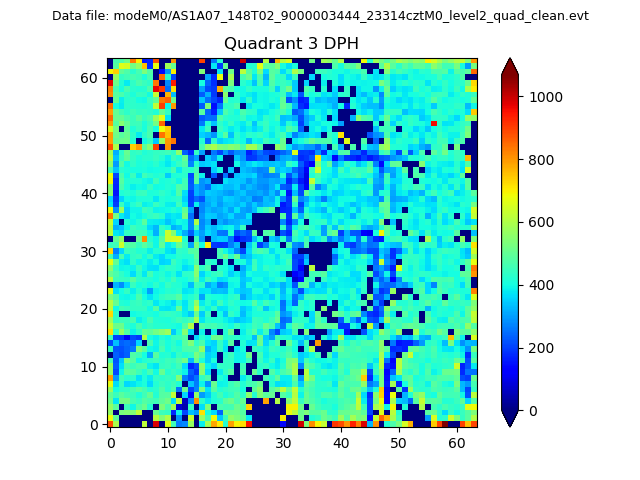 |
 |
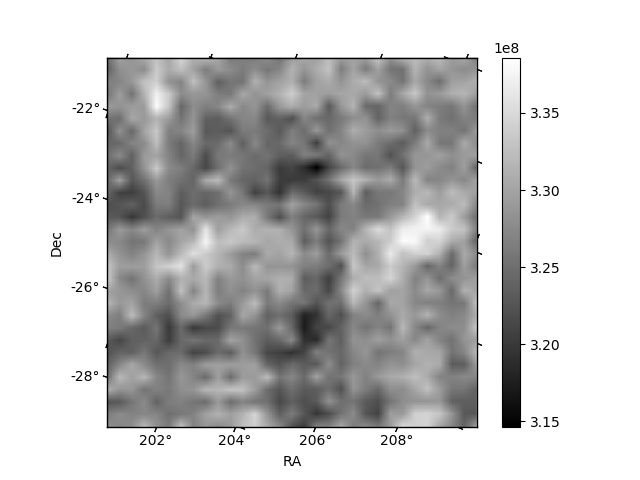
Quadrant C |
| Plot type | Count rate plots | Images |
|---|---|---|
| Comparison with Poisson distribution Blue bars denote a histogram of data divided into 1 sec bins. Red curve is a Poisson curve with rate = median count rate of data. |
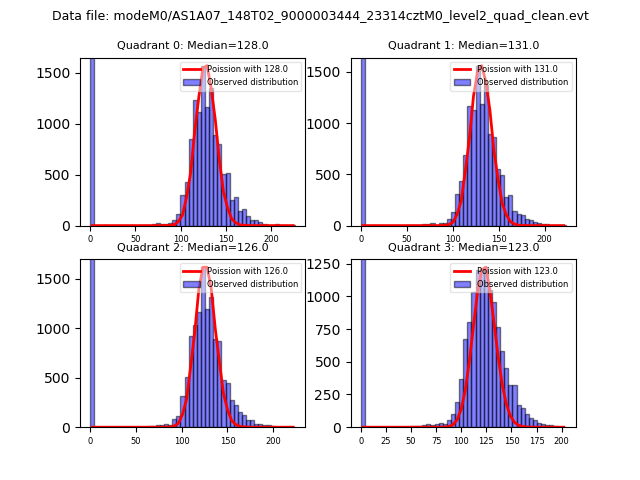 |
 |
| Quadrant-wise count rates Data is divided into 100 sec bins |
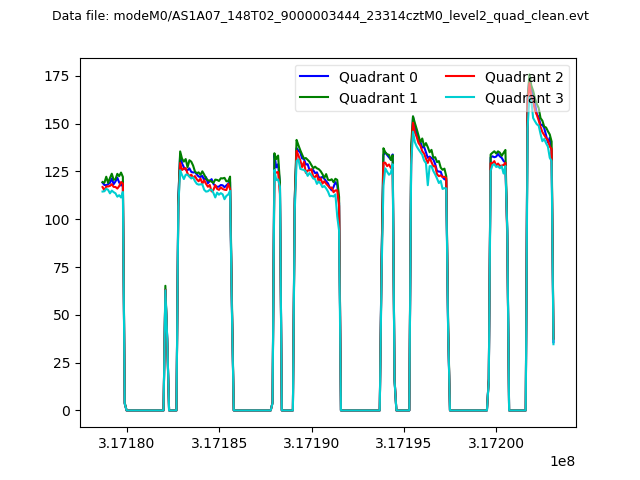 |
|
| Module-wise count rates for Quadrant A Data is divided into 100 sec bins |
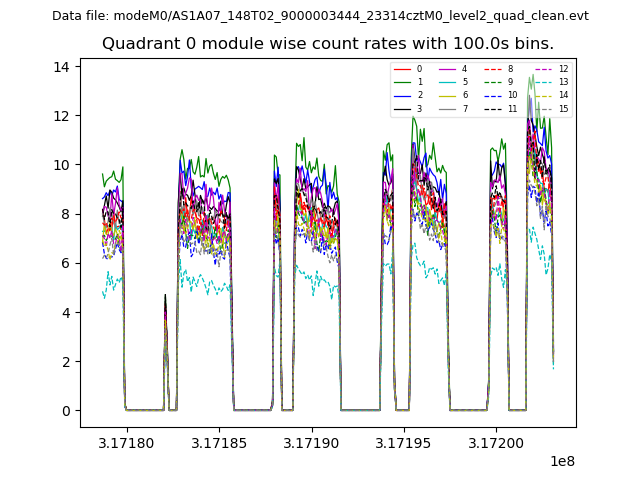 |
 |
| Module-wise count rates for Quadrant B Data is divided into 100 sec bins |
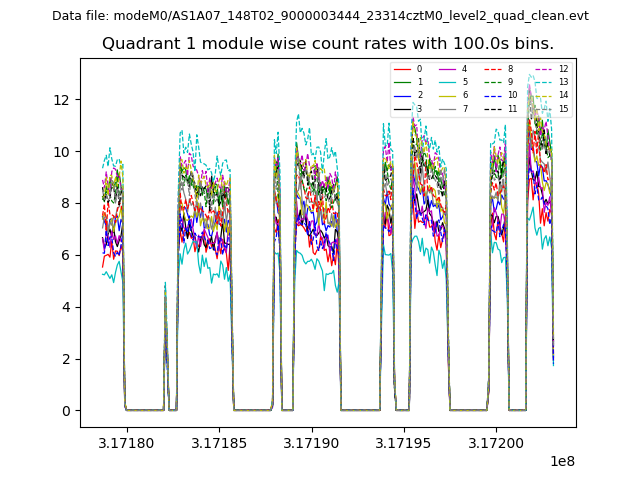 |
 |
| Module-wise count rates for Quadrant C Data is divided into 100 sec bins |
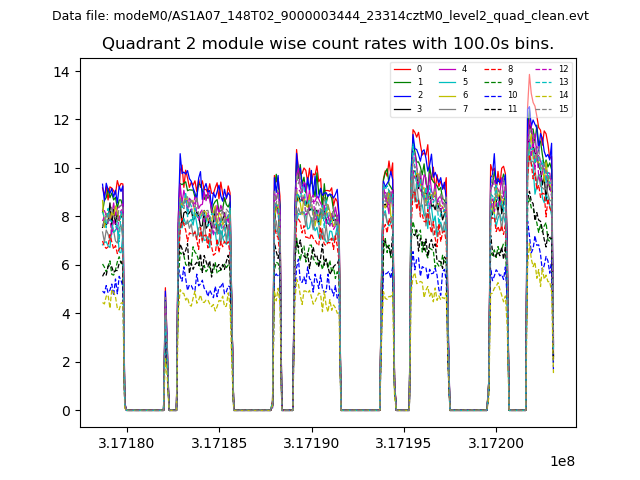 |
 |
| Module-wise count rates for Quadrant D Data is divided into 100 sec bins |
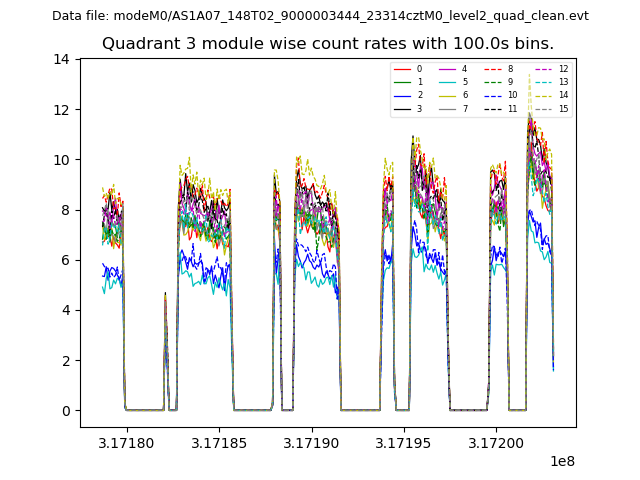 |
 |
| Parameter | Plot |
|---|---|
| CZT HV Monitor | 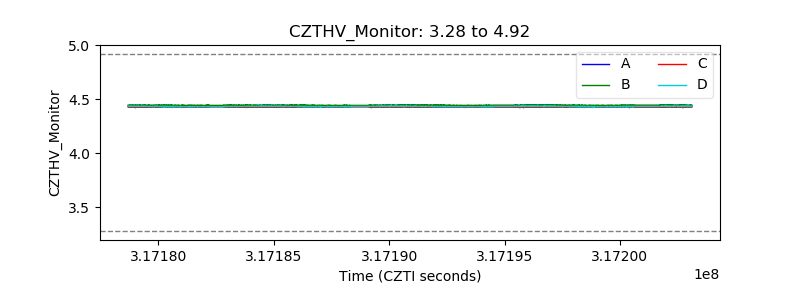 |
| D_VDD | 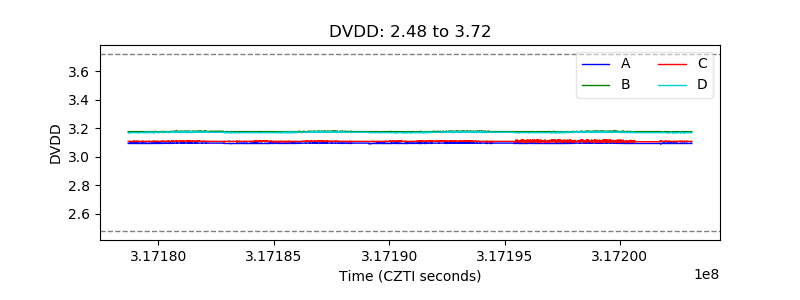 |
| Temperature 1 | 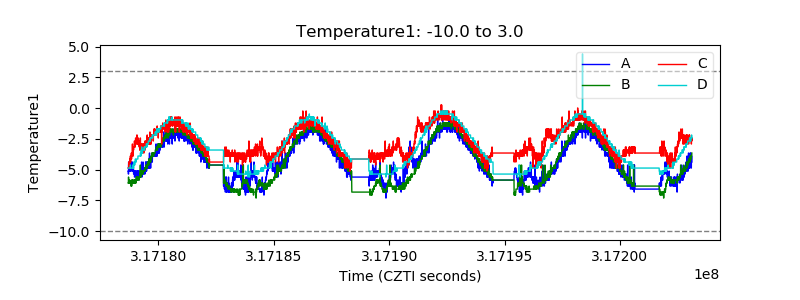 |
| Veto HV Monitor | 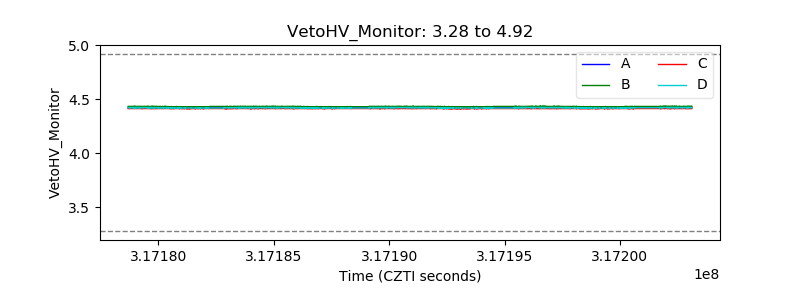 |
| Veto LLD | 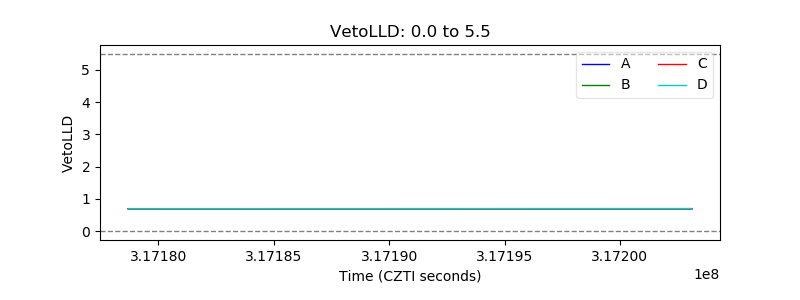 |
| Alpha Counter | 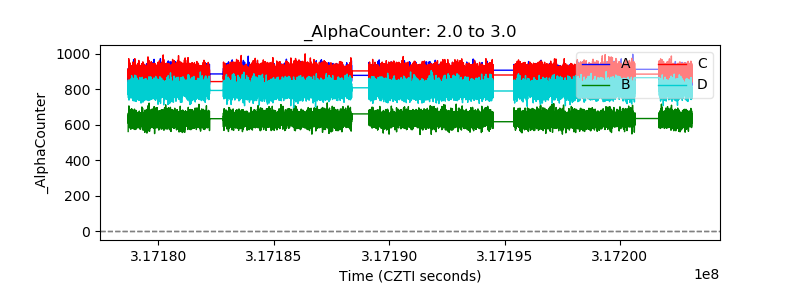 |
| _CPM_Rate | 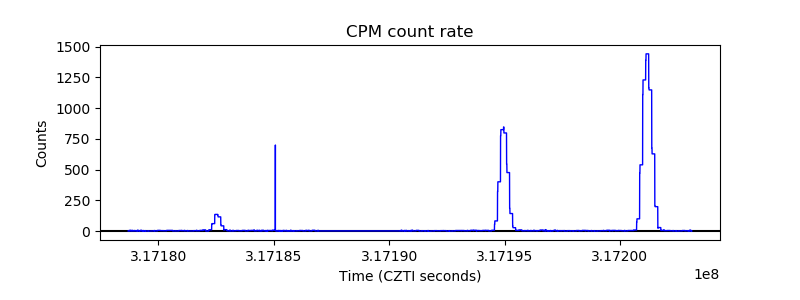 |
| CZT Counter | 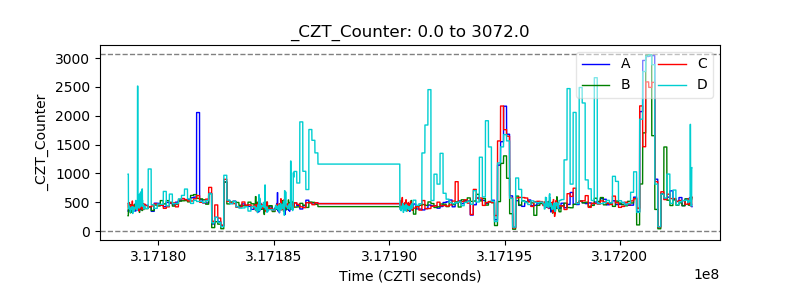 |
| +2.5 Volts monitor |  |
| +5 Volts monitor |  |
| _ROLL_ROT | 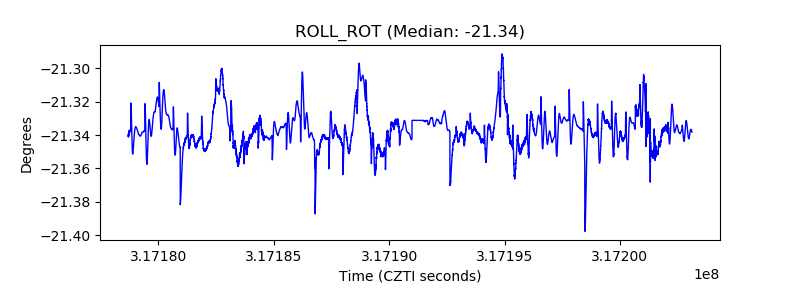 |
| _Roll_DEC | 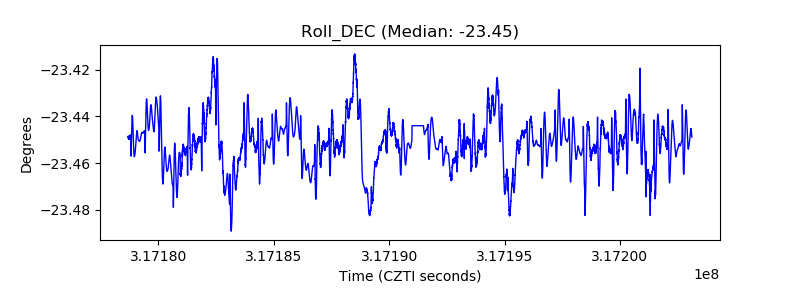 |
| _Roll_RA | 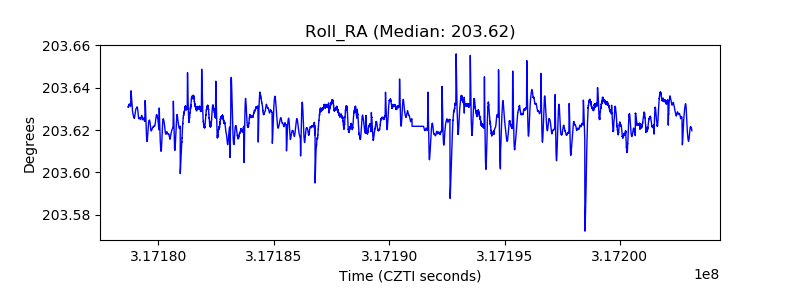 |
| Veto Counter | 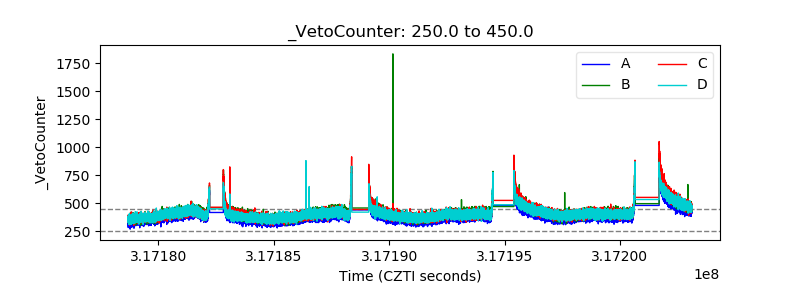 |