| Param | Original file | Final file |
|---|---|---|
| Filename | modeM0/AS1A07_148T02_9000003444_23316cztM0_level2.evt | modeM0/AS1A07_148T02_9000003444_23316cztM0_level2_quad_clean.evt |
| Size (bytes) | 2,793,352,320 | 495,074,880 |
| Size | 2.6 GB | 472.1 MB |
| Events in quadrant A | 19,178,226 | 3,116,394 |
| Events in quadrant B | 19,288,586 | 3,154,987 |
| Events in quadrant C | 19,756,164 | 3,046,154 |
| Events in quadrant D | 23,709,959 | 2,967,000 |
| Mode M9 | |||
|---|---|---|---|
| Quadrant | BADHDUFLAG | Total packets | Discarded packets |
| A | 0 | 47 | 0 |
| B | 0 | 47 | 0 |
| C | 0 | 47 | 0 |
| D | 0 | 47 | 0 |
| Mode SS | |||
|---|---|---|---|
| Quadrant | BADHDUFLAG | Total packets | Discarded packets |
| A | 0 | 804 | 0 |
| B | 0 | 804 | 0 |
| C | 0 | 804 | 0 |
| D | 0 | 804 | 0 |
| Mode M0 | |||
|---|---|---|---|
| Quadrant | BADHDUFLAG | Total packets | Discarded packets |
| A | 0 | 82709 | 8 |
| B | 0 | 82256 | 7 |
| C | 0 | 83194 | 7 |
| D | 0 | 96841 | 7 |
| Quadrant | Total seconds | Saturated seconds | Saturation percentage |
|---|---|---|---|
| A | 39480 | 301 | 0.762411% |
| B | 39481 | 309 | 0.782655% |
| C | 39481 | 540 | 1.367747% |
| D | 39482 | 745 | 1.886936% |
Noise dominated data is calculated using 1-second bins in cleaned event files. If a bin has >2000 counts, and if more than 50% of those come from <1% of pixels, then it is considered to be noise-dominated and hence unusable.
| Quadrant | # 1 sec bins | Bins with >0 counts | Bins with >2000 counts | High rate bins dominated by noise | Noise dominated (total time) | Noise dominated (detector-on time) | Marked lightcurve |
|---|---|---|---|---|---|---|---|
| A | 50820 | 39488 | 72 | 72 | 0.14% | 0.18% |  |
| B | 50821 | 39488 | 8 | 8 | 0.02% | 0.02% | 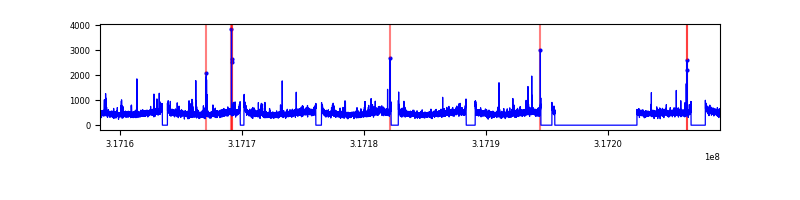 |
| C | 50821 | 39488 | 46 | 46 | 0.09% | 0.12% |  |
| D | 50821 | 39489 | 527 | 527 | 1.04% | 1.33% | 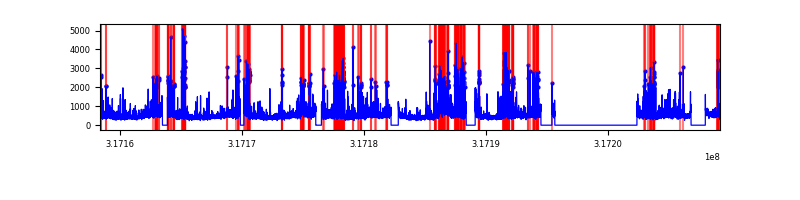 |
Top three noisy pixels from each quadrant. If the there are fewer than three noisy pixels in the level2.evt file, extra rows are filled as -1
| Pixel properties | Quadrant properties | ||||||
|---|---|---|---|---|---|---|---|
| Quadrant | DetID | PixID | Counts | Sigma | Mean | Median | Sigma |
| A | 6 | 16 | 475683 | 484.05 | 4852 | 4739 | 972.9 |
| A | 13 | 254 | 62726 | 59.6 | 4852 | 4739 | 972.9 |
| A | 3 | 137 | 42267 | 38.57 | 4852 | 4739 | 972.9 |
| B | 0 | 230 | 141389 | 149.75 | 4822 | 4703 | 912.8 |
| B | 12 | 111 | 113088 | 118.74 | 4822 | 4703 | 912.8 |
| B | 11 | 111 | 99914 | 104.31 | 4822 | 4703 | 912.8 |
| C | 14 | 238 | 738982 | 674.12 | 4675 | 4709 | 1089.2 |
| C | 10 | 9 | 610960 | 556.58 | 4675 | 4709 | 1089.2 |
| C | 7 | 247 | 98547 | 86.15 | 4675 | 4709 | 1089.2 |
| D | 1 | 52 | 3061102 | 2675.23 | 4721 | 4593 | 1142.5 |
| D | 7 | 238 | 2179207 | 1903.35 | 4721 | 4593 | 1142.5 |
| D | 1 | 239 | 261304 | 224.69 | 4721 | 4593 | 1142.5 |
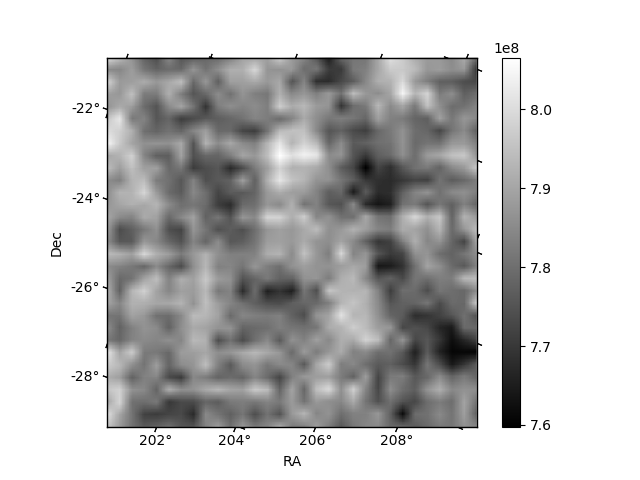
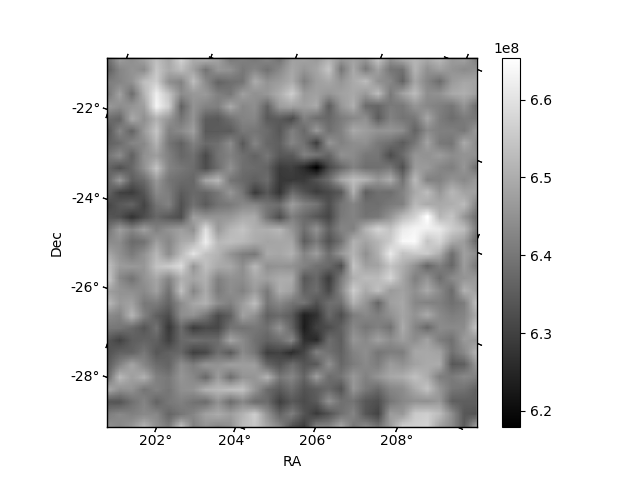
Histogram calculated using DETX and DETY for each event in the final _common_clean file
| Quadrant A | 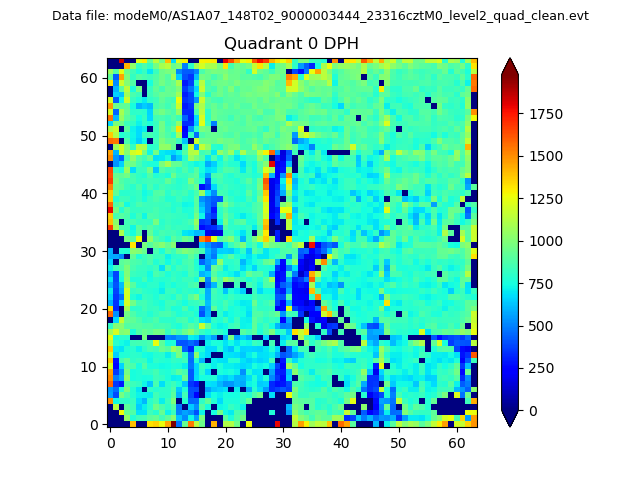 |
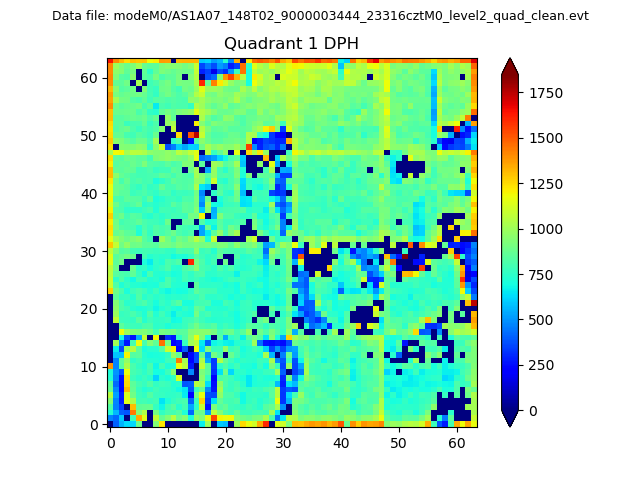 |
Quadrant B |
|---|---|---|---|
| Quadrant D |  |
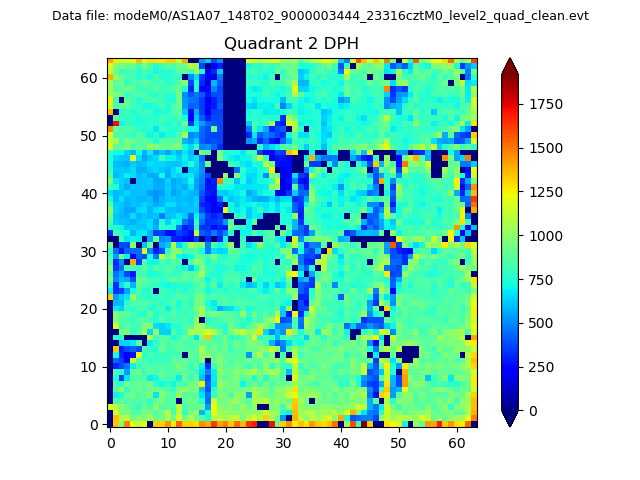 |
Quadrant C |
| Plot type | Count rate plots | Images |
|---|---|---|
| Comparison with Poisson distribution Blue bars denote a histogram of data divided into 1 sec bins. Red curve is a Poisson curve with rate = median count rate of data. |
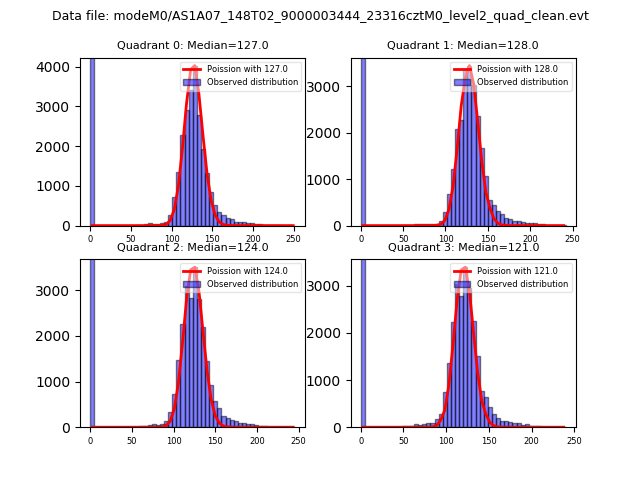 |
 |
| Quadrant-wise count rates Data is divided into 100 sec bins |
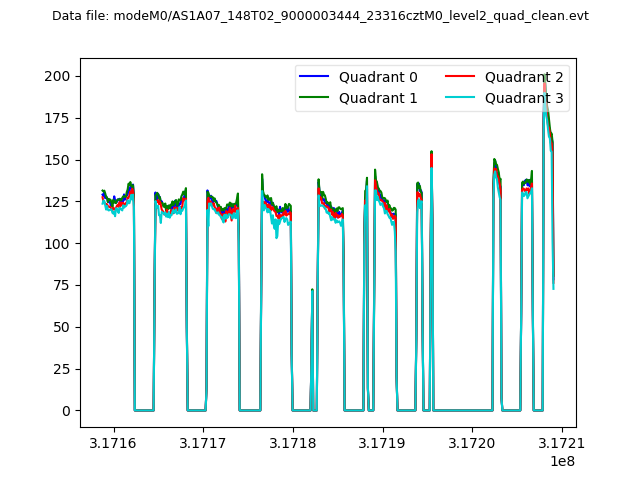 |
|
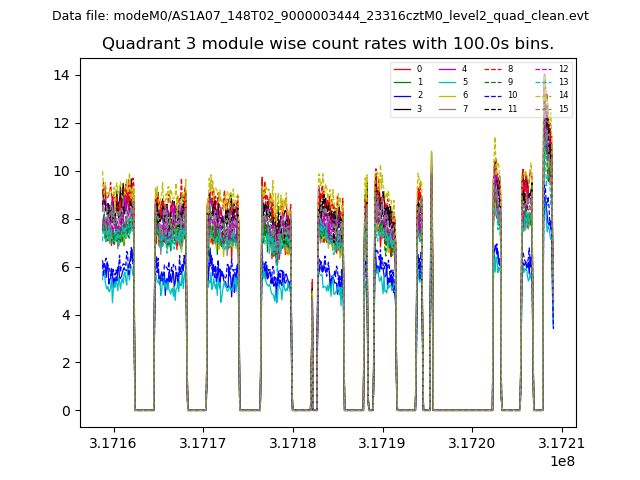
| Module-wise count rates for Quadrant A Data is divided into 100 sec bins |
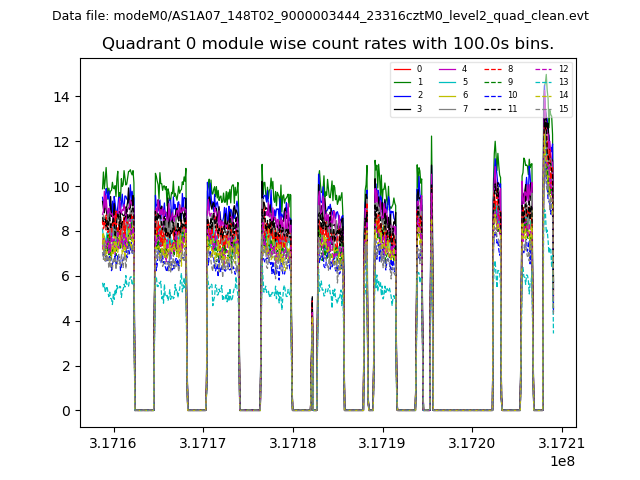 |
 |
| Module-wise count rates for Quadrant B Data is divided into 100 sec bins |
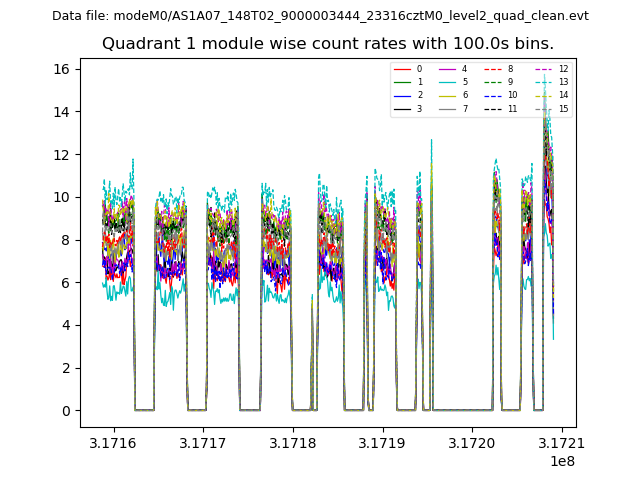 |
 |
| Module-wise count rates for Quadrant C Data is divided into 100 sec bins |
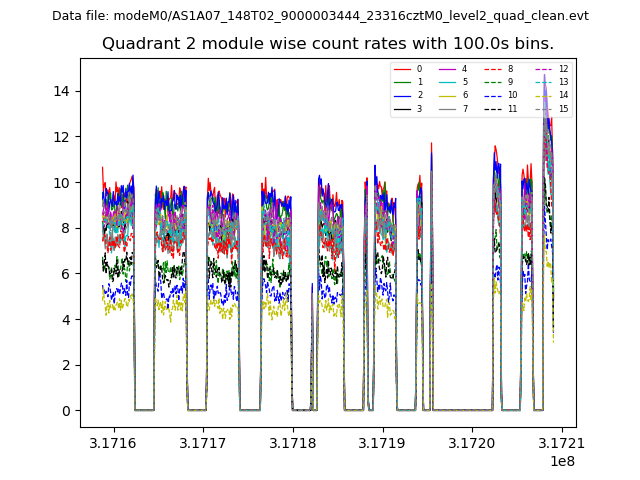 |
 |
| Module-wise count rates for Quadrant D Data is divided into 100 sec bins |
 |
 |
| Parameter | Plot |
|---|---|
| CZT HV Monitor | 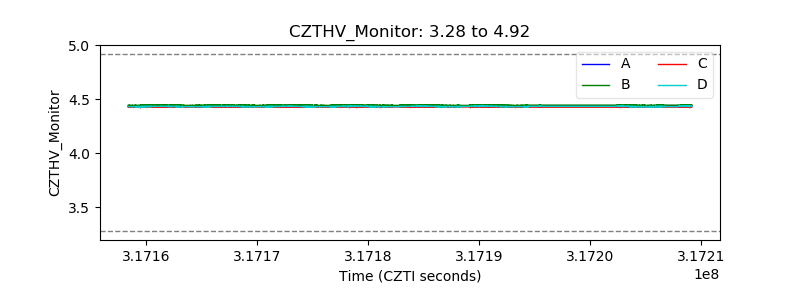 |
| D_VDD | 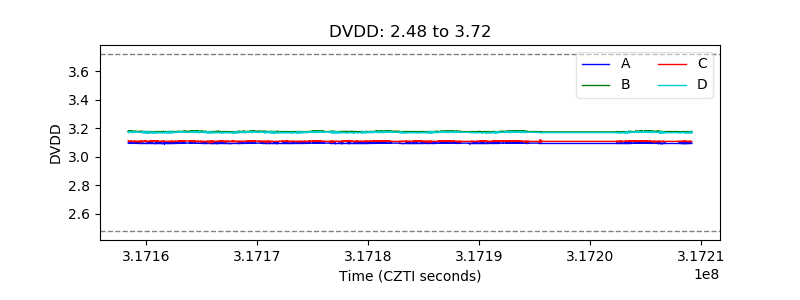 |
| Temperature 1 | 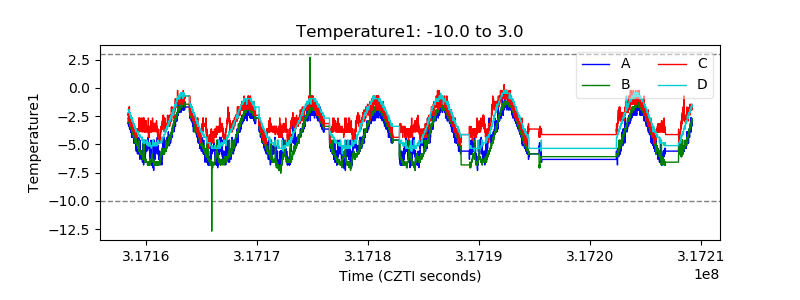 |
| Veto HV Monitor | 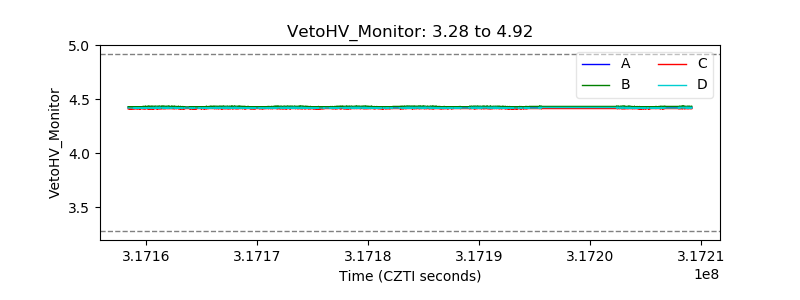 |
| Veto LLD |  |
| Alpha Counter | 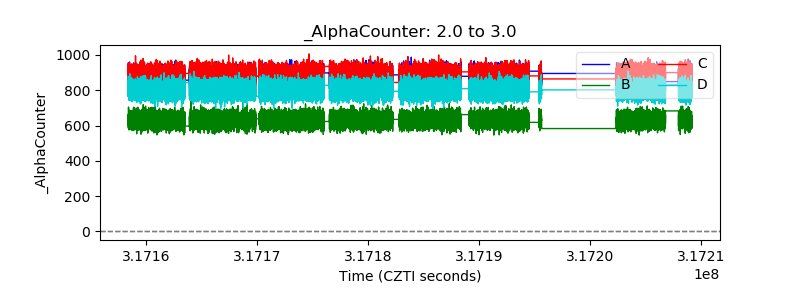 |
| _CPM_Rate | 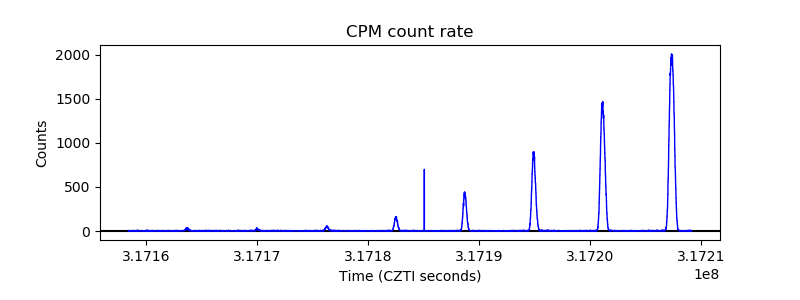 |
| CZT Counter | 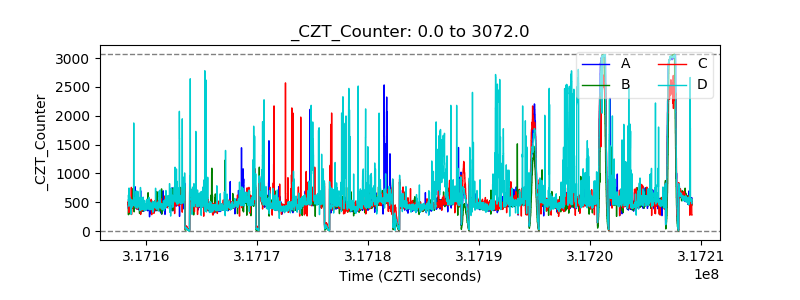 |
| +2.5 Volts monitor |  |
| +5 Volts monitor |  |
| _ROLL_ROT | 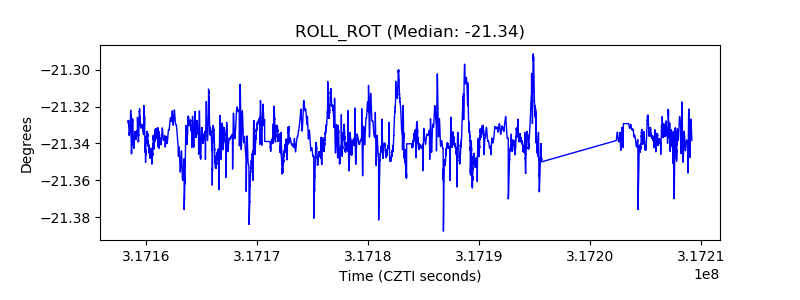 |
| _Roll_DEC | 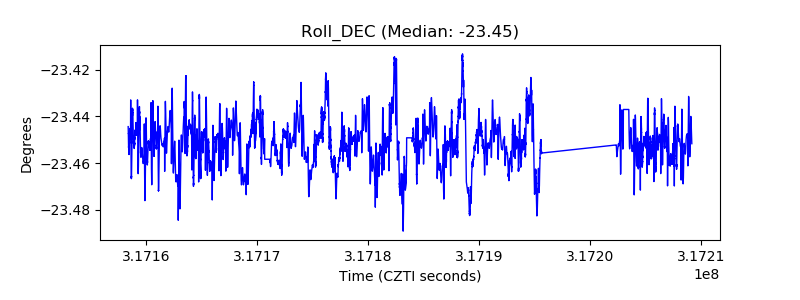 |
| _Roll_RA | 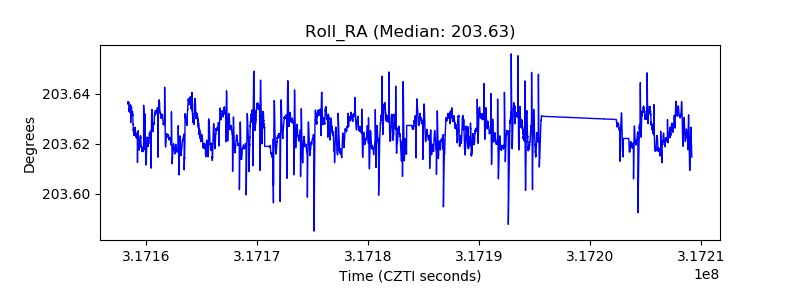 |
| Veto Counter | 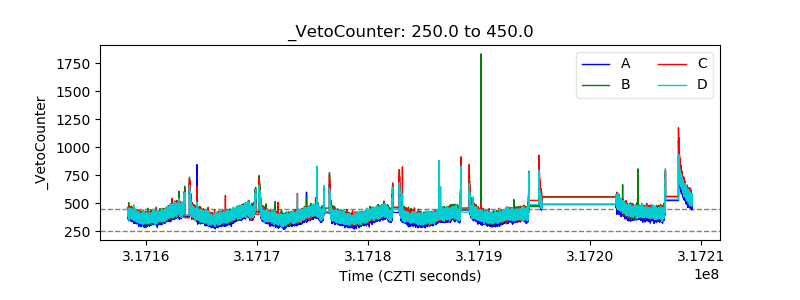 |