| Param | Original file | Final file |
|---|---|---|
| Filename | modeM0/AS1A07_148T02_9000003444_23317cztM0_level2.evt | modeM0/AS1A07_148T02_9000003444_23317cztM0_level2_quad_clean.evt |
| Size (bytes) | 476,124,480 | 84,427,200 |
| Size | 454.1 MB | 80.5 MB |
| Events in quadrant A | 3,339,609 | 544,054 |
| Events in quadrant B | 3,319,924 | 550,092 |
| Events in quadrant C | 3,421,225 | 525,820 |
| Events in quadrant D | 3,922,317 | 508,288 |
| Mode M9 | |||
|---|---|---|---|
| Quadrant | BADHDUFLAG | Total packets | Discarded packets |
| A | 0 | 13 | 0 |
| B | 0 | 13 | 0 |
| C | 0 | 13 | 0 |
| D | 0 | 13 | 0 |
| Mode SS | |||
|---|---|---|---|
| Quadrant | BADHDUFLAG | Total packets | Discarded packets |
| A | 0 | 124 | 0 |
| B | 0 | 124 | 0 |
| C | 0 | 124 | 0 |
| D | 0 | 124 | 0 |
| Mode M0 | |||
|---|---|---|---|
| Quadrant | BADHDUFLAG | Total packets | Discarded packets |
| A | 0 | 13626 | 1 |
| B | 0 | 13474 | 1 |
| C | 0 | 13843 | 1 |
| D | 0 | 15412 | 1 |
| Quadrant | Total seconds | Saturated seconds | Saturation percentage |
|---|---|---|---|
| A | 6137 | 87 | 1.417631% |
| B | 6137 | 82 | 1.336158% |
| C | 6137 | 123 | 2.004237% |
| D | 6137 | 290 | 4.725436% |
Noise dominated data is calculated using 1-second bins in cleaned event files. If a bin has >2000 counts, and if more than 50% of those come from <1% of pixels, then it is considered to be noise-dominated and hence unusable.
| Quadrant | # 1 sec bins | Bins with >0 counts | Bins with >2000 counts | High rate bins dominated by noise | Noise dominated (total time) | Noise dominated (detector-on time) | Marked lightcurve |
|---|---|---|---|---|---|---|---|
| A | 7352 | 6137 | 0 | 0 | 0.00% | 0.00% | 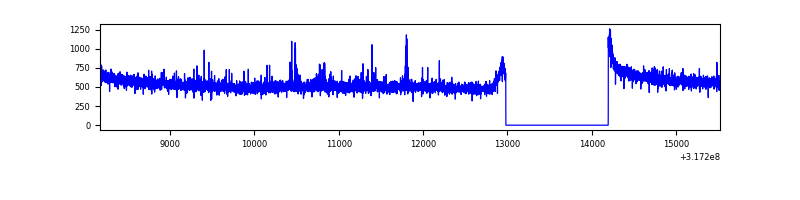 |
| B | 7352 | 6137 | 2 | 2 | 0.03% | 0.03% | 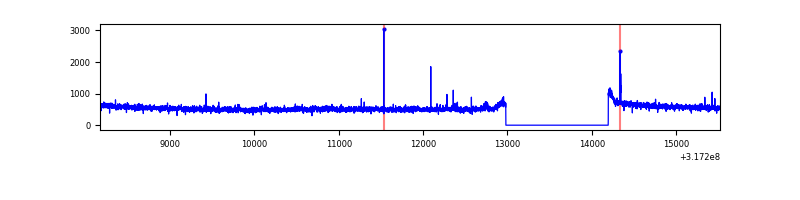 |
| C | 7352 | 6137 | 3 | 3 | 0.04% | 0.05% | 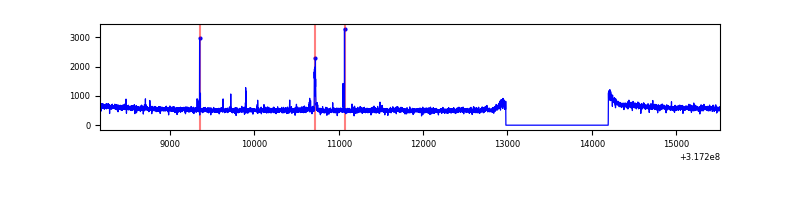 |
| D | 7352 | 6137 | 220 | 220 | 2.99% | 3.58% | 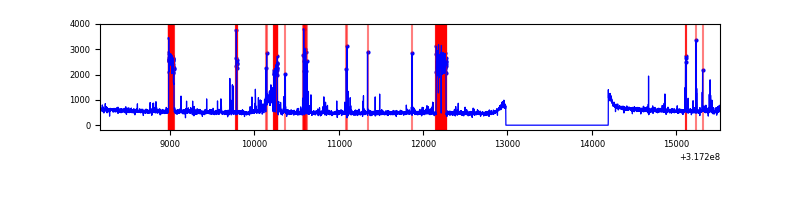 |
Top three noisy pixels from each quadrant. If the there are fewer than three noisy pixels in the level2.evt file, extra rows are filled as -1
| Pixel properties | Quadrant properties | ||||||
|---|---|---|---|---|---|---|---|
| Quadrant | DetID | PixID | Counts | Sigma | Mean | Median | Sigma |
| A | 6 | 16 | 39498 | 227.25 | 856 | 842 | 170.1 |
| A | 13 | 254 | 9857 | 53.0 | 856 | 842 | 170.1 |
| A | 0 | 226 | 7430 | 38.73 | 856 | 842 | 170.1 |
| B | 12 | 111 | 17962 | 109.65 | 838 | 818 | 156.4 |
| B | 11 | 111 | 16097 | 97.72 | 838 | 818 | 156.4 |
| B | 14 | 111 | 14168 | 85.38 | 838 | 818 | 156.4 |
| C | 14 | 238 | 131542 | 695.78 | 817 | 824 | 187.9 |
| C | 10 | 9 | 68068 | 357.92 | 817 | 824 | 187.9 |
| C | 0 | 239 | 19782 | 100.91 | 817 | 824 | 187.9 |
| D | 7 | 238 | 471126 | 2385.64 | 828 | 808 | 197.1 |
| D | 1 | 52 | 214948 | 1086.2 | 828 | 808 | 197.1 |
| D | 7 | 38 | 57496 | 287.54 | 828 | 808 | 197.1 |
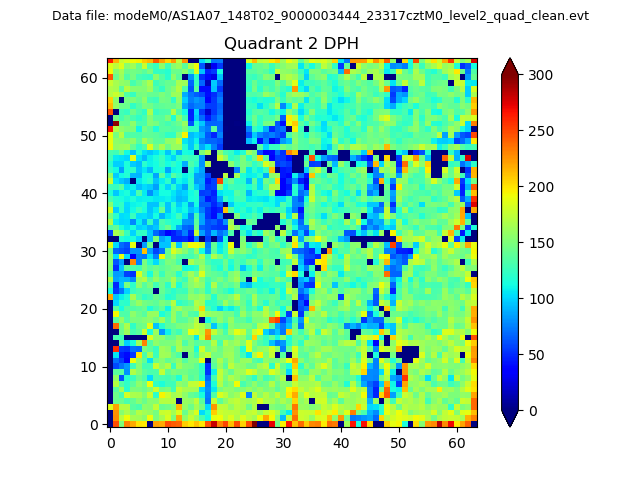
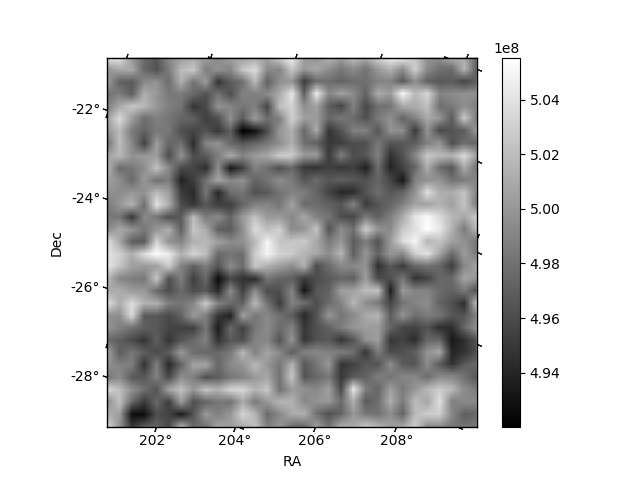
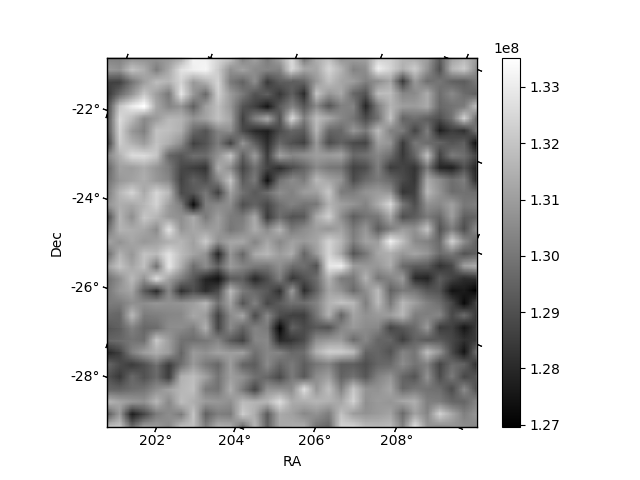
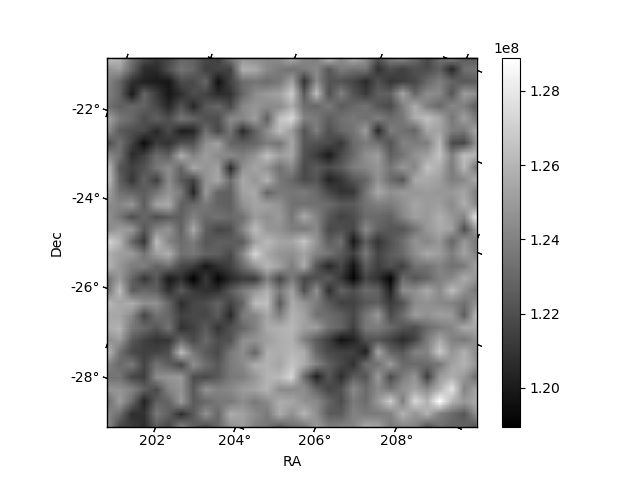
Histogram calculated using DETX and DETY for each event in the final _common_clean file
| Quadrant A | 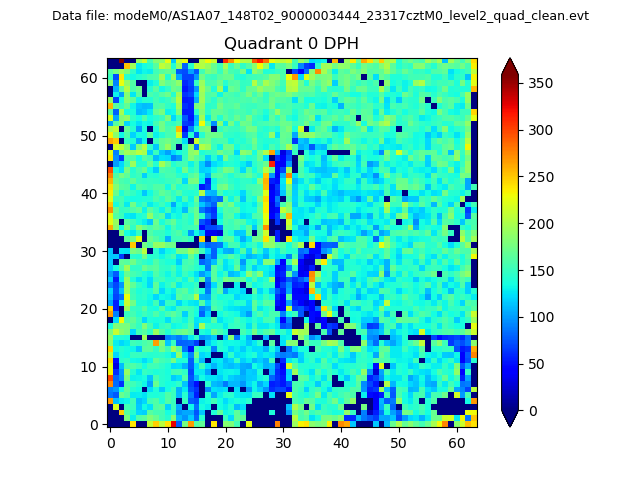 |
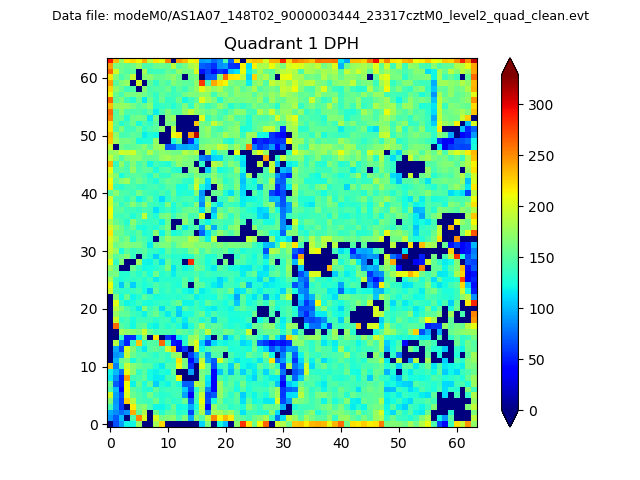 |
Quadrant B |
|---|---|---|---|
| Quadrant D | 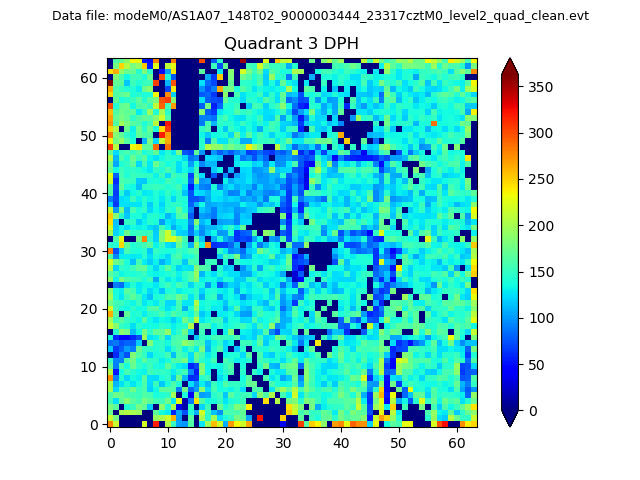 |
 |
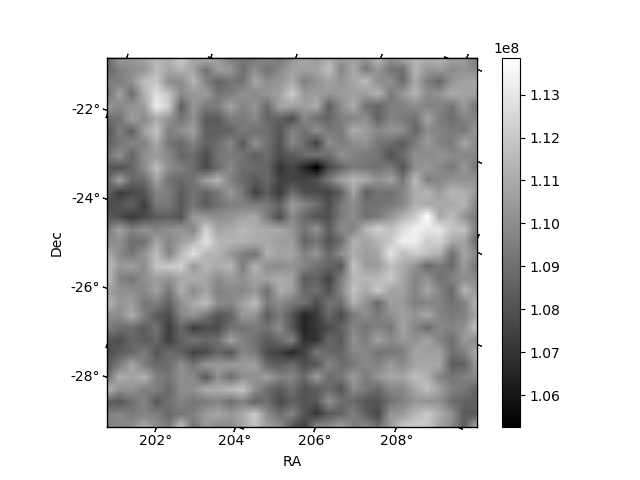
Quadrant C |
| Plot type | Count rate plots | Images |
|---|---|---|
| Comparison with Poisson distribution Blue bars denote a histogram of data divided into 1 sec bins. Red curve is a Poisson curve with rate = median count rate of data. |
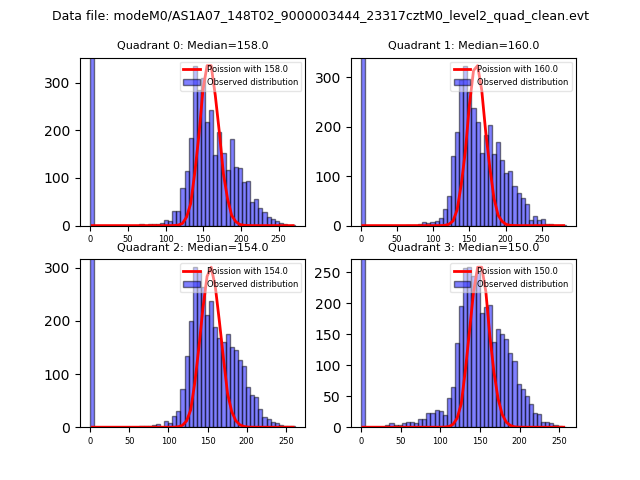 |
 |
| Quadrant-wise count rates Data is divided into 100 sec bins |
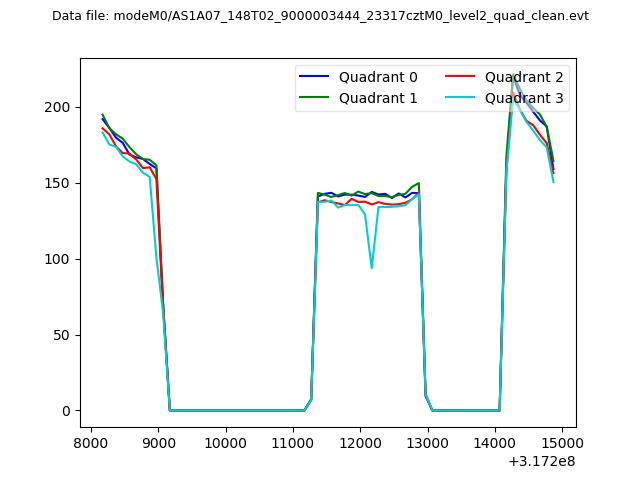 |
|
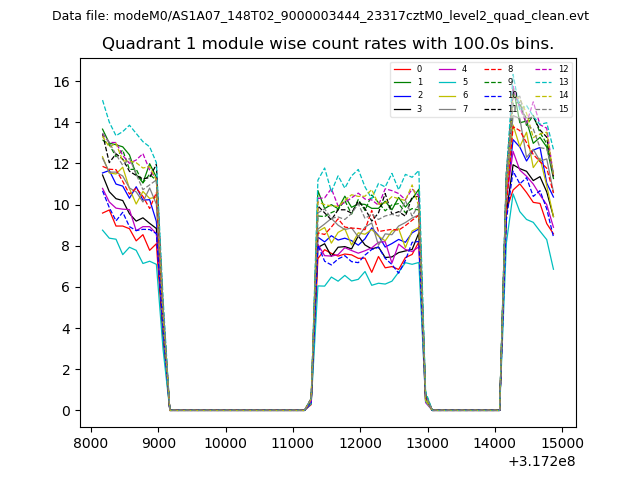
| Module-wise count rates for Quadrant A Data is divided into 100 sec bins |
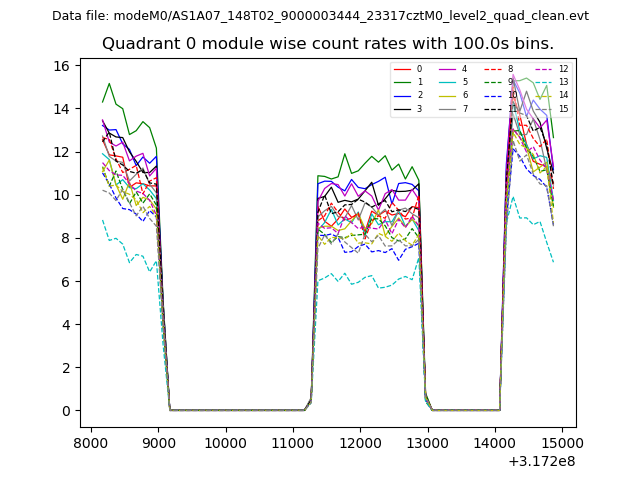 |
 |
| Module-wise count rates for Quadrant B Data is divided into 100 sec bins |
 |
 |
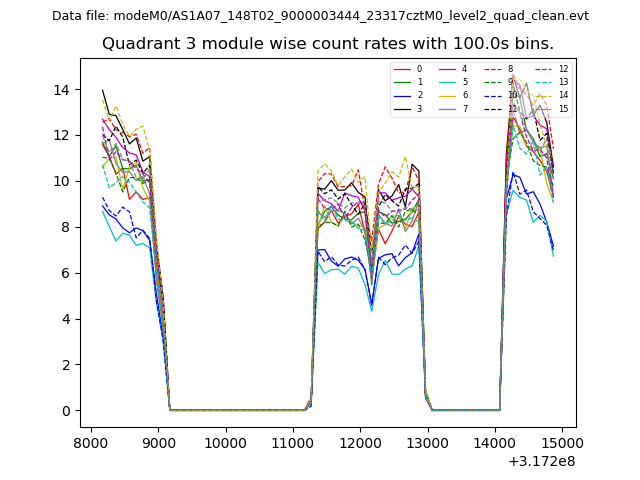
| Module-wise count rates for Quadrant C Data is divided into 100 sec bins |
 |
 |
| Module-wise count rates for Quadrant D Data is divided into 100 sec bins |
 |
 |
| Parameter | Plot |
|---|---|
| CZT HV Monitor | 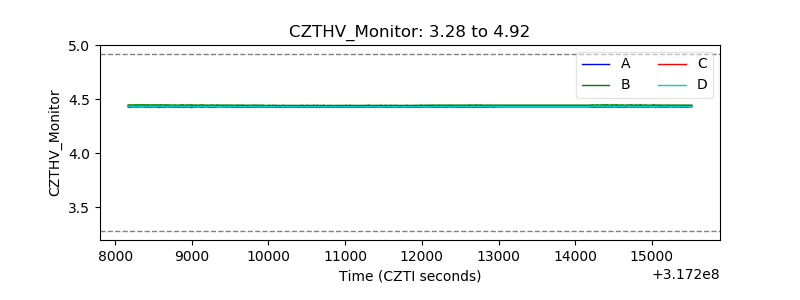 |
| D_VDD | 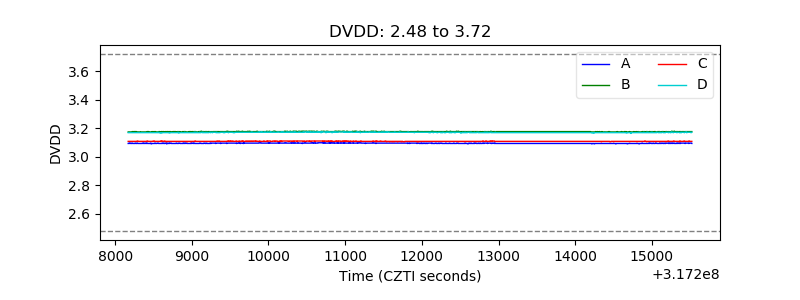 |
| Temperature 1 | 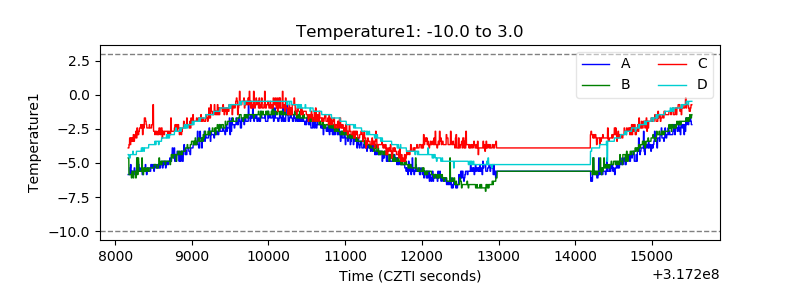 |
| Veto HV Monitor | 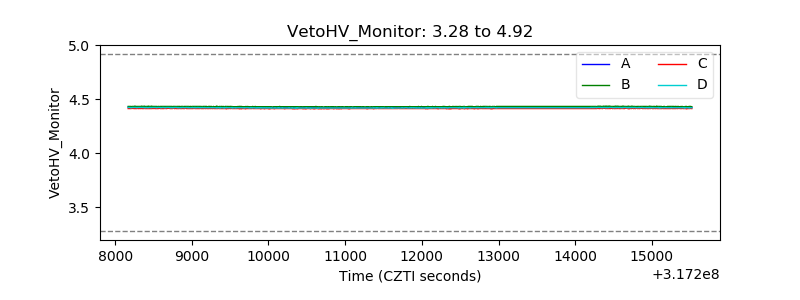 |
| Veto LLD | 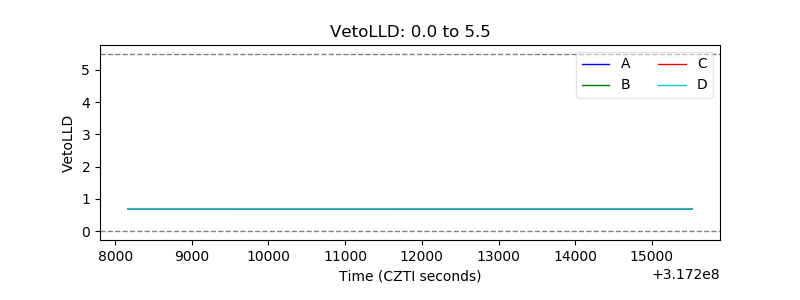 |
| Alpha Counter |  |
| _CPM_Rate | 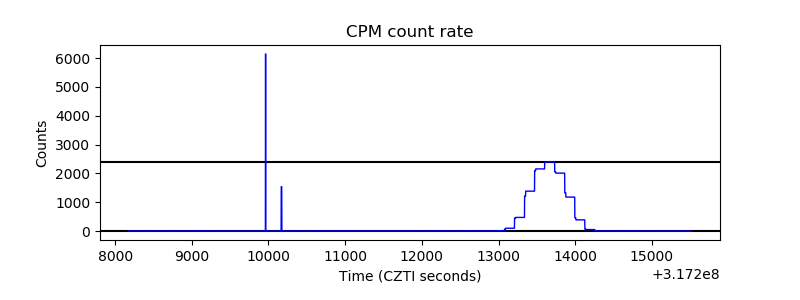 |
| CZT Counter | 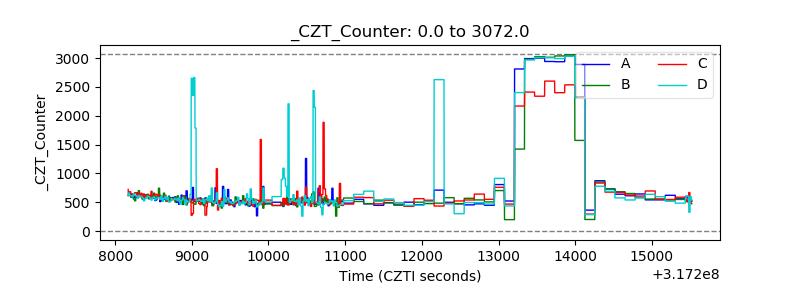 |
| +2.5 Volts monitor |  |
| +5 Volts monitor |  |
| _ROLL_ROT | 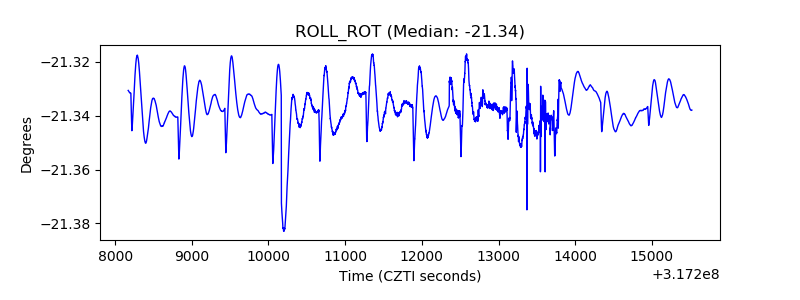 |
| _Roll_DEC | 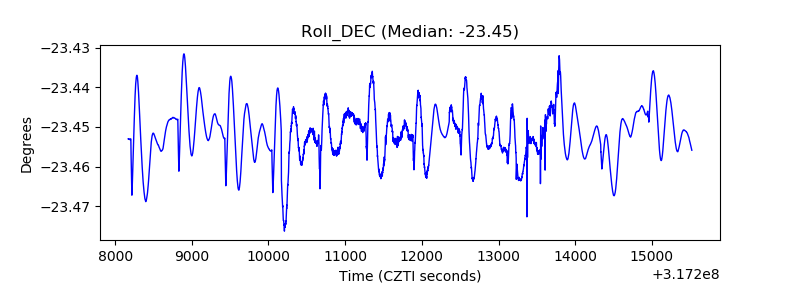 |
| _Roll_RA | 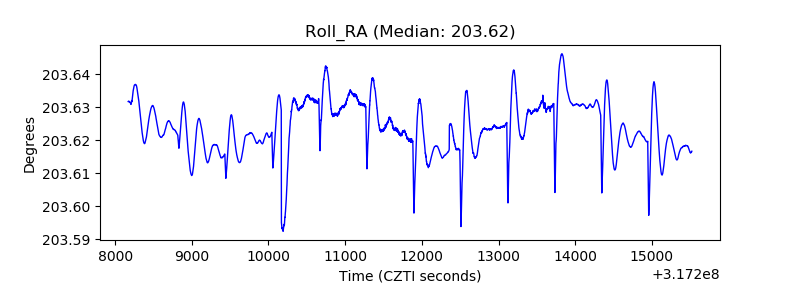 |
| Veto Counter | 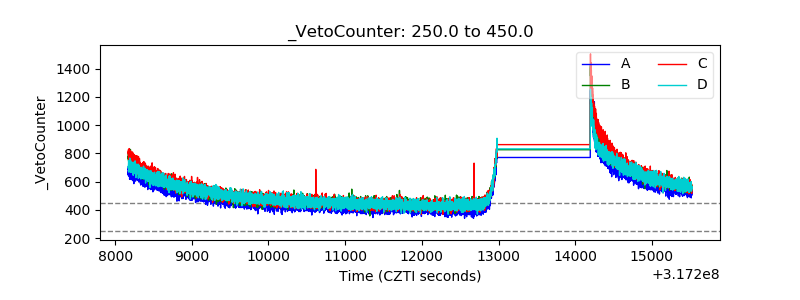 |