| Param | Original file | Final file |
|---|---|---|
| Filename | modeM0/AS1A07_148T02_9000003444_23318cztM0_level2.evt | modeM0/AS1A07_148T02_9000003444_23318cztM0_level2_quad_clean.evt |
| Size (bytes) | 546,425,280 | 79,755,840 |
| Size | 521.1 MB | 76.1 MB |
| Events in quadrant A | 3,575,953 | 516,529 |
| Events in quadrant B | 3,582,530 | 519,650 |
| Events in quadrant C | 3,814,972 | 495,194 |
| Events in quadrant D | 5,146,730 | 442,295 |
| Mode M9 | |||
|---|---|---|---|
| Quadrant | BADHDUFLAG | Total packets | Discarded packets |
| A | 0 | 12 | 0 |
| B | 0 | 13 | 0 |
| C | 0 | 13 | 0 |
| D | 0 | 13 | 0 |
| Mode SS | |||
|---|---|---|---|
| Quadrant | BADHDUFLAG | Total packets | Discarded packets |
| A | 0 | 128 | 0 |
| B | 0 | 128 | 0 |
| C | 0 | 128 | 0 |
| D | 0 | 128 | 0 |
| Mode M0 | |||
|---|---|---|---|
| Quadrant | BADHDUFLAG | Total packets | Discarded packets |
| A | 0 | 14530 | 2 |
| B | 0 | 14531 | 2 |
| C | 0 | 15354 | 2 |
| D | 0 | 19400 | 2 |
| Quadrant | Total seconds | Saturated seconds | Saturation percentage |
|---|---|---|---|
| A | 6320 | 164 | 2.594937% |
| B | 6320 | 161 | 2.547468% |
| C | 6319 | 227 | 3.592341% |
| D | 6319 | 656 | 10.381389% |
Noise dominated data is calculated using 1-second bins in cleaned event files. If a bin has >2000 counts, and if more than 50% of those come from <1% of pixels, then it is considered to be noise-dominated and hence unusable.
| Quadrant | # 1 sec bins | Bins with >0 counts | Bins with >2000 counts | High rate bins dominated by noise | Noise dominated (total time) | Noise dominated (detector-on time) | Marked lightcurve |
|---|---|---|---|---|---|---|---|
| A | 7570 | 6320 | 0 | 0 | 0.00% | 0.00% | 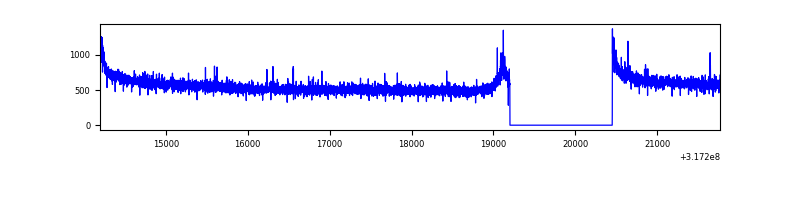 |
| B | 7570 | 6320 | 2 | 2 | 0.03% | 0.03% |  |
| C | 7569 | 6319 | 19 | 19 | 0.25% | 0.30% | 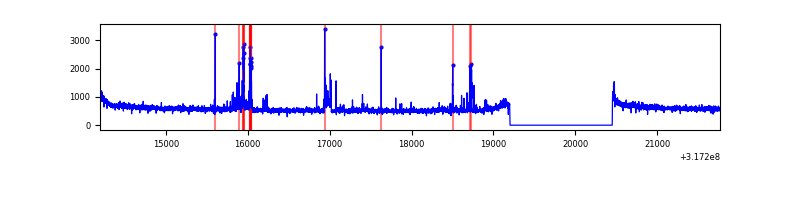 |
| D | 7569 | 6319 | 544 | 544 | 7.19% | 8.61% | 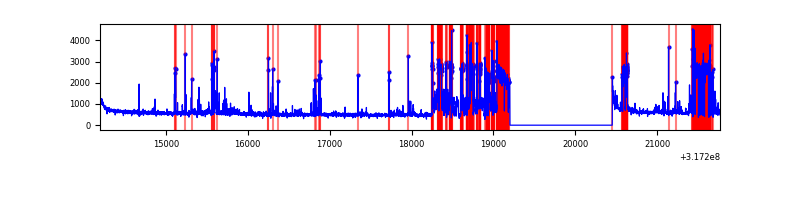 |
Top three noisy pixels from each quadrant. If the there are fewer than three noisy pixels in the level2.evt file, extra rows are filled as -1
| Pixel properties | Quadrant properties | ||||||
|---|---|---|---|---|---|---|---|
| Quadrant | DetID | PixID | Counts | Sigma | Mean | Median | Sigma |
| A | 6 | 16 | 15376 | 79.68 | 924 | 908 | 181.6 |
| A | 13 | 254 | 10183 | 51.08 | 924 | 908 | 181.6 |
| A | 0 | 226 | 8005 | 39.08 | 924 | 908 | 181.6 |
| B | 12 | 111 | 19115 | 109.07 | 902 | 883 | 167.1 |
| B | 0 | 229 | 17584 | 99.91 | 902 | 883 | 167.1 |
| B | 11 | 111 | 17082 | 96.91 | 902 | 883 | 167.1 |
| C | 14 | 238 | 140452 | 695.48 | 874 | 881 | 200.7 |
| C | 10 | 9 | 133929 | 662.97 | 874 | 881 | 200.7 |
| C | 5 | 4 | 77618 | 382.38 | 874 | 881 | 200.7 |
| D | 7 | 238 | 1272049 | 6338.06 | 838 | 816 | 200.6 |
| D | 1 | 52 | 540103 | 2688.75 | 838 | 816 | 200.6 |
| D | 12 | 233 | 73354 | 361.66 | 838 | 816 | 200.6 |
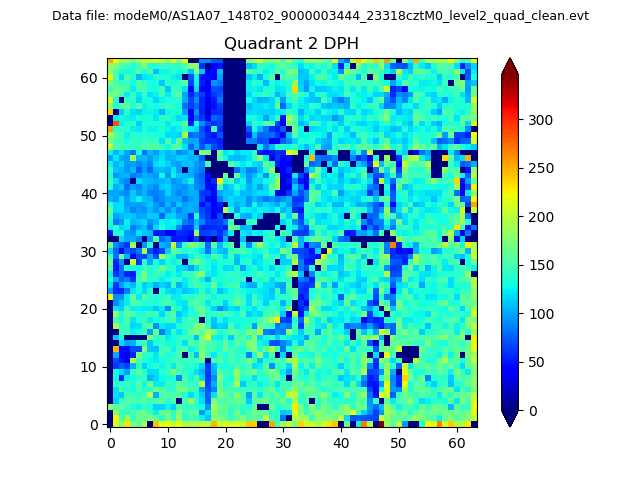
Histogram calculated using DETX and DETY for each event in the final _common_clean file
| Quadrant A | 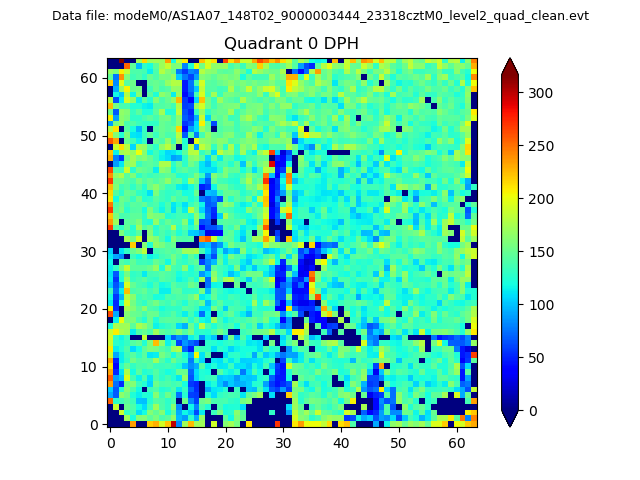 |
 |
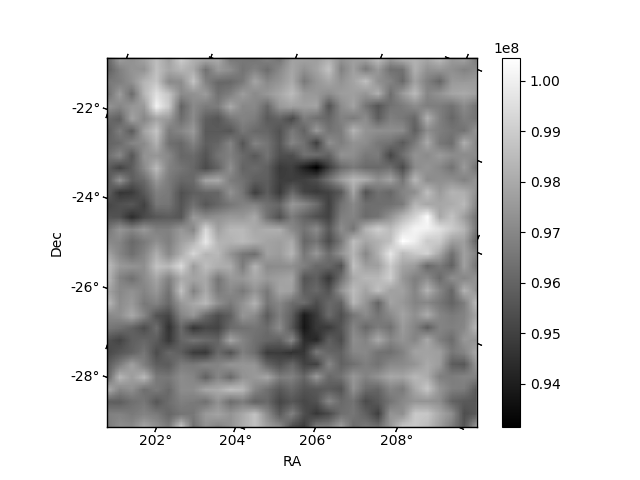
Quadrant B |
|---|---|---|---|
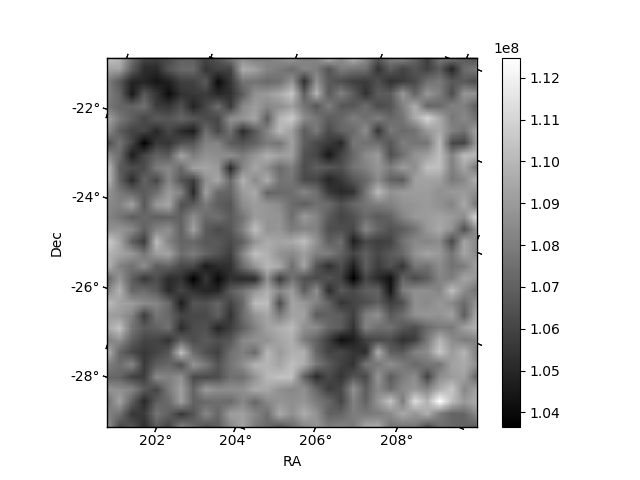
| Quadrant D | 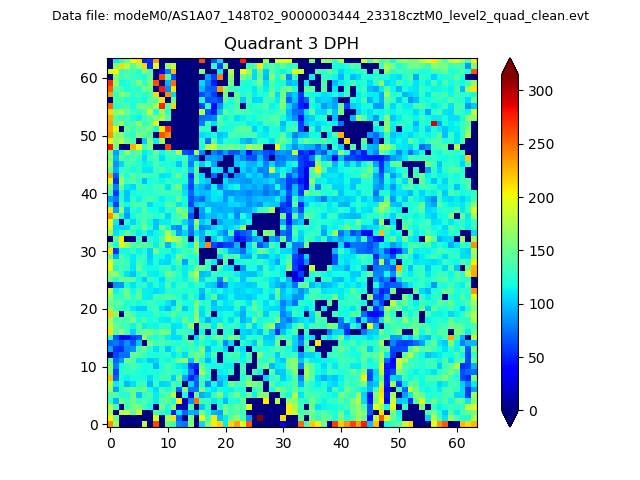 |
 |
Quadrant C |
| Plot type | Count rate plots | Images |
|---|---|---|
| Comparison with Poisson distribution Blue bars denote a histogram of data divided into 1 sec bins. Red curve is a Poisson curve with rate = median count rate of data. |
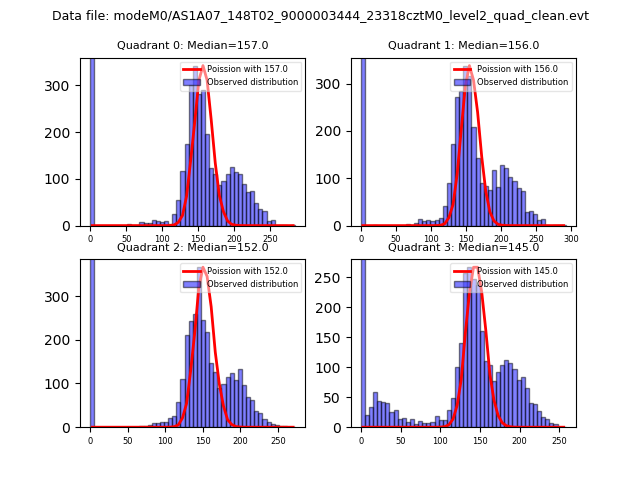 |
 |
| Quadrant-wise count rates Data is divided into 100 sec bins |
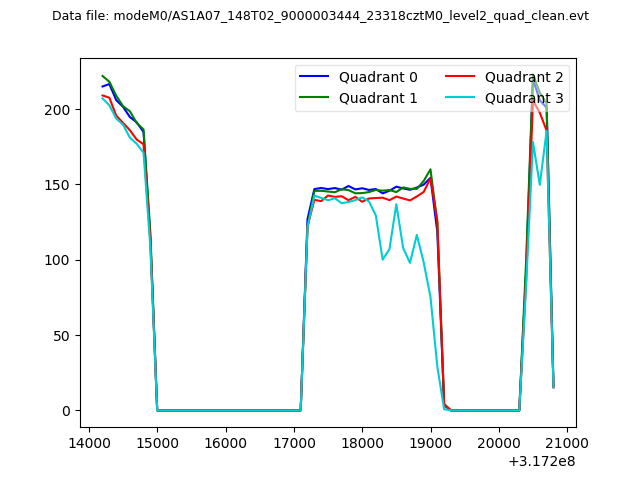 |
|
| Module-wise count rates for Quadrant A Data is divided into 100 sec bins |
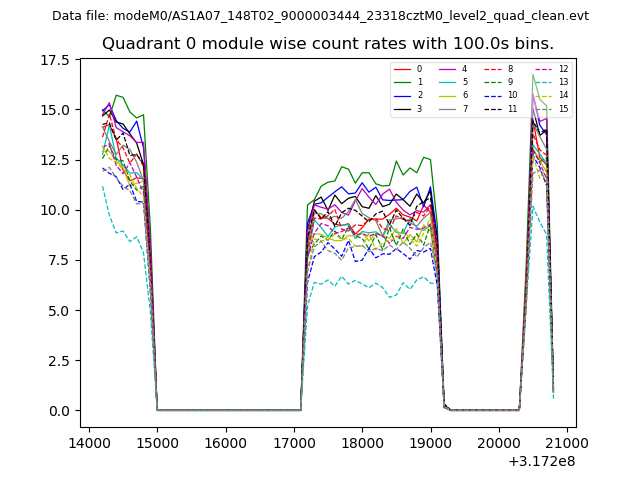 |
 |
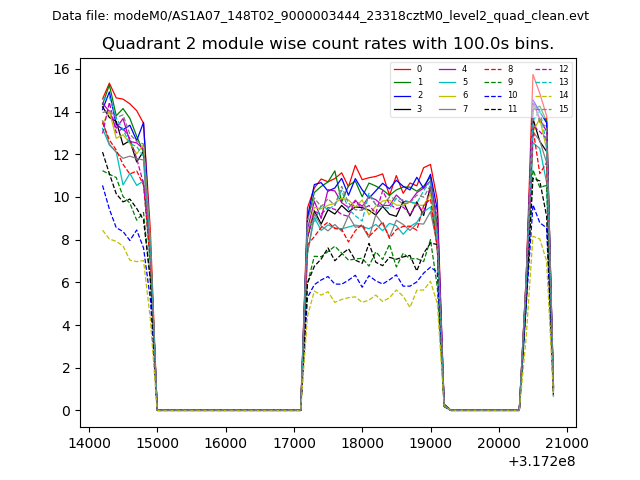
| Module-wise count rates for Quadrant B Data is divided into 100 sec bins |
 |
 |
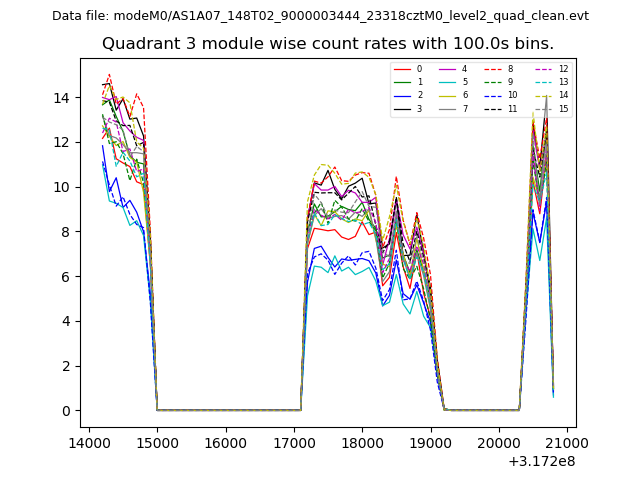
| Module-wise count rates for Quadrant C Data is divided into 100 sec bins |
 |
 |
| Module-wise count rates for Quadrant D Data is divided into 100 sec bins |
 |
 |
| Parameter | Plot |
|---|---|
| CZT HV Monitor |  |
| D_VDD | 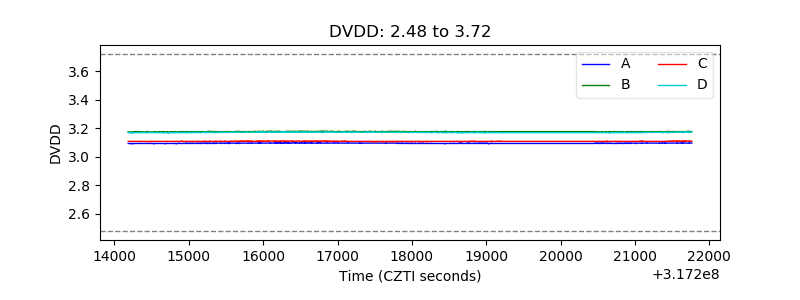 |
| Temperature 1 | 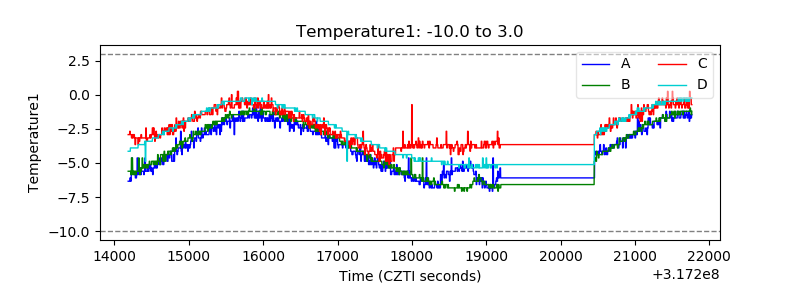 |
| Veto HV Monitor | 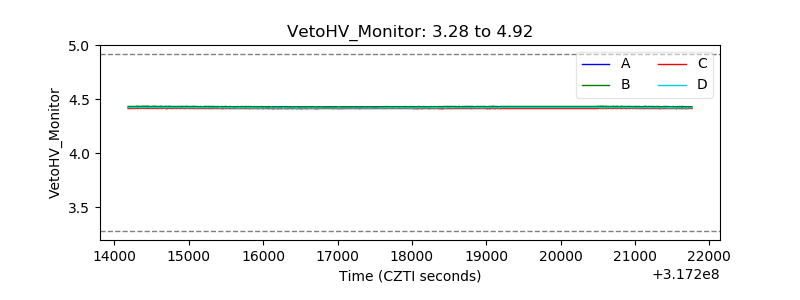 |
| Veto LLD | 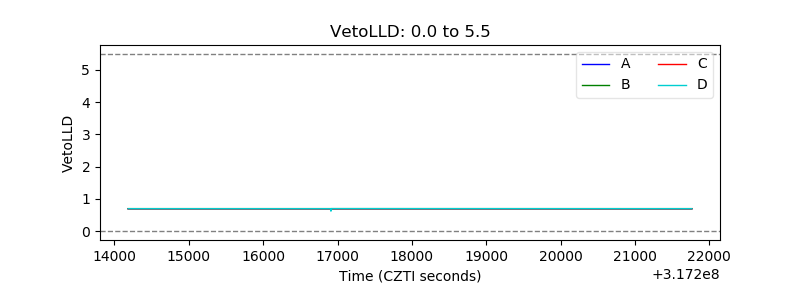 |
| Alpha Counter | 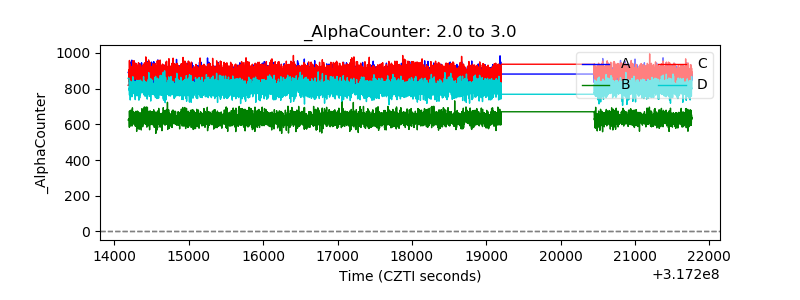 |
| _CPM_Rate | 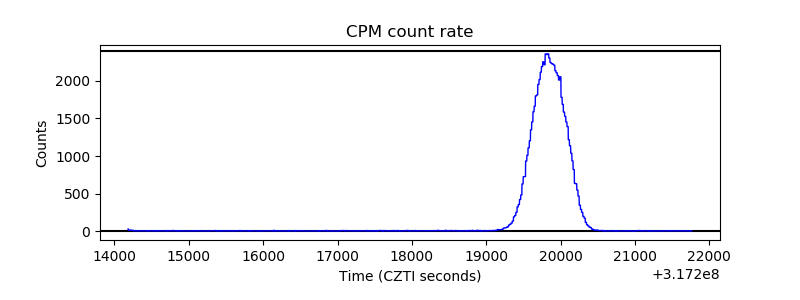 |
| CZT Counter | 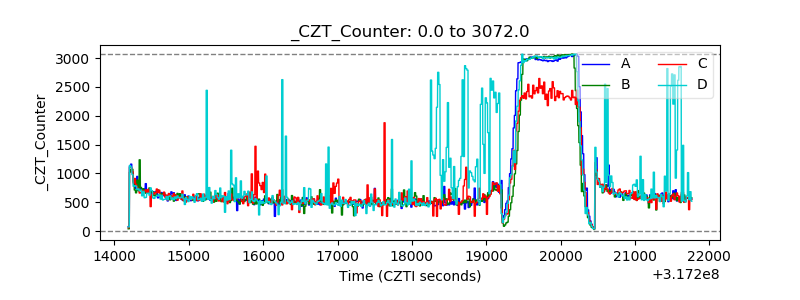 |
| +2.5 Volts monitor |  |
| +5 Volts monitor |  |
| _ROLL_ROT | 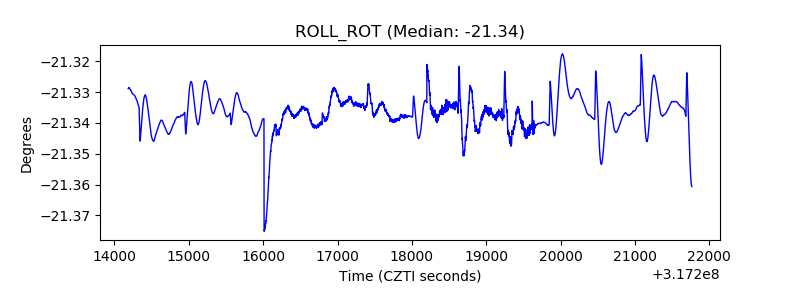 |
| _Roll_DEC | 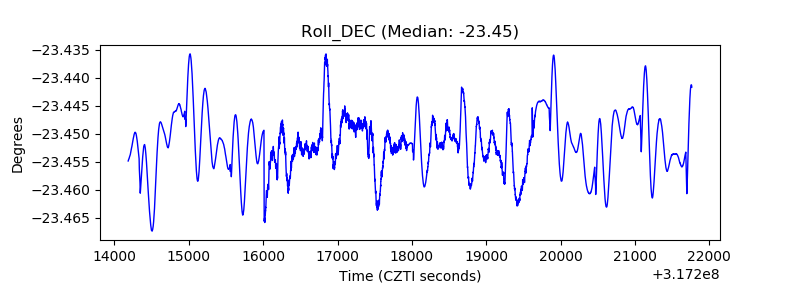 |
| _Roll_RA | 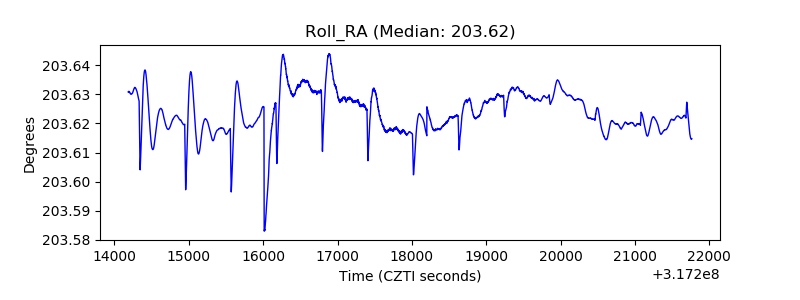 |
| Veto Counter | 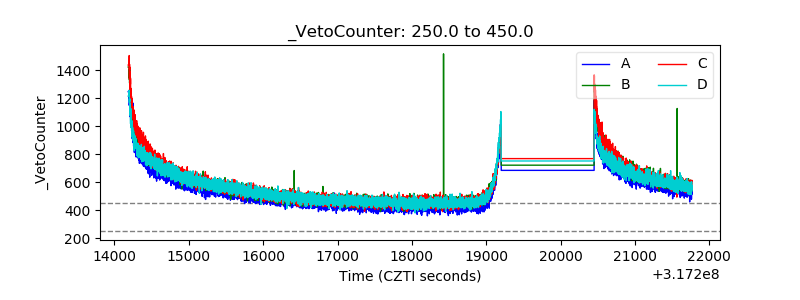 |