| Param | Original file | Final file |
|---|---|---|
| Filename | modeM0/AS1A07_148T02_9000003444_23319cztM0_level2.evt | modeM0/AS1A07_148T02_9000003444_23319cztM0_level2_quad_clean.evt |
| Size (bytes) | 274,616,640 | 26,029,440 |
| Size | 261.9 MB | 24.8 MB |
| Events in quadrant A | 1,757,602 | 147,717 |
| Events in quadrant B | 1,749,971 | 149,144 |
| Events in quadrant C | 2,101,482 | 137,599 |
| Events in quadrant D | 2,495,512 | 132,126 |
| Mode M9 | |||
|---|---|---|---|
| Quadrant | BADHDUFLAG | Total packets | Discarded packets |
| A | 0 | 1 | 0 |
| B | 0 | 2 | 0 |
| C | 0 | 2 | 0 |
| D | 0 | 2 | 0 |
| Mode SS | |||
|---|---|---|---|
| Quadrant | BADHDUFLAG | Total packets | Discarded packets |
| A | 0 | 62 | 0 |
| B | 0 | 62 | 0 |
| C | 0 | 62 | 0 |
| D | 0 | 62 | 0 |
| Mode M0 | |||
|---|---|---|---|
| Quadrant | BADHDUFLAG | Total packets | Discarded packets |
| A | 0 | 7136 | 1 |
| B | 0 | 7089 | 1 |
| C | 0 | 8254 | 1 |
| D | 0 | 9455 | 1 |
| Quadrant | Total seconds | Saturated seconds | Saturation percentage |
|---|---|---|---|
| A | 3105 | 25 | 0.805153% |
| B | 3105 | 26 | 0.837359% |
| C | 3105 | 116 | 3.735910% |
| D | 3105 | 287 | 9.243156% |
Noise dominated data is calculated using 1-second bins in cleaned event files. If a bin has >2000 counts, and if more than 50% of those come from <1% of pixels, then it is considered to be noise-dominated and hence unusable.
| Quadrant | # 1 sec bins | Bins with >0 counts | Bins with >2000 counts | High rate bins dominated by noise | Noise dominated (total time) | Noise dominated (detector-on time) | Marked lightcurve |
|---|---|---|---|---|---|---|---|
| A | 3105 | 3105 | 0 | 0 | 0.00% | 0.00% |  |
| B | 3105 | 3105 | 0 | 0 | 0.00% | 0.00% | 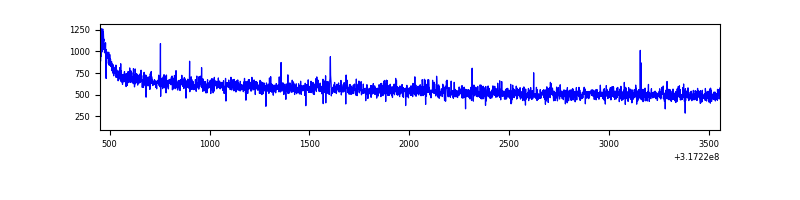 |
| C | 3105 | 3105 | 46 | 46 | 1.48% | 1.48% | 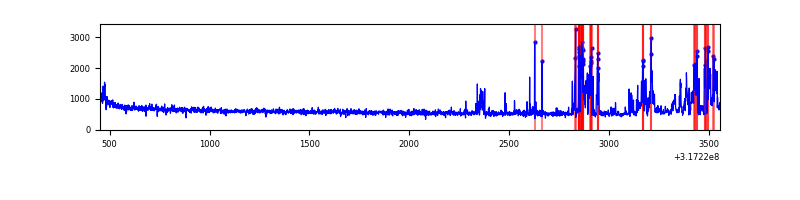 |
| D | 3105 | 3105 | 255 | 255 | 8.21% | 8.21% | 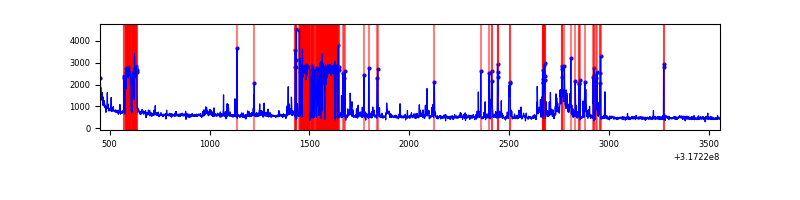 |
Top three noisy pixels from each quadrant. If the there are fewer than three noisy pixels in the level2.evt file, extra rows are filled as -1
| Pixel properties | Quadrant properties | ||||||
|---|---|---|---|---|---|---|---|
| Quadrant | DetID | PixID | Counts | Sigma | Mean | Median | Sigma |
| A | 6 | 16 | 7738 | 80.54 | 454 | 446 | 90.5 |
| A | 13 | 254 | 5046 | 50.81 | 454 | 446 | 90.5 |
| A | 0 | 226 | 4156 | 40.98 | 454 | 446 | 90.5 |
| B | 12 | 111 | 8995 | 103.58 | 442 | 435 | 82.6 |
| B | 0 | 190 | 8185 | 93.78 | 442 | 435 | 82.6 |
| B | 11 | 111 | 8142 | 93.26 | 442 | 435 | 82.6 |
| C | 10 | 9 | 351544 | 3617.34 | 422 | 427 | 97.1 |
| C | 14 | 238 | 69604 | 712.69 | 422 | 427 | 97.1 |
| C | 7 | 247 | 22271 | 225.04 | 422 | 427 | 97.1 |
| D | 1 | 52 | 452410 | 4472.92 | 414 | 404 | 101.1 |
| D | 13 | 104 | 191255 | 1888.61 | 414 | 404 | 101.1 |
| D | 7 | 238 | 181397 | 1791.05 | 414 | 404 | 101.1 |
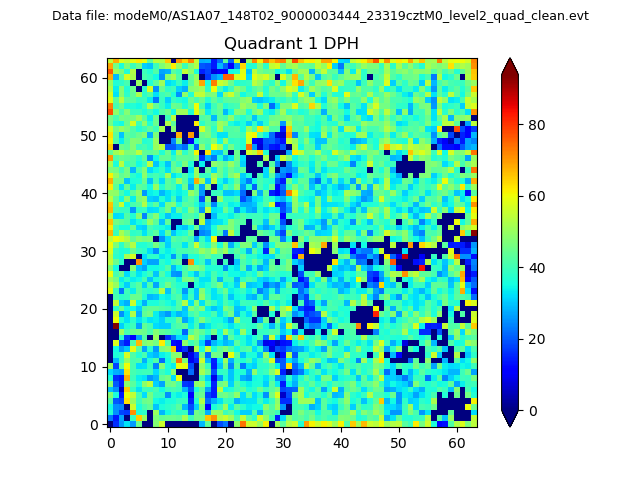
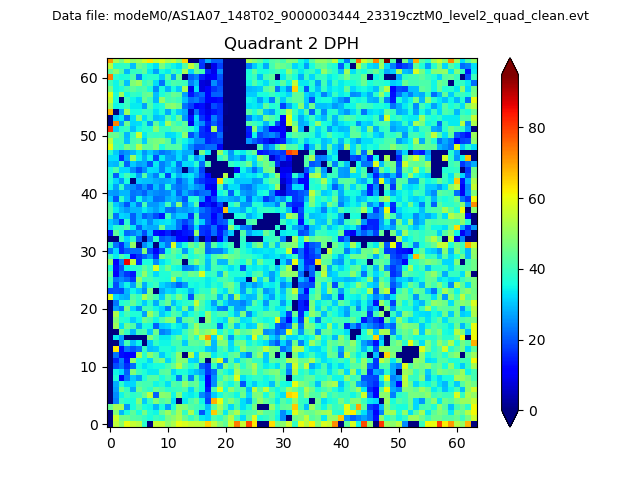
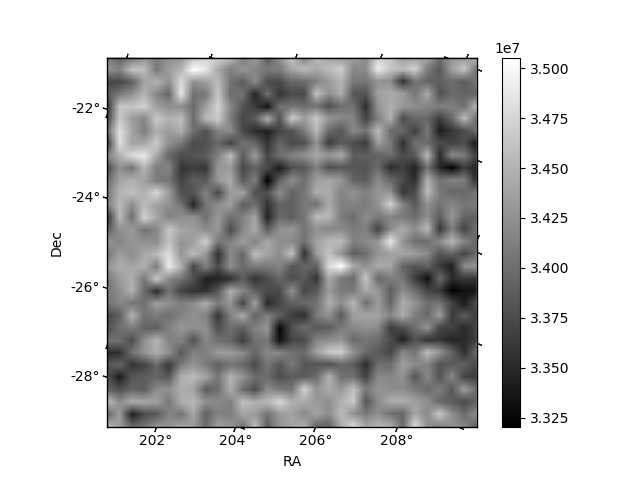
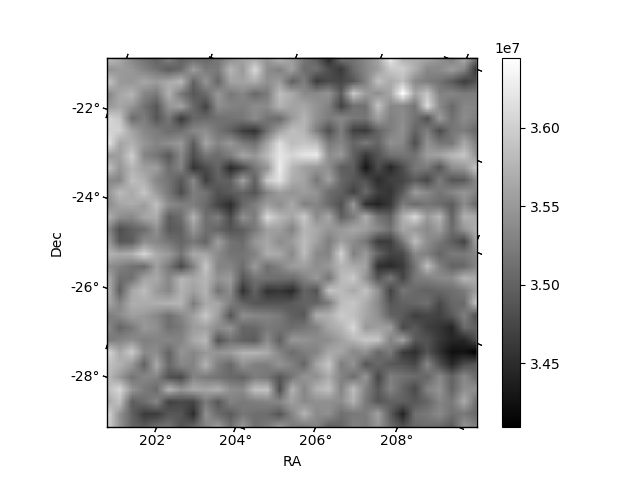
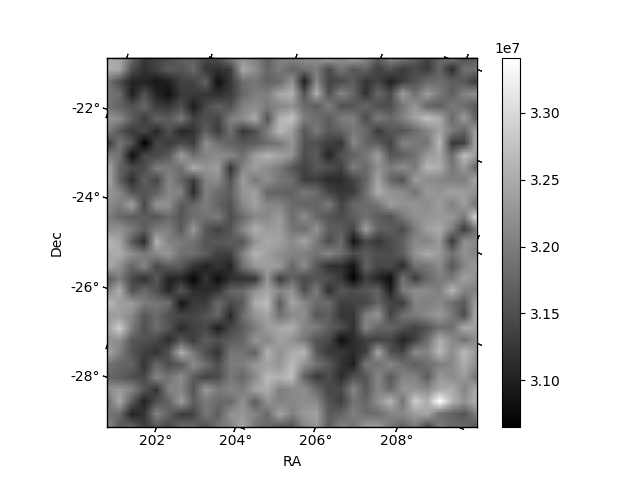
Histogram calculated using DETX and DETY for each event in the final _common_clean file
| Quadrant A | 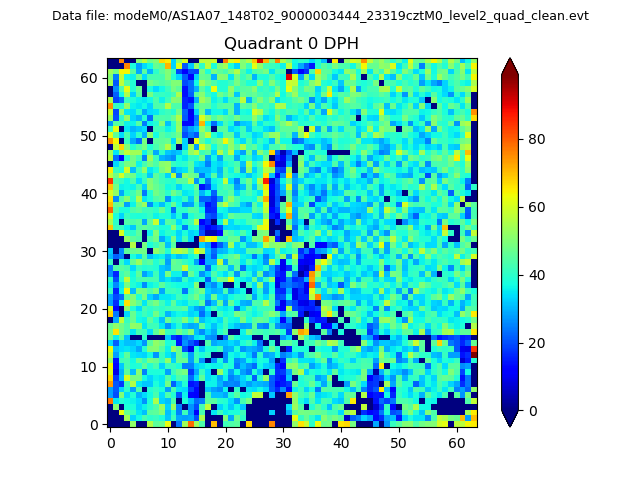 |
 |
Quadrant B |
|---|---|---|---|
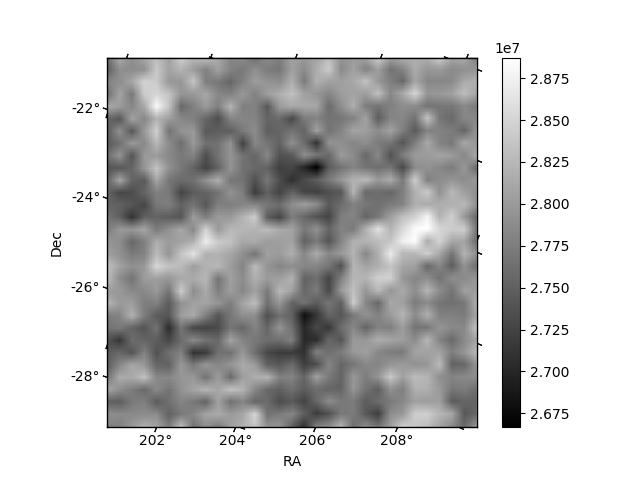
| Quadrant D |  |
 |
Quadrant C |
| Plot type | Count rate plots | Images |
|---|---|---|
| Comparison with Poisson distribution Blue bars denote a histogram of data divided into 1 sec bins. Red curve is a Poisson curve with rate = median count rate of data. |
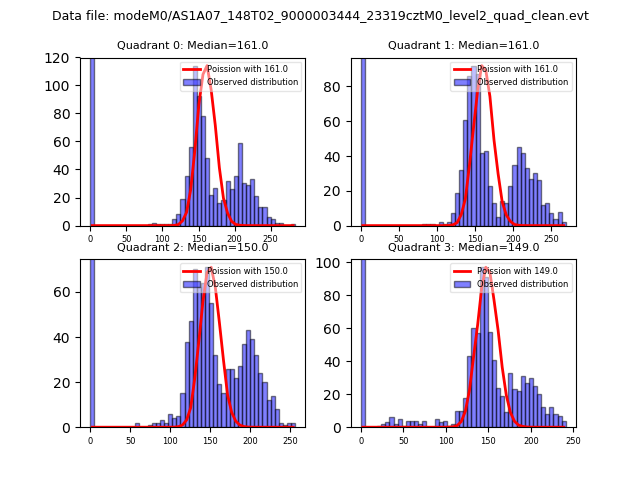 |
 |
| Quadrant-wise count rates Data is divided into 100 sec bins |
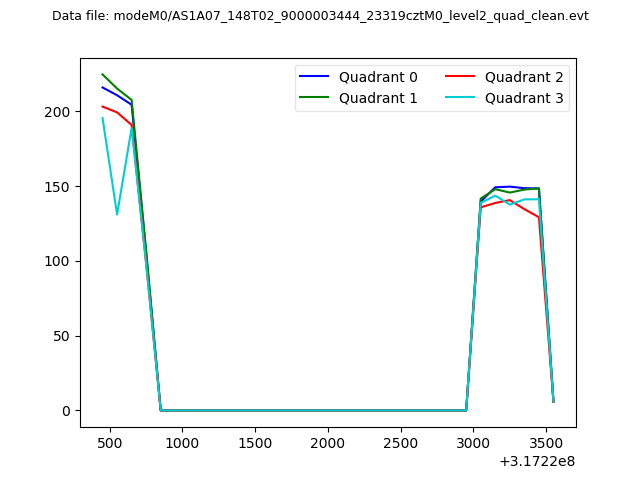 |
|
| Module-wise count rates for Quadrant A Data is divided into 100 sec bins |
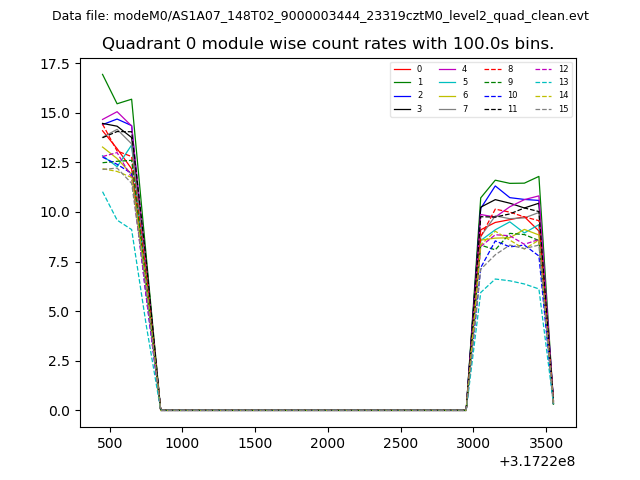 |
 |
| Module-wise count rates for Quadrant B Data is divided into 100 sec bins |
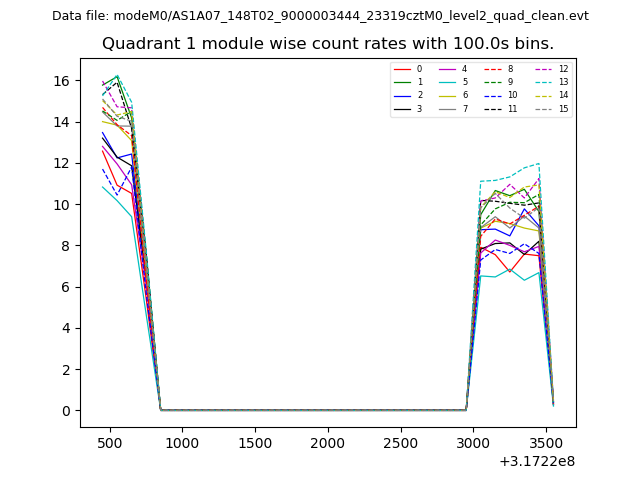 |
 |
| Module-wise count rates for Quadrant C Data is divided into 100 sec bins |
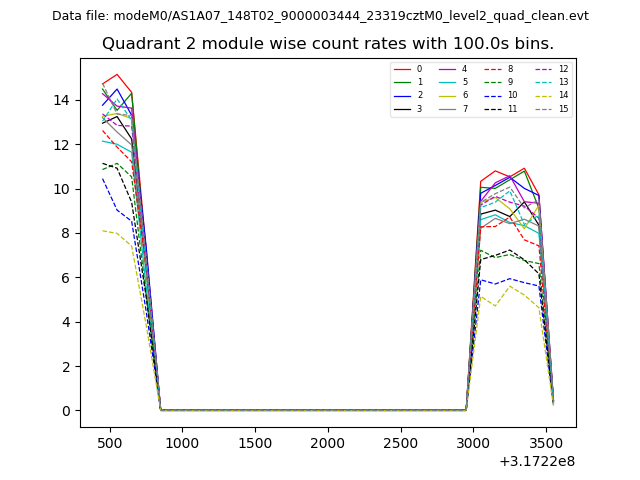 |
 |
| Module-wise count rates for Quadrant D Data is divided into 100 sec bins |
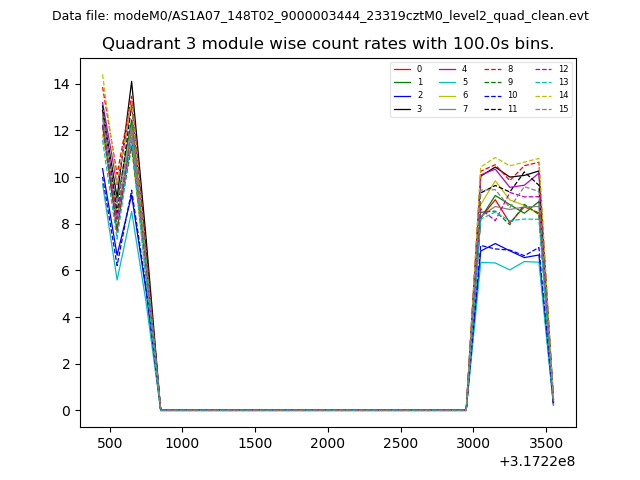 |
 |
| Parameter | Plot |
|---|---|
| CZT HV Monitor |  |
| D_VDD | 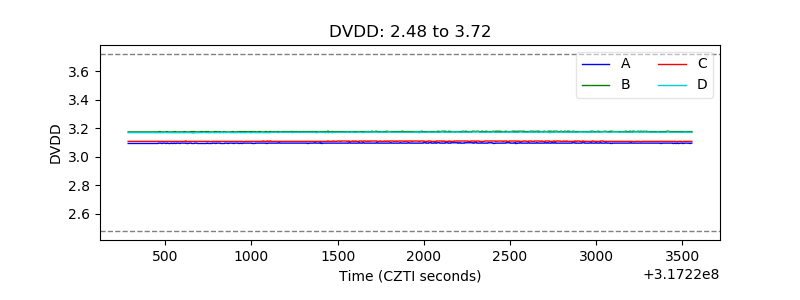 |
| Temperature 1 | 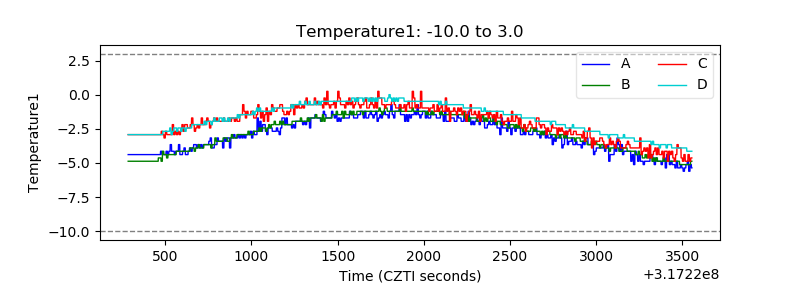 |
| Veto HV Monitor | 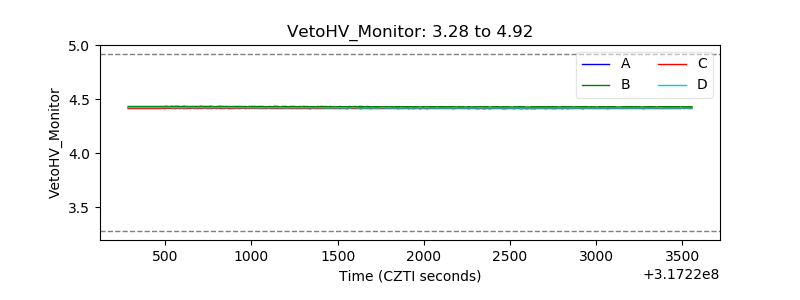 |
| Veto LLD |  |
| Alpha Counter | 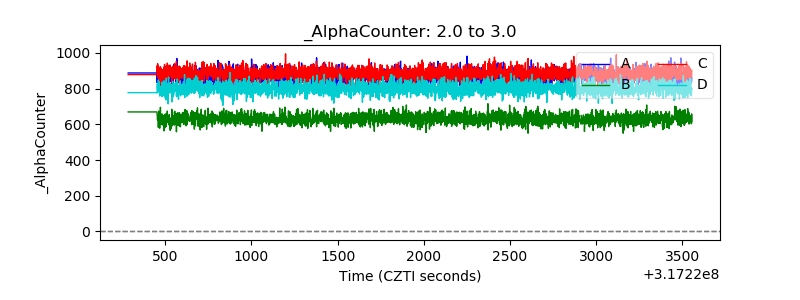 |
| _CPM_Rate | 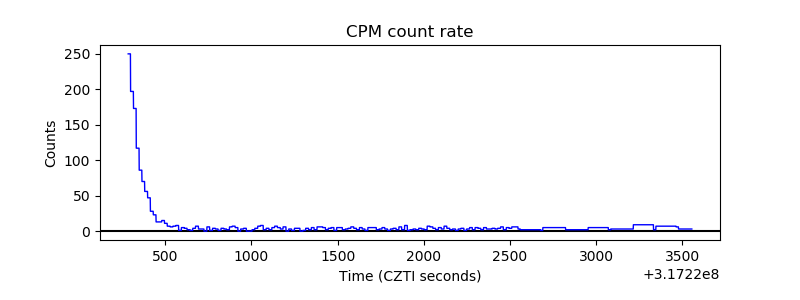 |
| CZT Counter | 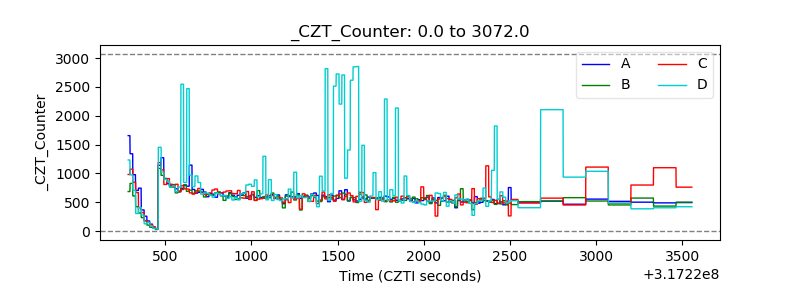 |
| +2.5 Volts monitor |  |
| +5 Volts monitor |  |
| _ROLL_ROT | 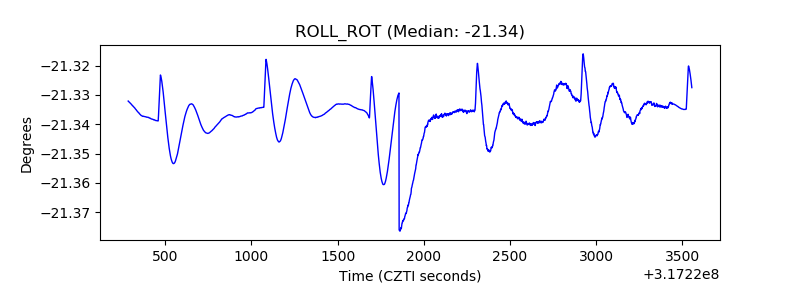 |
| _Roll_DEC | 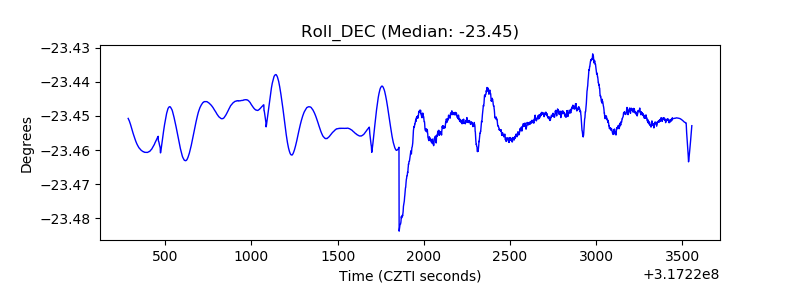 |
| _Roll_RA | 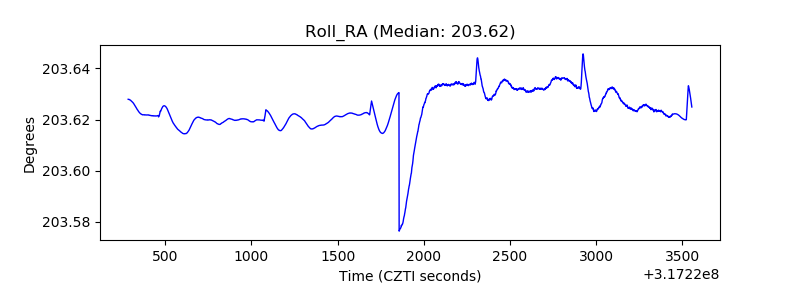 |
| Veto Counter | 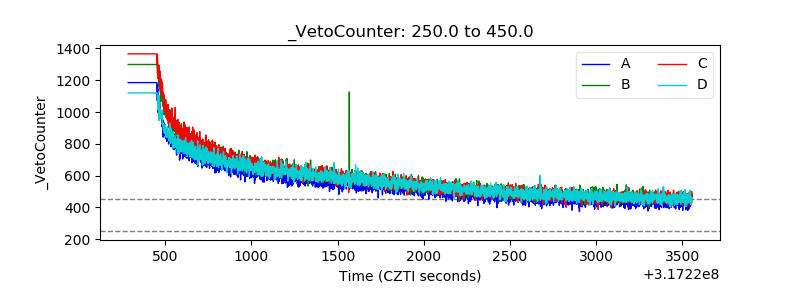 |